Asia Pacific Data Center Water Consumption Market Size and Share
Market Overview
| Study Period | 2019 - 2030 |
|---|---|
| Forecast Data Period | 2025 - 2030 |
| Historical Data Period | 2019 - 2023 |
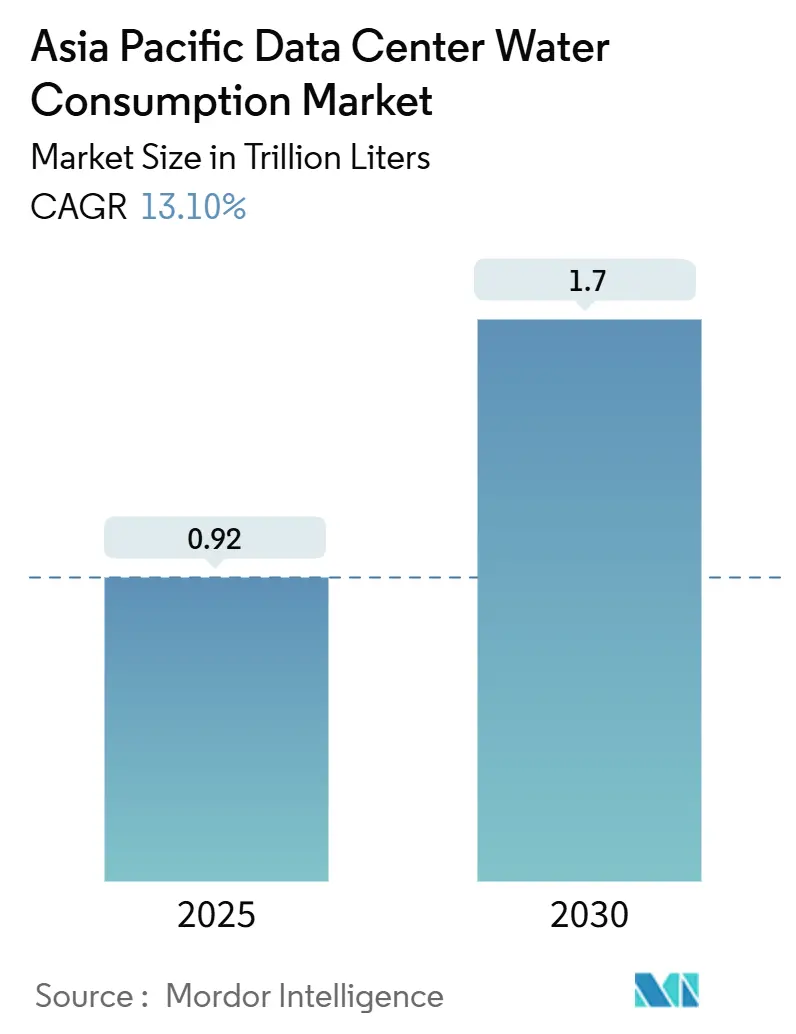
| Market Volume (2025) | 0.92 Trillion liters |
| Market Volume (2030) | 1.7 Trillion liters |
| Growth Rate (2025 - 2030) | 13.10% CAGR |
| Market Concentration | Medium |
Major Players *Disclaimer: Major Players sorted in no particular order Image © Mordor Intelligence. Reuse requires attribution under CC BY 4.0. | |
Asia Pacific Data Center Water Consumption Market Analysis by Mordor Intelligence
The Asia Pacific data center water consumption market stands at 0.92 trillion liters in 2025 and is forecast to reach 1.70 trillion liters by 2030, reflecting a solid 13.10% CAGR. Demand growth is closely tied to artificial-intelligence workloads, which draw roughly 20 times more cooling water per query than conventional search traffic and push cooling systems to absorb up to 97% of a facility’s total water draw. Intensifying regulation, most notably Singapore’s Green Data Centre Roadmap and China’s Green Data Center standard, presses operators to reduce water-to-power ratios or risk losing key permits. Liquid-immersion and direct-to-chip cooling have become pivotal tools, reducing Water Usage Effectiveness (WUE) to as low as 1.02 L/kWh, compared to today’s average of 1.8 L/kWh. Resource constraints are beginning to reshape market entry. Malaysia’s utilities regulator rejected 30% of new data-center applications in early 2024, citing water concerns, while Johor already faces a daily water shortfall of 123 million liters.
Key Report Takeaways
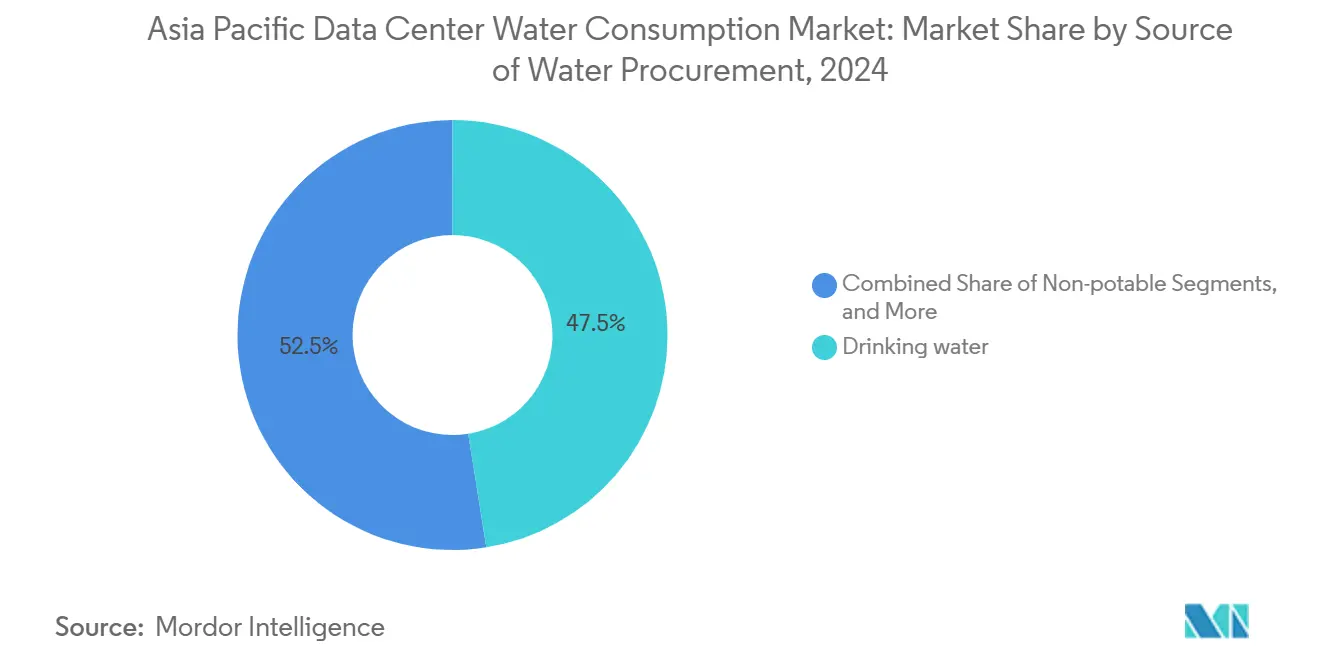
- By source of water procurement, drinking water supplied accounted for 47.5% of the data center water consumption market share in 2024; alternative sources are projected to expand at a 13.3% CAGR through 2030.
- By data center type, colocation facilities held a 53.2% revenue share in 2024, while cloud service providers are positioned to grow at a 14.20% CAGR through 2030.
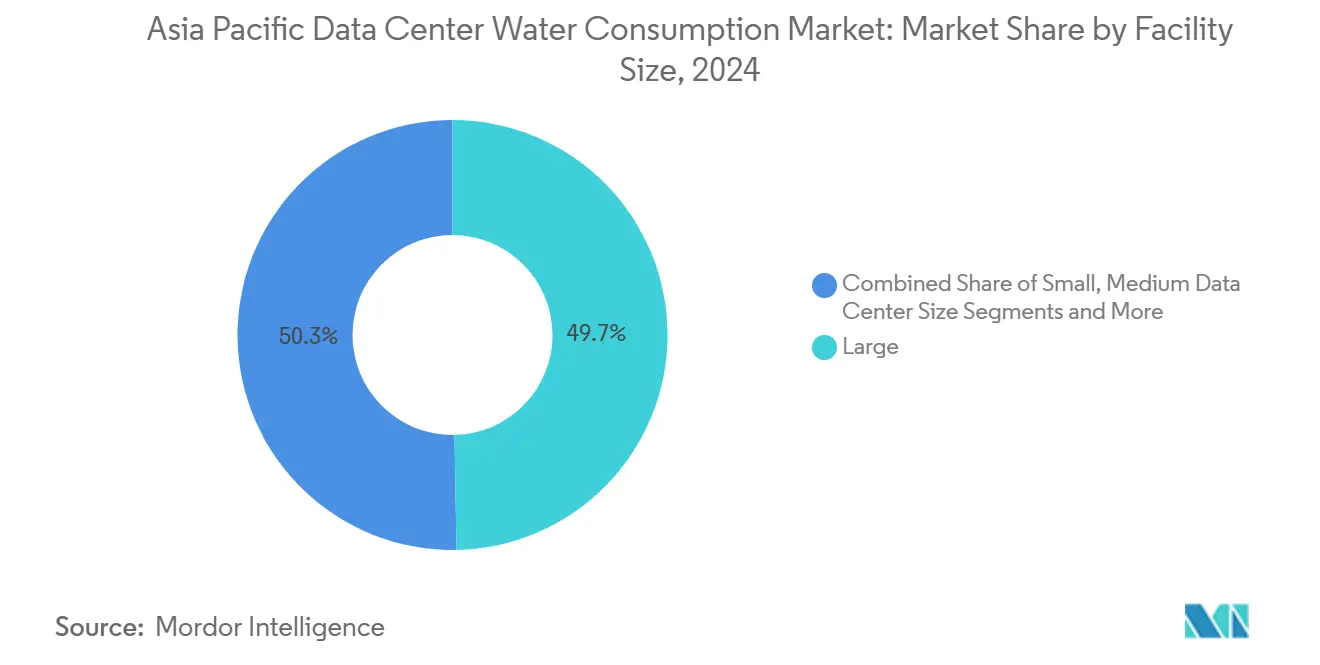
- By data center size, large-scale sites accounted for 49.7% share of the data center water consumption market size in 2024, whereas mega campuses are forecast to scale at a 13.9% CAGR.
- By country, China controlled a 32.6% share of the data center water consumption market in 2024; India is projected to lead growth with a 14.7% CAGR to 2030.
Asia Pacific Data Center Water Consumption Market Trends and Insights
Drivers Impact Analysis
| Driver | (~) % Impact on CAGR Forecast | Geographic Relevance | Impact Timeline |
|---|---|---|---|
| Mandated disclosure of Water Usage Effectiveness (WUE) in key Asia-Pacific markets | +2.1% | Singapore, China, Japan core, spillover to Malaysia | Medium term (2-4 years) |
| Green-loan access tied to water-positive targets | +1.8% | APAC financial hubs, with early adoption in Singapore, Hong Kong | Short term (≤ 2 years) |
| Accelerated switch to liquid and immersion cooling to support AI racks | +3.2% | Global, with concentration in Japan, China, India AI corridors | Short term (≤ 2 years) |
| Edge-cloud build-outs in water-scarce secondary cities | +1.9% | Indonesia, Malaysia secondary markets, India Tier-2 cities | Medium term (2-4 years) |
| Government-backed recycled-water corridors (e.g., Johor, Selangor, Sydney) | +1.4% | Malaysia, Australia, with pilot expansion to Thailand | Long term (≥ 4 years) |
| "Water-as-a-Service" vendor models lowering capex barriers | +1.0% | APAC emerging markets, particularly Vietnam, Philippines | Medium term (2-4 years) |
| Source: Mordor Intelligence | |||
Mandated disclosure of Water Usage Effectiveness (WUE)
Regulators now require granular reporting of water efficiency, turning WUE into a de facto license to operate. Singapore obliges sites drawing more than 60,000 m³ per year to file Water Efficiency Plans, making the metric a gating factor in new-site approval. China’s 2023 standard disqualifies operators exceeding 2.5 L/kWh from participating in public contracts, prompting private enterprises to align with government thresholds.[1]Enviliance Asia, “China Issues Green Data Center Standard,” enviliance.asia Japan’s semiconductor boom in Kumamoto has triggered similar disclosure drafts, signalling region-wide convergence. Early movers boasting sub-1.2 WUE report faster permitting and greater customer traction in outsourced services.
Green-loan access tied to water-positive targets
Capital markets are rewarding measurable stewardship. Princeton Digital Group secured a USD 280 million green loan, whose coupon falls as WUE improves, resulting in a 50–75 basis point reduction in annual interest.[2]Princeton Digital Group, “PDG Secures USD 280 Million Water-Linked Loan,” princetondg.comAdaniConneX closed India’s largest sustainability-linked package at USD 1.44 billion, linking rate adjustments to water positivity. Banks are increasingly framing water scarcity as a credit risk, accelerating liquidity for immersion-cooling retrofits and recycling systems that immediately raise efficiency. The new financing calculus shifts expansion capital toward operators able to quantify and report water metrics.
Accelerated switch to liquid and immersion cooling for AI racks
High-performance GPU clusters generate heat densities exceeding 40 kW per rack, rendering air cooling impractical above 25 kW.[3]Tom’s Hardware, “GPU Heat Density Outpaces Air Cooling,” tomshardware.com Closed-loop liquid methods reduce direct water draw, yet may increase absolute consumption because AI demand scales so rapidly. Digital Realty’s Singapore liquid deployment cut water per compute unit by 50% while supporting 29% higher power-density racks. Nvidia’s GB200 NVL72 utilizes direct-to-chip liquid circuits that operate 300 times more efficiently than evaporative towers. With land in the Asia Pacific at a premium, immersion platforms that handle ultra-dense loads within smaller footprints gain strategic appeal.
Edge-cloud build-outs in water-scarce secondary cities
5 G rollouts and latency-sensitive apps are pushing servers into smaller metropolitan clusters that lack robust water infrastructure. Java’s secondary cities illustrate the paradox: rainfall is high, yet groundwater depletion forces permit caps on industrial abstraction. Operators resort to dry coolers or hybrid chillers, accepting higher electricity bills to conserve water. Similar dynamics play out in Peninsular Malaysia and Tier-2 Indian cities, where local governments expedite the development of reuse corridors and reclaimed-water hookups to attract investors.
Restraints Impact Analysis
| Restraint | (~) % Impact on CAGR Forecast | Geographic Relevance | Impact Timeline |
|---|---|---|---|
| Region-wide tightening of groundwater abstraction licences | -2.3% | Indonesia, Malaysia, Thailand core, with spillover to Philippines | Short term (≤ 2 years) |
| High TDS levels in coastal APAC driving pre-treatment opex | -1.7% | Coastal markets including Singapore, Hong Kong, Manila, Jakarta | Medium term (2-4 years) |
| Public backlash against hyperscale builds in drought-prone zones | -1.9% | India water-stressed corridors, Australia drought regions, Thailand central plains | Medium term (2-4 years) |
| Sparse metering data hampers project financing for retrofits | -1.2% | APAC emerging markets, particularly Vietnam, Philippines, Indonesia | Short term (≤ 2 years) |
| Source: Mordor Intelligence | |||
Region-wide tightening of groundwater abstraction licences
Southeast Asian regulators now price water scarcity into extraction permits. Indonesia is drafting uniform quotas after studies link Jakarta’s sinking zones to excessive water pumping. Malaysia’s National Water Services Commission estimates USD 6.3 billion in pipe replacement to curb leakage, positioning data center moratoriums as a stopgap risk management measure. Operators must pivot to municipal supplies or invest in on-site recycle plants; each option inflates opex and complicates site selection.
High TDS in coastal Asia Pacific driving pre-treatment opex
Coastal water often exceeds 1,000 ppm total dissolved solids, necessitating reverse-osmosis pre-treatment, which adds USD 0.50-0.75 per m³ to the process. Singapore employs membrane bioreactor lines that recover 98% water, yet demand high capital outlays. Jakarta and Manila face steeper challenges due to their older pipe networks, compelling operators to weigh connectivity benefits against the costly handling of brine. Rising salt levels also shorten equipment lifespans, motivating regional moves inland despite higher latency.
Segment Analysis
By Source of Water Procurement: Shift Toward Alternative Supplies
Traditional potable lines held 47.5% of the Asia Pacific data center water consumption market share in 2024, underscoring historic dependence on municipal grids. The Asia Pacific data center water consumption market size allocated to alternative sources is projected to grow at a 13.3% CAGR, driven by tighter urban quotas and the rapid advancement of reclaimed-water technology. AWS already cools 20 Asia-Pacific facilities exclusively on treated wastewater. Digital Realty reports 36% of its regional intake sourced from non-potable conduits. Malaysian state utility Ranhill’s recycled-water corridor illustrates government buy-in, delivering 70 million liters per day to Johor campuses. Rain capture and seawater are growing but face higher pretreatment hurdles; however, membrane costs fell 15% in 2024, making closed-loop seawater cycles viable in high-rise sites such as those in Hong Kong and Singapore.
Price incentives favor operators who can hedge their potable exposure. Facilities with dual-feed schemes, one potable and one reclaimed, report 12% lower opex during drought seasons, cushioning tariff spikes. New-build RFPs from cloud tenants now stipulate diversified intake, compelling colocation landlords to integrate onsite treatment from day one. Over the forecast horizon, alternative streams are expected to eclipse drinking water in absolute volume, reshaping the purchasing landscape for chemical treatments and filtration media.
Note: Segment shares of all individual segments available upon report purchase
By Data-Center Type: Cloud Providers Accelerate
Colocation landlords captured a 53.2% share in 2024, benefiting from multi-tenant economies that distribute water costs. Yet hyperscale cloud providers are expanding faster, adding 14.20% CAGR capacity through 2030 as AI adoption turns water into a core KPI. The Asia Pacific data center water consumption market size for cloud nodes is expected to surpass colocation footprints by 2029, assuming announced projects proceed on schedule. Microsoft’s zero-water pledge by 2026 and STT GDC’s immersion-ready blueprints showcase capital depth that smaller operators struggle to match.
Government incentives increasingly tilt toward cloud majors with verifiable WUE records. Singapore’s latest call-for-capacity scheme allocated 80 MW exclusively to applicants with a capacity of less than 1.3 L/kWh, a threshold only liquid-cooled hyperscalers could meet more effectively. Colocation incumbents must modernize to retain enterprise tenants, who now prioritize water efficiency in their RFP scoring. Partnerships with equipment makers allow phased retrofits; for example, Equinix introduced rack-level rear-door heat exchangers that curb evaporative losses by 30% without major downtime.
By Facility Size: Mega-Campus Momentum
Large sites absorbed 49.7% of 2024 demand, but mega campuses are scaling at a 13.9% CAGR, driven by AI training clusters that require contiguous power and cooling zones. The data center water consumption market share tied to mega builds is expected to reach a tipping point when ongoing projects in Johor Bahru, Hyderabad, and Northern China come online after 2026. Economies of scale allow on-site polishing plants that recapture 90% loop water, driving WUE below 1.5 even in hot climates.
Mega-campus operators integrate comprehensive telemetry, tracking every liter against rack-level loads, an investment uneconomical for sub-20 MW sites. Smaller footprints respond by adopting modular liquid coolers with self-contained flat-plate heat exchangers, which cut connection time to municipal mains and reduce approval cycles. Still, credit agencies assign better sustainability scores to mega sites because their per-compute water intensity is demonstrably lower.
Note: Segment shares of all individual segments available upon report purchase
Geography Analysis
China remains the largest node, accounting for 32.6% of the data center water consumption market in 2024, largely due to the presence of Alibaba, Tencent, and international cloud consortia. The annual draw is roughly 1.3 trillion liters, equivalent to the domestic use of 26 million residents. Beijing’s “Eastern Data, Western Compute” migration is reassessing capacity away from arid western zones toward cooler northern provinces, aided by hydropower surplus around the Three Gorges cluster.
India is the growth engine, forecast at a 14.7% CAGR as New Delhi’s digital blueprint earmarks hyperscale corridors in Bangalore, Hyderabad, and Chennai. Severe aquifer depletion compels mandates for 100% wastewater recycling on new sites; CtrlS claims it recycles 99% of intake via dual-stage reverse osmosis, saving 15 million liters annually. Desalination plants under construction in Tamil Nadu and Gujarat promise alternative water sources for coastal data centers by 2027.
Japan, Indonesia, Australia, and New Zealand form a heterogeneous second tier. Japan’s Kumamoto valley is water-strained due to burgeoning semiconductor fabs, accelerating adoption of direct-to-chip liquid cooling to keep WUE below 1.4. Indonesia experiences plentiful rainfall yet suffers from fragmented sewage grids; Jakarta’s new industrial water policy caps groundwater use, forcing plants to connect to underdeveloped municipal lines. Australia’s five-star energy code, coming into force in mid-2025, also encourages operators to use dry coolers and heat-rejection towers that require minimal water, thereby leveraging abundant solar electricity for fan loads. New Zealand’s hydro capacity and cool climate minimize the need for cooling water altogether, but limited domestic demand tempers investment appetite.
Competitive Landscape
Asia Pacific’s data center water consumption market displays moderate fragmentation but is edging toward consolidation as compliance costs rise. Hyperscale providers, such as AWS, Microsoft, Google Cloud, and Alibaba Cloud, are advantaged by their deep resources to retrofit or build liquid systems that achieve sub-1.0 L/kWh benchmarks. AWS already claims 0.19 L/kWh through closed-loop cooling and the use of reclaimed supplies. Digital Realty partnered with CoolestDC to retrofit Singapore halls, reducing water consumption per compute unit by 50% and increasing densities by 29%.
Smaller providers are experimenting with Water-as-a-Service vendors that finance and operate recycle plants, converting capex into predictable opex. Malaysia’s rejection of one-third of 2024 permit requests indicates that regulators favor documented stewardship, prompting consolidation as under-capitalized players exit. New entrants concentrate on edge niches, offering 1-10 MW pods optimized for air cooling in low-humidity micro-markets, thereby avoiding strict water quotas.
Equipment suppliers are co-creating designs: Supermicro collaborated with Fujitsu and Nidec on stainless steel CDU loops, which are set to launch in 2025. Strategic alliances ease technology risks while ensuring parts availability across multiple geographies, a key differentiator when travel restrictions hamper maintenance crews.
Asia Pacific Data Center Water Consumption Industry Leaders
Equinix
Digital Realty
STT GDC
NTT Data
GDS Services
- *Disclaimer: Major Players sorted in no particular order
Recent Industry Developments
- June 2025: Tomorrow Net joins Nobeoka City’s immersion-cooling pilot for container data centers powered by local renewables.
- May 2025: Fixstars, Getworks, and NTTPC develop operational environments for water-cooled GPU servers, aiming for nationwide rollout by summer 2025.
- April 2025: Fujitsu teams with Supermicro and Nidec to launch water-cooling solutions targeting 1.2 PUE averages.
- April 2025: NTT Facilities unveils Products Engineering Hub for Data Center Cooling, validating liquid systems with stainless-steel piping.
Asia Pacific Data Center Water Consumption Market Report Scope
The study tracks the critical applications of water for running large data centers, such as DC cooling, and power generation. The study also includes key applications based on the Water Consumption in Data Centers. The study also includes the overall water consumption based on the DC footprint across regions in terms of trillion liters. Lastly, the study tracks the underlying trends and developments conceptualized by leading industry data center operators and cloud service providers.
The Study of Data Center Water Consumption in the Asia Pacific region is Segmented by Source of Water Procurement (Potable Water, Non-Potable Water, Other Alternate Sources), by Data Center Type (Enterprise, Colocation, Cloud Service Providers), and by Data Center Size (Mega, Massive, Large, Medium, Small). The Market Sizes and Forecasts are Provided in Terms of Volume (Trillion Liters).
| Potable Water (municipal) |
| Non-potable/Treated Wastewater (greywater) |
| Alternate Sources (ground-water, surface-water, seawater, rainwater, produced-water) |
| Enterprise |
| Colocation |
| Cloud Service Providers (CSPs) |
| Mega |
| Massive |
| Large |
| Medium |
| Small |
| China |
| India |
| Japan |
| Indonesia |
| Rest of Asia Pacific |
| By Source of Water Procurement | Potable Water (municipal) |
| Non-potable/Treated Wastewater (greywater) | |
| Alternate Sources (ground-water, surface-water, seawater, rainwater, produced-water) | |
| By Data-Center Type | Enterprise |
| Colocation | |
| Cloud Service Providers (CSPs) | |
| By Data-Center Size | Mega |
| Massive | |
| Large | |
| Medium | |
| Small | |
| By Country | China |
| India | |
| Japan | |
| Indonesia | |
| Rest of Asia Pacific |
Key Questions Answered in the Report
What is the current size of the data center water consumption market in Asia Pacific?
NTT Facilities unveils Products Engineering Hub for Data Center Cooling, validating liquid systems with stainless-steel piping. 1. The data center water consumption market stands at 0.92 trillion liters in 2025 and is projected to grow to 1.70 trillion liters by 2030.
Why is Water Usage Effectiveness (WUE) important for data centers?
Regulators in Singapore, China, and Japan now mandate WUE disclosure, and facilities exceeding 2.5 L/kWh can lose permits or public contracts, making WUE a key compliance and competitive metric.
How are financial markets influencing water stewardship in data centers?
Green and sustainability-linked loans adjust interest rates to WUE milestones, cutting borrowing costs up to 75 basis points for operators that hit aggressive efficiency targets.
Which data-center segment is growing fastest in water consumption?
Cloud service provider facilities are expanding at a 14.20% CAGR through 2030, driven by AI workload density that requires advanced liquid-cooling technologies.


