Data Center Water Consumption Market Size and Share
Market Overview
| Study Period | 2020 - 2031 |
|---|---|
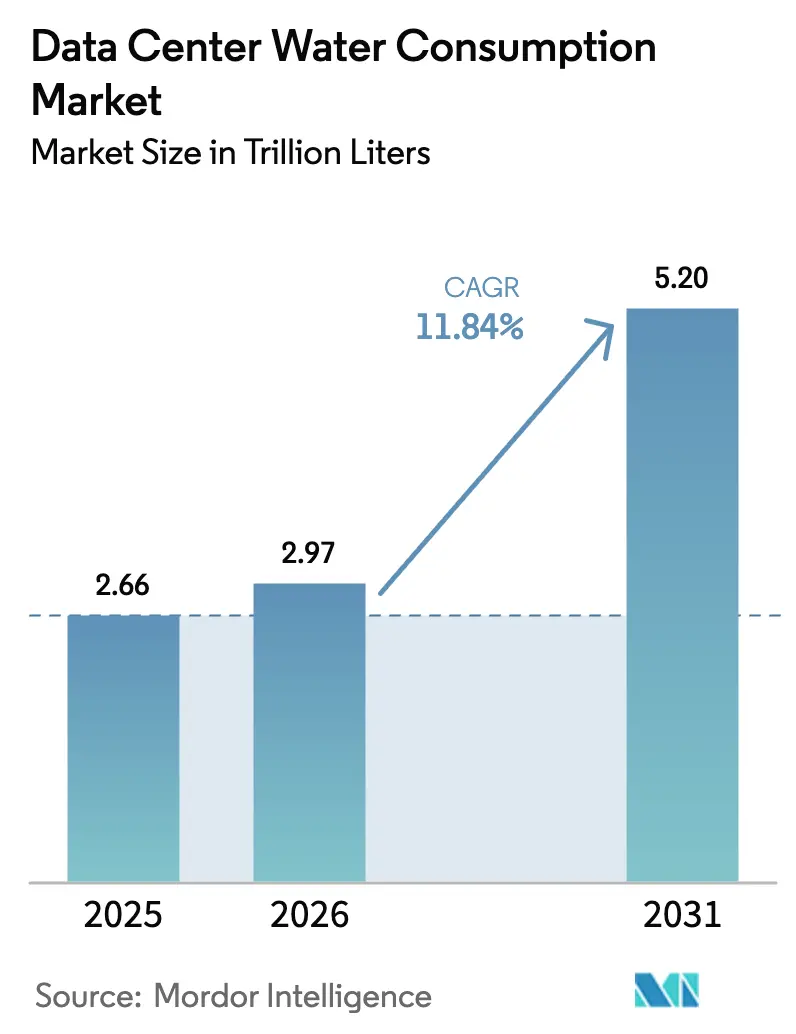
| Market Volume (2026) | 2.97 Trillion liters |
| Market Volume (2031) | 5.2 Trillion liters |
| Growth Rate (2026 - 2031) | 11.84% CAGR |
| Fastest Growing Market | Asia Pacific |
| Largest Market | North America |
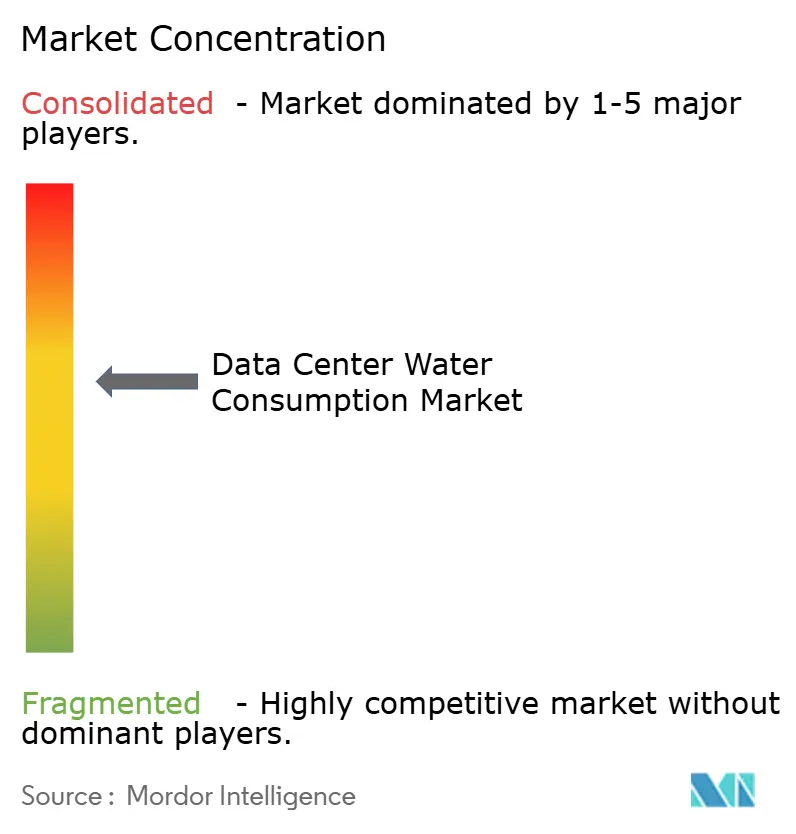
| Market Concentration | Medium |
Major Players *Disclaimer: Major Players sorted in no particular order Image © Mordor Intelligence. Reuse requires attribution under CC BY 4.0. | |
Data Center Water Consumption Market Analysis by Mordor Intelligence
The data center water consumption market size in 2026 is estimated at 2.97 trillion liters, growing from 2025 value of 2.66 trillion liters with 2031 projections showing 5.2 trillion liters, growing at 11.84% CAGR over 2026-2031. The rise stems from AI-intensive servers that operate at chip power densities above 700 watts, creating heat loads that older air-cooling systems cannot handle. Larger campuses now treat water as their primary design bottleneck and deploy sealed liquid loops, immersion baths, and direct-to-chip blocks that temper processors while recycling most of the coolant volume. Potable supplies remain the main source, but municipal scrutiny and tariffs have accelerated a pivot to reclaimed and industrial water, especially in drought-prone U.S. southwest counties.
Key Report Takeaways
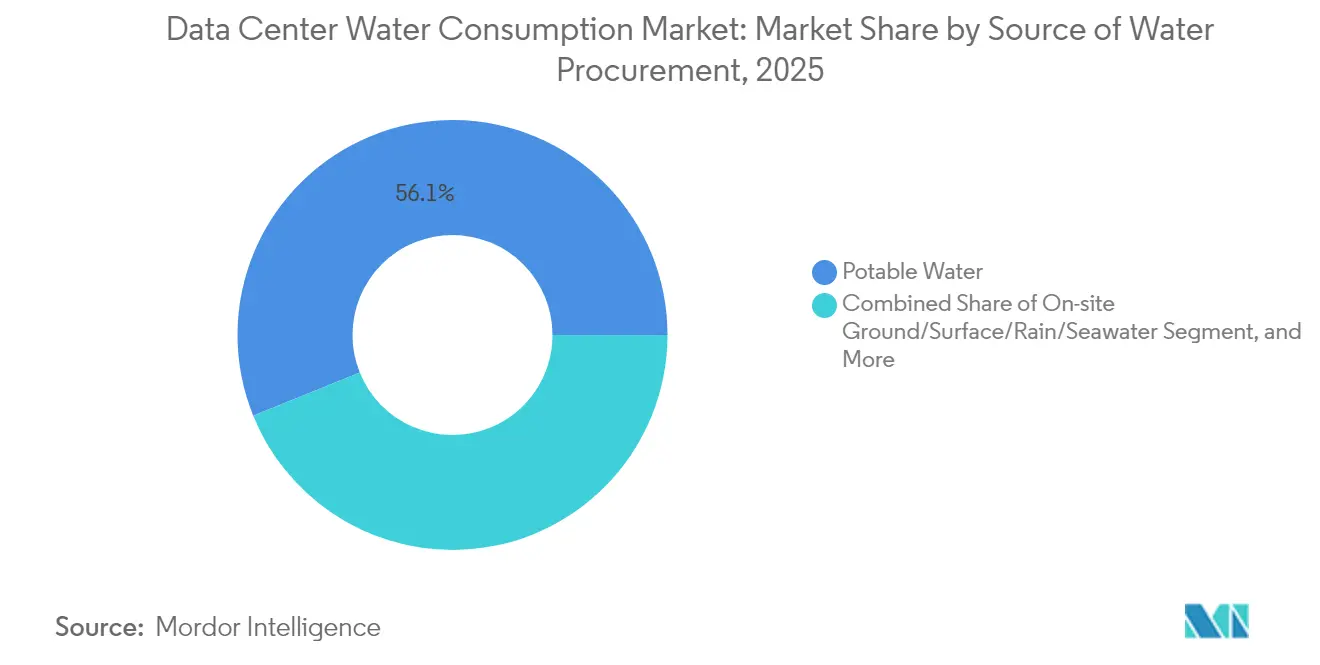
- By source of water procurement, potable supplies accounted for 56.12% of the data center water consumption market size in 2025, while reclaimed water grew at the fastest rate of 13.68% CAGR.
- By cooling technology, evaporative and adiabatic systems led with 46.05% revenue share in 2025; liquid immersion and direct-to-chip solutions are expected to expand at a 12.92% CAGR to 2031.
- By water-treatment method, reverse osmosis accounted for 41.62% share of the data center water consumption market size in 2025; UV disinfection is projected to rise at a 12.61% CAGR.
- By ownership model, hyperscale operators held 54.83% of the data center water consumption market share in 2025, while wholesale colocation is projected to post the fastest 13.39% CAGR through 2031.
- By geography, North America captured a 38.55% of the data center water consumption market share in 2025, whereas the Asia-Pacific region accelerated at 12.31% CAGR through 2031.
Note: Market size and forecast figures in this report are generated using Mordor Intelligence’s proprietary estimation framework, updated with the latest available data and insights as of 2026.
Global Data Center Water Consumption Market Trends and Insights
Drivers Impact Analysis*
| Driver | (~) % Impact on CAGR Forecast | Geographic Relevance | Impact Timeline |
|---|---|---|---|
| Hyperscale build-outs lift absolute water demand | +3.2% | Global, concentrated in North America andAPAC | Medium term (2-4 years) |
| Liquid-cooled high-density racks adoption | +2.8% | North America andEU, expanding to APAC | Short term (≤ 2 years) |
| ESG-linked financing tied to water metrics | +1.9% | Global, strongest in EU andNorth America | Long term (≥ 4 years) |
| Shift to evaporative and adiabatic cooling in large campuses | +1.7% | Arid regions: Southwest US, Middle East, Australia | Medium term (2-4 years) |
| AI-driven real-time cooling optimization | +1.4% | Global, led by hyperscale operators | Short term (≤ 2 years) |
| Grey-water offset incentives in major metros | +1.1% | Water-stressed metros: Phoenix, Singapore, Cape Town | Long term (≥ 4 years) |
| Source: Mordor Intelligence | |||
Hyperscale build-outs lift absolute water demand
Single campuses now draw up to 200 million gallons of water a year, eight times the amount of a traditional 1 MW facility, intensifying local watershed stress. Google alone consumed almost 6 billion gallons in 2024, a figure that increased by 8% alongside the rollout of AI servers. Community backlash surfaces when data-center demand equals that of 50,000 residents, prompting pauses such as the Chile project Google put on hold in late 2024.
Liquid-cooled high-density racks adoption
Immersion and direct-to-chip systems mainstream as rack densities crest 200 kW, permitting 300-fold water-cycle improvements in closed loops compared with evaporative towers. Google’s Project Deschutes standardized manifold blocks across 2,000 TPU pods in 2025. Colocation specialist Colovore rebuilt existing halls for liquid manuals, illustrating the CAPEX needed to pivot legacy stock.
ESG-linked financing tied to water metrics
The EU’s Energy Efficiency Directive compels annual disclosure of water usage for facilities above 100 kW, a transparency criterion investors already weigh into credit risk[1]European Commission, “Energy Efficiency Directive Article 12,” europa.eu . Moody’s lists water stress among top data-center hazards, and insurers charge extra premiums on assets tapping arid aquifers. Amazon’s 0.19 L/kWh efficiency statistic now appears in sustainability-linked loan term sheets.
Shift to evaporative and adiabatic cooling on mega-campuses
Operators in Phoenix deploy large-scale evaporative chillers for power savings, yet open loops can exceed 1 million gallons a day during peak season. Microsoft counters that risk by adding sealed recapture loops at its Arizona builds, slashing consumptive loss despite desert humidity.
Restraints Impact Analysis*
| Restraint | (~) % Impact on CAGR Forecast | Geographic Relevance | Impact Timeline |
|---|---|---|---|
| Growing scarcity in prime DC regions | -2.1% | Southwest US, Singapore, Cape Town, parts of EU | Short term (≤ 2 years) |
| Public scrutiny and disclosure mandates | -1.8% | EU, North America, expanding globally | Medium term (2-4 years) |
| Insurance premium hikes for water-intensive assets | -1.3% | Water-stressed regions globally, concentrated in arid markets | Medium term (2-4 years) |
| Energy-vs-water trade-off for alternative cooling | -0.9% | Global, particularly relevant in hybrid climate zones | Long term (≥ 4 years) |
| Source: Mordor Intelligence | |||
Growing scarcity in prime DC regions
Forty-three percent of the U.S. landmass registered drought in 2024, tightening supply in hubs like Northern Virginia and Phoenix. Singapore froze new builds until projects prove water neutrality, while China’s eastern coast relocated loads inland under the Eastern Data Western Compute plan.
Public scrutiny and disclosure mandates
Europe now publishes annual water usage effectiveness figures, and similar legislation is queued in several U.S. states, empowering civil groups that halted Google’s groundwater extraction bid in South Carolina in 2024.
*Our forecasts treat driver/restraint impacts as directional, not additive. The impact forecasts reflect baseline growth, mix effects, and variable interactions.
Segment Analysis
By Source of Water Procurement: Reclaimed water gains momentum
Potable flow represented 56.12% of the data center water consumption market in 2025; reclaimed alternatives are already growing at a rate of 13.68% each year, climbing from canal feeds, storm runoff, and tertiary effluent streams.Operators retrofit campuses with polishing plants that treat high-salinity or high-silica sources, reducing vulnerability to municipal rationing. The data center water consumption market size attributable to reclaimed inputs could reach over 40% by the end of the decade if current incentive programs persist.
A multi-source design also reduces the risk of expansion in water-stressed metropolitan areas. Google’s Belgium site purifies industrial canal water, freeing potable reserves for households. Digital Realty pilots AI that dynamically allocates between potable water, recovered condensate, and stormwater based on real-time pricing and availability, an approach likely to be adopted across the data center water consumption industry.


By Cooling Technology: Liquid systems transform thermal management
Evaporative and adiabatic towers still account for 46.05% of the data center water consumption market share in 2025, favored for their low energy draw in arid climates. In contrast, liquid immersion racks expand at a 12.92% CAGR due to superior density and water retention. Closed-loop chillers deliver comparable outlet temperatures without evaporation, enabling Microsoft’s 2026 zero-water builds in Phoenix and Wisconsin.
Operators are increasingly bolting heat-recovery networks onto immersion arrays, exporting waste heat to nearby housing grids and securing local tax abatements. Such designs demonstrate that the data center water consumption market can reduce gallons while selling surplus thermal units, thereby bolstering project IRRs without increasing rack rates.
By Water-Treatment Method: Advanced purification drives efficiency
Reverse osmosis earned 41.62% share in 2025 because it strips chloride, silica, and micro-organisms that foul microchannel plates, though traditional systems waste 10-20% of input water. UV disinfection, advancing at 12.61% CAGR, offers near-zero reject streams and lower power load, key to the data center water consumption industry when electricity prices rise.
Next-generation membranes recycle concentrate back into inflow, cutting brine discharge to nil. Filtration skids move upstream, extending RO life and reducing the need for chemical softeners. Integrated trains thus improve both water and energy KPIs, supporting ESG-linked loan covenants.

By Ownership Model: Colocation accelerates efficiency innovation
Hyperscalers captured 54.83% of the 2025 volume, justifying in-house R&D efforts such as Google’s Deschutes manifold and Microsoft’s zero-water loop, each a multimillion-dollar engineering endeavor. Wholesale colocation lags in absolute volume but scales fastest, driven by enterprise AI outsourcing, although public CAGR figures remain sparse.
Retail and edge operators import hyperscale tools by partnering with equipment vendors, standardizing immersion blocks and autonomous treatment pods that fit sub-5 MW sites. As buyers insist on transparent metrics, any firm ranked poorly on water usage effectiveness risks churn, a commercial reality reshaping the data center water consumption market.
Geography Analysis
North America maintained a 38.55% market share of the data center water consumption market in 2025, led by Northern Virginia clusters and Phoenix’s desert megacampus lineup. Operators migrate northward or adopt closed-loop liquid suites. Microsoft’s Arizona estate recovered every liter during pilot runs, assuring local councils of potable neutrality.
The Asia-Pacific region increases at the fastest rate, with a 12.31% CAGR. China alone could triple its draw to 3.05 billion m³ by 2031 under its inland relocation scheme, which leverages cooler climates and hydro reservoirs. Malaysia’s Iskandar corridor and Indonesia’s Batam island court hyperscalers with high-voltage power and grey-water access, yet authorities demand environmental impact assessments that quantify per-rack consumption.
Europe enforces the strictest disclosure regime, Germany’s Energy Efficiency Act caps PUE, indirectly capping make-up water, while the Climate Neutral Data Centre Pact targets zero-carbon and water-positive operations by 2030. Amsterdam’s moratorium is lifted only for projects that prove water neutrality, steering design toward seawater intakes and industrial wastewater synergies.
Mordor Intelligence provides coverage of the data center water consumption market across other key regional markets, including Europe, Asia, North America, and South America, each with their regulatory frameworks and demand patterns. Detailed country-level analysis extends to United Kingdom, Canada, Brazil, Mexico, Germany, and France incorporating local coverage and market participation, as required.


Competitive Landscape
The data center water consumption market exhibits moderate concentration, with the top five operators, such as Google, Microsoft, Amazon, Meta, and Alibaba, accounting for just over 60% of the total draw. Google logged 6 billion gallons in 2024, yet pairs volume with a pledge to replenish 120% of global usage by 2030. Microsoft’s zero-water cooling aims for parity in parched regions, while Amazon advertises a class-leading 0.19 L/kWh efficiency that lenders reward with lower borrowing spreads.
Specialist vendors capitalize on the shift to liquid systems: Carrier’s 2025 QuantumLeap chiller integrates waterless blocks, drawing interest from colocation chains. [3]“Carrier Launches QuantumLeap,” Carrier, carrier.comDigital Realty collaborates with Ecolab to implement AI-driven leakage prediction, resulting in a 15% reduction in daily water flow in test halls. As water scarcity intensifies, such partnerships will define advantage, making stewardship a key criterion in RFP shortlists across the data center water consumption industry.
Data Center Water Consumption Industry Leaders
Amazon Web Services Inc.
Equinix, Inc.
Microsoft Corporation
Meta, Inc.
Digital Realty Trust Inc.
- *Disclaimer: Major Players sorted in no particular order

Recent Industry Developments
- June 2025: Amazon unveiled a water-positive roadmap for Georgia campuses, expanding recycled-water use to 24 sites and targeting 8 billion liters of annual replenishment.
- June 2025: A USD 2 billion AI data center in West Jordan, Utah, announced advanced water-recirculation loops that curb evaporative loss.
- May 2025: Veolia took full control of Water Technologies and Solutions to accelerate data-center-focused treatment R&D.
- April 2025: Google rolled out Project Deschutes liquid manifolds across 2,000 TPU pods, standardizing immersion for large AI clusters.


Global Data Center Water Consumption Market Report Scope
Data centers rely heavily on water for their cooling systems, which include cooling towers, chillers, pumps, pipes, heat exchangers, condensers, and computer room air handler (CRAH) units. Additionally, data centers require water for their humidification systems and general facility maintenance. The study examines the critical applications of water in large data centers, including cooling and power generation. It includes key applications based on water consumption in data centers and quantifies overall water usage in billion liters across regions. The study also identifies underlying trends and developments conceptualized by leading industry data center operators.
The Data Center Water Consumption Market Report is Segmented by Source of Water Procurement (Potable Water, Reclaimed / Grey Water, and On-site Ground / Surface / Rain / Seawater), Cooling Technology (Evaporative and Adiabatic Cooling, Liquid Immersion and Direct-To-Chip, Closed-Loop Chillers and Heat-Reuse, and Hybrid / Novel Low-Water Systems), Water-Treatment Method (Filtration, Reverse Osmosis, UV Disinfection, Chemical Softening and Others), Ownership Model (Hyperscale, Wholesale Colocation, and Retail / Edge), and Geography (North America, South America, Europe, Asia-Pacific, and Middle East and Africa). The Market Forecasts are Provided in Terms of Volume (Liters).
| Potable Water |
| Reclaimed / Grey Water |
| On-site Ground / Surface / Rain / Seawater |
| Evaporative and Adiabatic Cooling |
| Liquid Immersion and Direct-to-Chip |
| Closed-Loop Chillers and Heat-Reuse |
| Hybrid / Novel Low-Water Systems |
| Filtration |
| Reverse Osmosis |
| UV Disinfection |
| Chemical Softening and Others |
| Hyperscale |
| Wholesale Colocation |
| Retail / Edge |
| North America | United States | |
| Canada | ||
| Mexico | ||
| Europe | Germany | |
| United Kingdom | ||
| France | ||
| Italy | ||
| Spain | ||
| Rest of Europe | ||
| Asia-Pacific | China | |
| Japan | ||
| India | ||
| South Korea | ||
| Australia | ||
| Rest of Asia-Pacific | ||
| South America | Brazil | |
| Argentina | ||
| Rest of South America | ||
| Middle East and Africa | Middle East | Saudi Arabia |
| United Arab Emirates | ||
| Turkey | ||
| Rest of Middle East | ||
| Africa | South Africa | |
| Egypt | ||
| Nigeria | ||
| Rest of Africa | ||
| By Source of Water Procurement | Potable Water | ||
| Reclaimed / Grey Water | |||
| On-site Ground / Surface / Rain / Seawater | |||
| By Cooling Technology | Evaporative and Adiabatic Cooling | ||
| Liquid Immersion and Direct-to-Chip | |||
| Closed-Loop Chillers and Heat-Reuse | |||
| Hybrid / Novel Low-Water Systems | |||
| By Water-Treatment Method | Filtration | ||
| Reverse Osmosis | |||
| UV Disinfection | |||
| Chemical Softening and Others | |||
| By Ownership Model | Hyperscale | ||
| Wholesale Colocation | |||
| Retail / Edge | |||
| By Geography | North America | United States | |
| Canada | |||
| Mexico | |||
| Europe | Germany | ||
| United Kingdom | |||
| France | |||
| Italy | |||
| Spain | |||
| Rest of Europe | |||
| Asia-Pacific | China | ||
| Japan | |||
| India | |||
| South Korea | |||
| Australia | |||
| Rest of Asia-Pacific | |||
| South America | Brazil | ||
| Argentina | |||
| Rest of South America | |||
| Middle East and Africa | Middle East | Saudi Arabia | |
| United Arab Emirates | |||
| Turkey | |||
| Rest of Middle East | |||
| Africa | South Africa | ||
| Egypt | |||
| Nigeria | |||
| Rest of Africa | |||


Key Questions Answered in the Report
What is the projected size of the data center water consumption market by 2031?
It is expected to reach 5.2 trillion liters, up from 2.97 trillion liters in 2026.
Which cooling technology is expanding most rapidly?
Liquid immersion and direct-to-chip racks are growing at a 12.92% CAGR through 2031.
Why are reclaimed water sources important for data centers?
They reduce reliance on potable supplies and already grow 13.68% annually as utilities incentivize wastewater reuse.
How does Europe regulate water usage in data centers?
EU directives mandate annual disclosure of water usage effectiveness, and cities like Amsterdam grant permits only to water-neutral projects.
What metric do investors track when evaluating data-center water risk?
Water usage effectiveness (liters per kWh) now appears in sustainability-linked loans, with Amazon reporting 0.19 L/kWh.
Which region will add the most new water demand?
Asia-Pacific leads, with Chinese facilities forecast to triple water draw to 3.05 billion m³ by 2031.
Page last updated on:


