Care Management Solutions Market Size and Share
Market Overview
| Study Period | 2020 - 2031 |
|---|---|
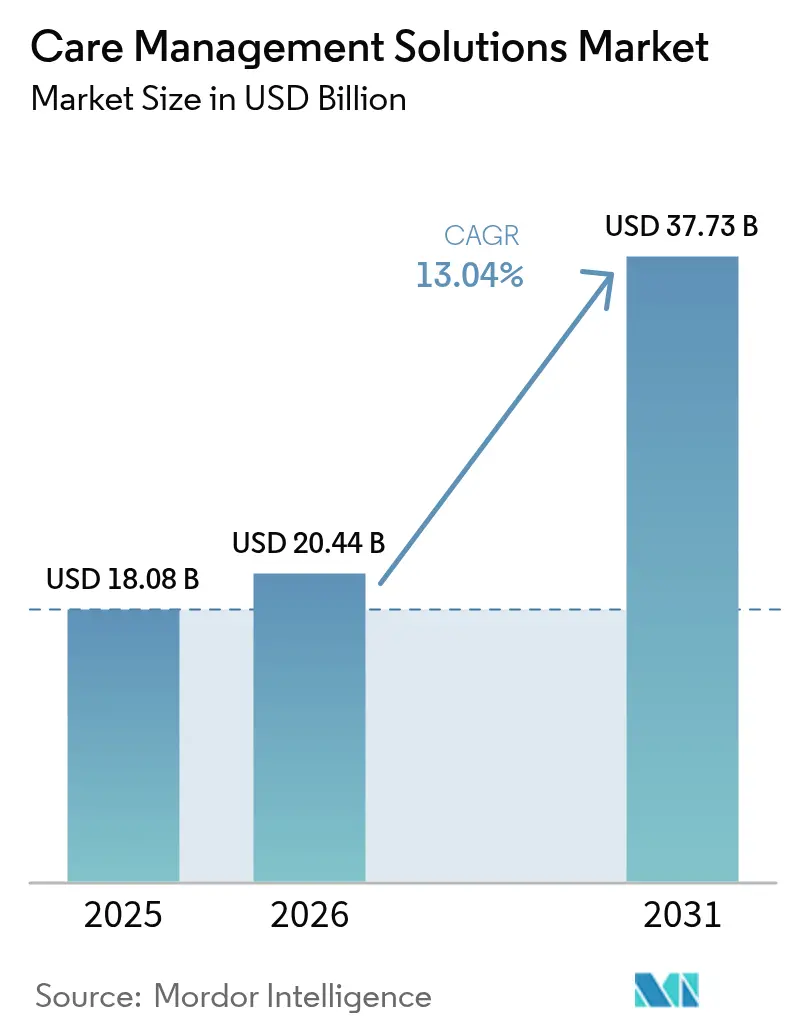
| Market Size (2026) | USD 20.44 Billion |
| Market Size (2031) | USD 37.73 Billion |
| Growth Rate (2026 - 2031) | 13.04% CAGR |
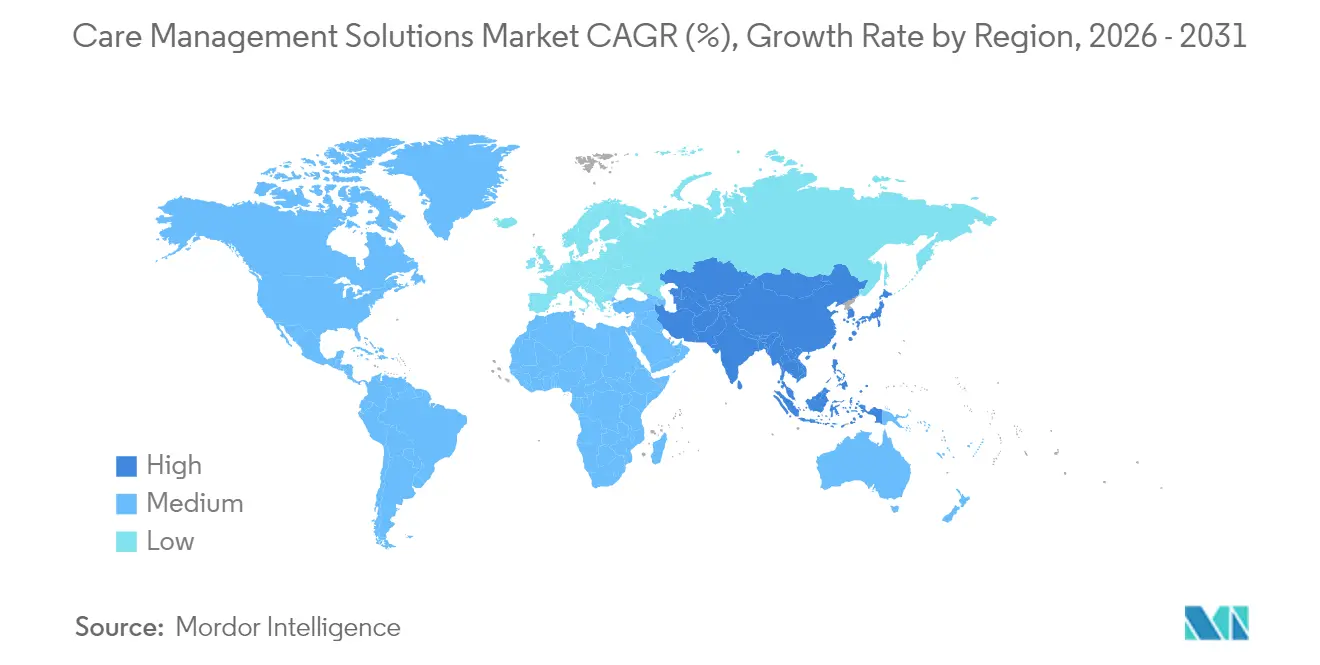
| Fastest Growing Market | Asia Pacific |
| Largest Market | North America |
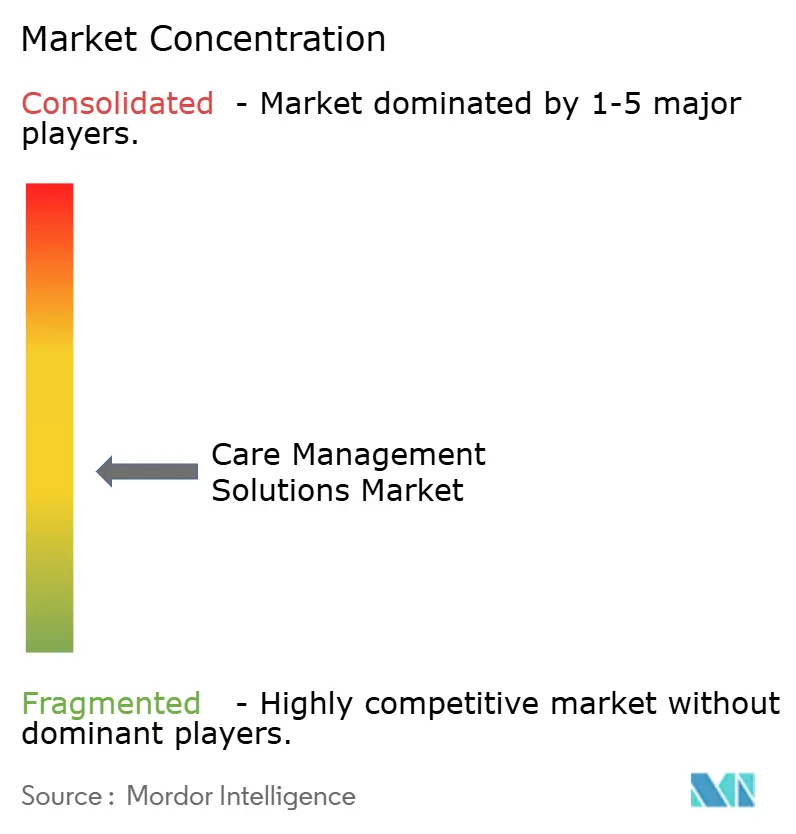
| Market Concentration | Medium |
Major Players *Disclaimer: Major Players sorted in no particular order Image © Mordor Intelligence. Reuse requires attribution under CC BY 4.0. | |
Care Management Solutions Market Analysis by Mordor Intelligence
Care management solutions market size in 2026 is estimated at USD 20.44 billion, growing from 2025 value of USD 18.08 billion with 2031 projections showing USD 37.73 billion, growing at 13.04% CAGR over 2026-2031. This growth is rooted in the global shift to value-based reimbursement, mounting cost-containment pressure, and new rules that forbid AI from making coverage decisions without human review. Cloud-first deployments, social-determinants analytics, and predictive risk-stratification engines are rapidly moving from optional upgrades to baseline requirements, while cybersecurity incidents have heightened executive focus on data-protection features. Although algorithm-bias laws raise compliance costs, they reward vendors that can prove transparency and fairness, giving innovation-oriented platforms a clear commercial edge.
Key Report Takeaways
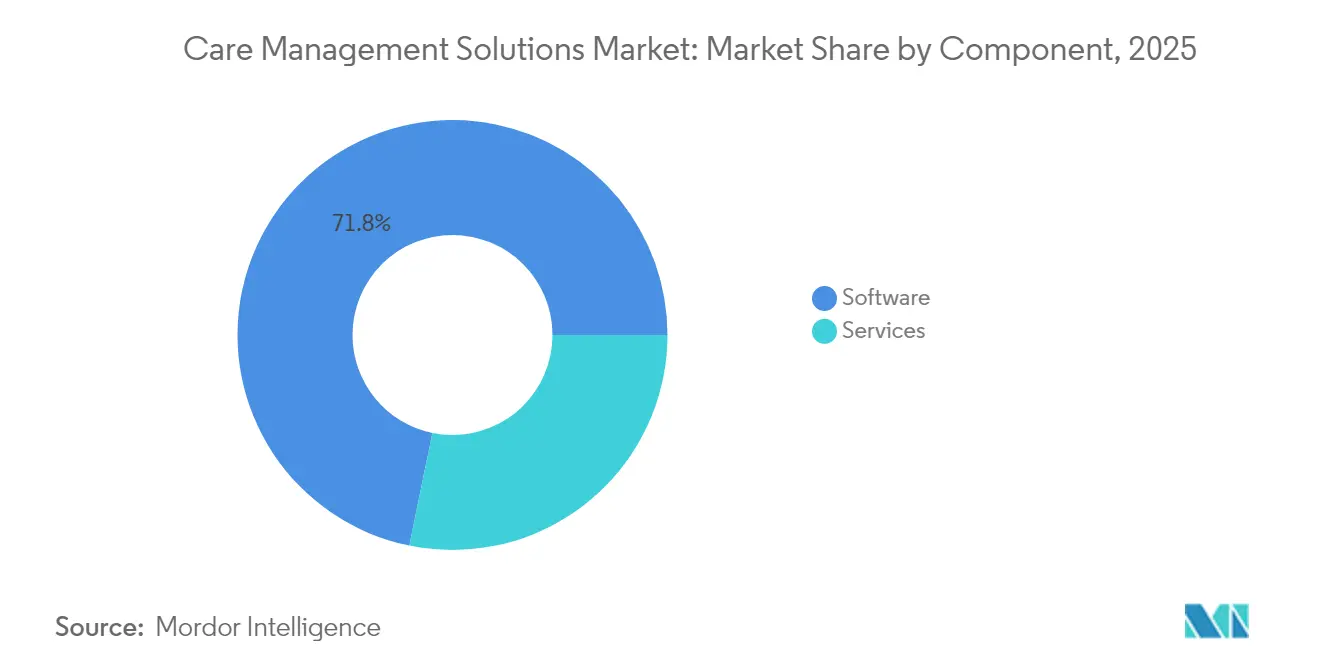
- By component, software held 71.78% revenue share in 2025, while services are projected to expand at a 16.09% CAGR through 2031.
- By delivery mode, cloud-based platforms commanded 67.10% of the care management solutions market share in 2025 and are forecast to grow at 14.96% CAGR.
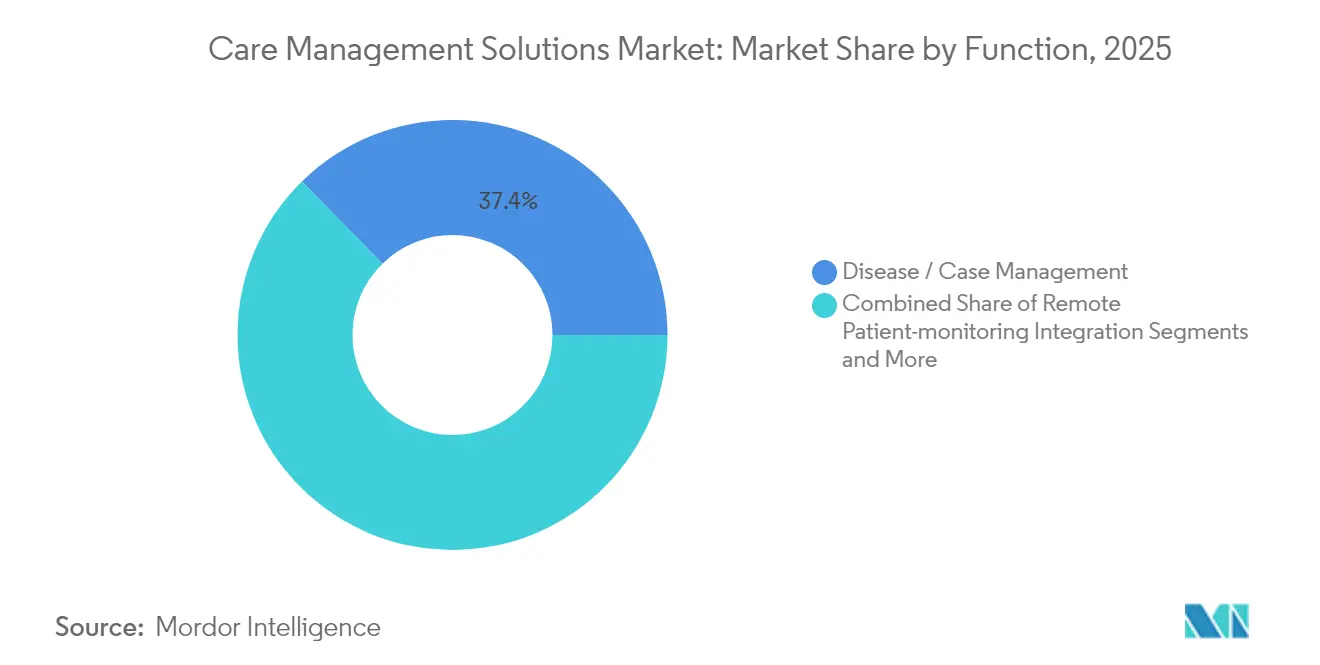
- By function, disease and case management contributed 37.35% share in 2025, whereas social-determinants analytics is set to climb at a 16.32% CAGR.
- By end user, payers led with 53.82% share in 2025, while providers will post the fastest 13.98% CAGR to 2031.
- By geography, North America dominated with 45.05% share in 2025; Asia-Pacific is on track for a 13.78% CAGR, the fastest worldwide.
Note: Market size and forecast figures in this report are generated using Mordor Intelligence’s proprietary estimation framework, updated with the latest available data and insights as of 2026.
Global Care Management Solutions Market Trends and Insights
Drivers Impact Analysis*
| Driver | (~) % Impact on CAGR Forecast | Geographic Relevance | Impact Timeline |
|---|---|---|---|
| Rising geriatric population & chronic-disease burden | +2.8% | Global, concentrated in North America & Europe | Long term (≥ 4 years) |
| Global shift to value-based reimbursement models | +3.2% | North America & EU leading, APAC emerging | Medium term (2-4 years) |
| Cost-containment pressure on payers & providers | +2.1% | Global, acute in North America | Short term (≤ 2 years) |
| AI-driven predictive risk-stratification adoption | +1.9% | North America & EU core, spill-over to APAC | Medium term (2-4 years) |
| Integration of social-determinants-of-health data sets | +1.4% | North America leading, EU following | Long term (≥ 4 years) |
| Government incentives & funding for health-IT modernization | +1.8% | Global, US federal programs leading | Short term (≤ 2 years) |
| Source: Mordor Intelligence | |||
Rising Geriatric Population & Chronic-Disease Burden
The graying of the population is swelling demand for coordinated chronic-care programs that stretch across primary, acute, and post-acute settings. Chronic conditions already account for 90% of healthcare spending in the United States. Health systems are deploying AI tools that flag at-risk seniors days before hospitalization, as seen at West Tennessee Healthcare, which saved USD 5 million by optimizing discharge plans. Remote-patient-monitoring platforms layered onto care-management suites now detect early deterioration and adjust treatment in real time. Post-acute providers use embedded analytics to automate documentation and reduce readmissions.
Global Shift to Value-Based Reimbursement Models
CMS aims to move every Medicare member into a value-based arrangement by 2030, a target that accelerates investment in population-health analytics capable of tracking quality metrics and managing downside risk. Specialty disease programs built on capitated payments allow narrower risk pools and deeper coordination. Oregon’s Primary Care VBP model adds equity-focused quality measures that reward providers for closing care gaps linked to social determinants.[1]Oregon Health Authority Staff, “Primary Care Value-Based Payment Model,” Oregon Health Authority, oregon.gov Analytics that reconcile clinical and claims data are therefore transitioning from nice-to-have dashboards to core contracting tools, as AlohaCare demonstrated by reclaiming 12,500 staff hours and raising referral completion rates.
Cost-Containment Pressure on Payers & Providers
Medical inflation is projected to run 7-8% in 2025, double historical norms, prompting rapid uptake of automation that trims administrative overhead tmgworkcomp.com. Optum’s Integrity One boosted coding productivity by 20% during pilots, underscoring returns that AI can deliver in revenue-cycle functions. Escalating bills for GLP-1 drugs and gene therapies amplify urgency for utilization-management analytics that steer costly therapies to the highest-value patients. Provider groups also lean on real-time documentation capture to free clinicians from clerical work while improving note accuracy.
AI-Driven Predictive Risk-Stratification Adoption
Two-thirds of US health systems now run predictive models to guide resource allocation. Arcadia’s Care Manager funnels algorithm-generated task lists to nurses so they focus on patients with the greatest likelihood of adverse events. Federal rules under HTI-1 compel vendors to document risk-management practices and make model information available to users, spurring more rigorous governance frameworks. Yet only 61% of hospitals validate model accuracy and 44% audit for bias, signaling room for services that help providers operationalize responsible-AI policies.
Restraints Impact Analysis*
| Restraint | (~) % Impact on CAGR Forecast | Geographic Relevance | Impact Timeline |
|---|---|---|---|
| High up-front integration & change-management costs | -1.8% | Global, acute in smaller systems | Short term (≤ 2 years) |
| Cyber-security & privacy-breach concerns | -2.1% | Global, heightened in North America | Medium term (2-4 years) |
| Emerging algorithm-bias & health-equity regulations | -1.2% | North America & EU | Medium term (2-4 years) |
| Interoperability hurdles from fragmented EHR ecosystems | -1.6% | Global, severe in fragmented markets | Long term (≥ 4 years) |
| Source: Mordor Intelligence | |||
High Up-Front Integration & Change-Management Costs
Smaller hospitals face six-figure licensing fees and must also budget for workflow redesign, data migration, and multi-year staff training. Tight margins make it hard to fund specialized population-health roles needed to extract full value from new platforms. Phased rollouts and cloud subscriptions lighten infrastructure loads, yet total cost of ownership remains a gating factor for many mid-tier systems.
Cyber-Security & Privacy-Breach Concerns
The 2024 ransomware attack on Change Healthcare exposed more than 100 million records and cost UnitedHealth hundreds of millions of dollars, highlighting systemic vulnerabilities. Average breach costs in the sector now stand at USD 9.77 million, steering capital toward threat-detection tools instead of expansion projects continued attacks by groups like Rhysida fuel board-level scrutiny of any cloud deal.
*Our forecasts treat driver/restraint impacts as directional, not additive. The impact forecasts reflect baseline growth, mix effects, and variable interactions.
Segment Analysis
By Component: Services Drive Implementation Excellence
In 2025, software modules anchored the segment with 71.78% share, reflecting the central role of population-health analytics and care-coordination dashboards in enterprise strategies. The care management solutions market size for services reached USD 5.1 billion in 2025 and is projected to outpace software with a 16.09% CAGR as hospitals seek external expertise for implementation, optimization, and staff training. Consulting teams guide value-based-care transitions, configure predictive-model libraries, and certify compliance with emerging AI regulations. Managed services increasingly bundle clinical staffing, quality reporting, and community-partner coordination, turning recurring fees into sticky revenue streams.
Demand for business-process outsourcing is also climbing as payers offload prior-authorization queues and care-gap outreach to specialized vendors. Providers value post-deployment education that keeps staff current on new workflows, which boosts platform utilization rates and strengthens renewal cycles. The growing reliance on outside expertise positions service vendors to shape purchasing requirements and deepen client lock-in, reinforcing their strategic importance within the broader care management solutions market.


By Delivery Mode: Cloud Platforms Enable Scalable Innovation
Cloud and SaaS options captured 67.10% share in 2025 and will grow at a 14.96% CAGR, underscoring their unmatched scalability for remote-monitoring feeds, AI pipelines, and multi-site user bases. The care management solutions market size tied to on-premise licenses is shrinking as CIOs shift capital budgets toward subscription models that deliver continuous upgrades and lower infrastructure risk. Private-cloud hosting still appeals to organizations with strict data-sovereignty mandates, yet the speed of feature releases on multi-tenant SaaS is widening the innovation gap.
Cloud-native platforms embed AI services that small organizations could not otherwise afford, making advanced risk-stratification and natural-language processing broadly accessible. They also facilitate real-time data exchange under nationwide information-blocking rules, driving broader network effects. Vendors bundle high-availability SLAs and managed security layers that exceed what many provider IT teams can build internally, accelerating cloud adoption across the care management solutions market.
By Function: Social-Determinants Analytics Reshape Care Delivery
Disease and case-management modules remained the largest slice at 37.35% in 2025, fueled by chronic-care coordination mandates. However, social-determinants analytics and risk-stratification tools will post the fastest 16.32% CAGR, reflecting payers’ and providers’ intent to target non-clinical drivers of utilization. The segment accounts for 22.45% of the care management solutions market size today but is on pace to nearly double by 2031. Vendors that integrate housing, food, and transportation records inside patient timelines improve predictive accuracy and unlock new reimbursement streams anchored in health equity.
Utilization-management engines sustain steady growth as specialty drugs and gene therapies raise financial stakes. AI monitors prior-authorization volumes, flags high-cost claims for clinical review, and suggests alternative care paths. Transitional-care workflows also gain prominence as hospitals tie readmission avoidance targets to value-based contracts, creating downstream demand for post-discharge monitoring and caregiver engagement features inside the broader care management solutions market.
By End User: Providers Accelerate Care Coordination Adoption
Payers dominated with 53.82% share in 2025, driven by commercial insurers and government programs that fund multi-year population-health investments. Nonetheless, provider organizations will register the fastest 13.98% CAGR as hospitals, physician groups, and ACOs take on greater financial risk. Many providers now own or participate in health plans, blurring traditional boundaries and amplifying internal demand for integrated analytics. Provider demand is further amplified by the HOME-Health final rule that incentivizes aging-in-place services, creating reimbursement tailwinds for home-based care-management suites.
Self-insured employers emerge as influential buyers seeking lower total cost of care, while pharmaceutical firms leverage care-management data to run adherence programs and real-world-evidence studies. These shifts broaden the addressable care management solutions market, fostering competition among vendors to package modular offerings for an expanding universe of stakeholders.
Geography Analysis
North America led the care management solutions market with 45.05% share in 2025 owing to well-funded health-IT infrastructure and firm regulatory pushes toward interoperability. Federal allocations of USD 1.3 billion for Medicare cybersecurity incentives and USD 86 million for ONC interoperability grants underscore continued policy backing. Programs like Making Care Primary extend ten-year payment guarantees that ease small-practice adoption barriers. Canada follows with provincial digital-health roadmaps, while Mexico invests in national analytics hubs that connect social-service agencies to hospital networks.Europe holds a solid second position, with Germany, the United Kingdom, and France spearheading digitization agendas. The EU AI Act, effective in 2024, mandates transparency, risk catalogs, and post-market monitoring for clinical algorithms, steering procurement toward platforms that can document bias-mitigation steps. Nordic countries leverage unified national EHRs to pilot population-level prediction tools, whereas Southern Europe focuses on chronic-disease management for rapidly aging populations. Eastern European markets show slower uptake due to fragmented funding but represent future growth pockets.Asia-Pacific is the fastest-growing region at a 13.78% CAGR. China’s provincial payers now fund cloud-based disease-management pilots, and India’s Ayushman Bharat Digital Mission creates APIs that invite private-sector apps into public health schemes. Australia’s My Health Record expansion drives interoperability mandates that align well with cloud-native care-management offerings. Kaiser Permanente’s deployment of Innovaccer’s AI platform in Washington state illustrated how cross-regional best practices in predictive analytics can be replicated in APAC joint ventures. The Middle East and Africa remain nascent but show pockets of rapid uptake in Gulf Cooperation Council nations and South Africa, where national insurers fund coordinated-care pilots to alleviate specialist shortages.

Competitive Landscape
The care management solutions market is moderately fragmented. Optum, Epic Systems, and ZeOmega anchor the top tier by combining broad functionality with tight EHR links. ZeOmega secured Best in KLAS for the fourth consecutive year and was named a leader in the PEAK Matrix 2024, reinforcing the market value of user satisfaction and outcomes evidence. Epic embeds AI across more than 100 projects, integrating ambient documentation and risk prediction directly into physician workflows, which deepens customer lock-in. Optum blends analytics, claims, and pharmacy benefits to offer end-to-end population-health services.
Mid-tier players differentiate through niche analytics, behavioral-health integration, or social-determinants data aggregation. Start-ups leverage cloud-native microservices that slot into existing infrastructures, often partnering with incumbent EHR vendors for distribution. Consolidation intensified in 2024 when Elevance Health announced a USD 2.7 billion deal for CareBridge to bolster home-and-community-based service coordination. Partnerships around responsible-AI toolkits have multiplied as vendors race to meet HTI-1 transparency requirements.
Competitive focus has shifted toward proof of bias-mitigation, low-code interface builders, and pre-configured care-path libraries for specific chronic conditions. Vendors that streamline deployment for under-resourced community hospitals are gaining share, while those tied to heavy on-premise stacks are losing ground as the care management solutions market pivots to SaaS.
Care Management Solutions Industry Leaders
EPIC Corporation Inc.
Veradigm
Cognizant
Unitedhealth Group (Optum)
Allscripts
- *Disclaimer: Major Players sorted in no particular order

Recent Industry Developments
- June 2025: Quantum Health acquired Embold Health to deepen AI-powered navigation and personalized guidance capabilities.
- March 2025: Lucet purchased value-based group Emcara Health to enhance integrated care-delivery models.
- June 2025: CareLineLive secured majority investment from Accel-KKR to accelerate its cloud home-care platform across seven countries.
- March 2025: Wellvana bought CVS Health’s Medicare Shared-Savings business, expanding value-based-care support to 40 states.


Research Methodology Framework and Report Scope
Market Definitions and Key Coverage
Our study treats the care management solutions market as the sum of all purpose-built software platforms and related professional services that let payers, providers, and employer networks coordinate, monitor, and evaluate longitudinal patient care. The scope starts when a license or service contract is first booked and ends at recurring support or subscription renewal. According to Mordor Intelligence, tools dedicated only to simple scheduling, stand-alone patient portals, or basic remote-monitoring devices are not included.
Segmentation Overview
- By Component
- Software
- Care-management platform software
- Population-health analytics modules
- Services
- Consulting & implementation
- Post-deployment support & training
- Business-process outsourcing (BPO)
- Software
- By Delivery Mode
- Cloud-based / SaaS
- Web-based (private hosting)
- On-premise licensed
- By Function
- Chronic care management
- Disease / case management
- Utilization & cost management
- Social-determinants analytics & risk stratification
- Remote patient-monitoring integration
- Transitional care / care-coordination workflows
- By End User
- Healthcare Payers
- Commercial insurers
- Government payers (Medicare / Medicaid)
- Self-insured employers
- Healthcare Providers
- Hospitals & integrated delivery networks (IDNs)
- Physician groups & accountable care organizations (ACOs)
- Post-acute / home-health agencies
- Other Stakeholders
- Third-party administrators
- Pharma & life-science companies
- Public-health agencies
- Healthcare Payers
- By Geography
- North America
- United States
- Canada
- Mexico
- Europe
- Germany
- United Kingdom
- France
- Italy
- Spain
- Rest of Europe
- Asia-Pacific
- China
- Japan
- India
- Australia
- South Korea
- Rest of Asia-Pacific
- Middle East and Africa
- GCC
- South Africa
- Rest of Middle East and Africa
- South America
- Brazil
- Argentina
- Rest of South America
- North America
Detailed Research Methodology and Data Validation
Primary Research
Discussions with care-coordination directors at hospitals, commercial insurer CIOs, and regional ACO executives across North America, Europe, and Asia helped verify typical user counts, contract values, and cloud migration pace. Follow-up surveys with solution architects clarified integration costs and regional regulatory frictions.
Desk Research
Analysts began with public datasets from agencies such as CMS, OECD Health Statistics, WHO Global Health Expenditure Database, and Eurostat, then reviewed adoption surveys issued by America's Health Insurance Plans, HIMSS, and NHS Digital. Company 10-Ks and earnings calls added payment-model shifts, while peer-reviewed journals in JMIR and Health Affairs supplied evidence on software impact. D&B Hoovers and Dow Jones Factiva helped us benchmark vendor revenue by delivery mode. The sources cited above illustrate, not exhaust, the wider pool consulted.
Market-Sizing & Forecasting
A top-down model converts total health IT spend by setting into an addressable pool and applies region-specific penetration ratios for chronic-care, utilization, and disease-management modules; these ratios were refined through the interviews above. Supplier roll-ups of sampled average selling price multiplied by live client volumes provide a bottom-up checkpoint. Key variables fed into our multivariate regression include chronic disease prevalence, value-based reimbursement share, cloud IT budget share, care-gap closure targets, and per-member-per-month software pricing. Forecasts to 2030 rely on ARIMA smoothing and scenario testing to reflect regulatory or funding shocks. Data gaps in vendor earnings were bridged with median uptake metrics from Marklines-style deal trackers and cross-checked with channel partners.
Data Validation & Update Cycle
Outputs pass three-layer review: automated variance scans, peer analyst audit, and senior sign-off. Material deviations above two standard deviations trigger source re-verification. Reports refresh once a year, with interim updates when funding policy or landmark acquisitions shift baselines. Before release, one Mordor analyst re-runs the latest quarter's data.
Why Our Care Management Solutions Baseline Stands Up to Scrutiny
Published figures understandably diverge because publishers choose different starting years, component mixes, and pricing ladders.
Key gap drivers include whether services revenue is fully counted, if population-health analytics is bundled, and how aggressively SaaS discounts are projected. Some providers freeze exchange rates at contract signing, while Mordor uses rolling annual averages; others forecast uniformly from 2021, whereas we anchor on the first post-pandemic steady year.
Benchmark comparison
| Market Size | Anonymized source | Primary gap driver |
|---|---|---|
| USD 18.08 B (2025) | Mordor Intelligence | - |
| USD 14.67 B (2024) | Global Consultancy A | excludes implementation services and applies flat 10% SaaS discount |
| USD 12.60 B (2021) | Industry Journal B | older base year and omits cloud upgrades after 2023 |
In sum, Mordor's transparent scope choices, blended modeling, and annual refresh cadence give decision-makers a balanced, reproducible baseline that aligns with real spending signals rather than legacy estimates.


Key Questions Answered in the Report
What is the projected size of the care management solutions market by 2031?
The market is expected to reach USD 37.73 billion by 2031 at a 13.04% CAGR.
Why are cloud platforms growing so quickly in this space?
Cloud delivery supports scalable AI services, eases interoperability, and lowers upfront infrastructure costs, driving a 14.96% CAGR for cloud deployments.
Which functional area is expanding fastest?
Social-determinants analytics and risk-stratification tools will grow at a 16.32% CAGR as payers and providers target non-clinical drivers of health.
How are new regulations affecting AI-enabled care management?
Rules such as the EU AI Act and California’s bias law require transparency and human oversight, raising compliance costs but favoring vendors with robust governance.
Which region offers the highest growth potential through 2031?
Asia-Pacific is set to expand at 13.78% CAGR, propelled by large-scale digital-health investments in China, India, and Australia.
Page last updated on:


