
Caramel Ingredient Market Size and Share
Market Overview
| Study Period | 2021 - 2031 |
|---|---|
| Market Size (2026) | USD 3.72 Billion |
| Market Size (2031) | USD 5.28 Billion |
| Growth Rate (2026 - 2031) | 7.23 % |
| Fastest Growing Market | Asia Pacific |
| Largest Market | North America |
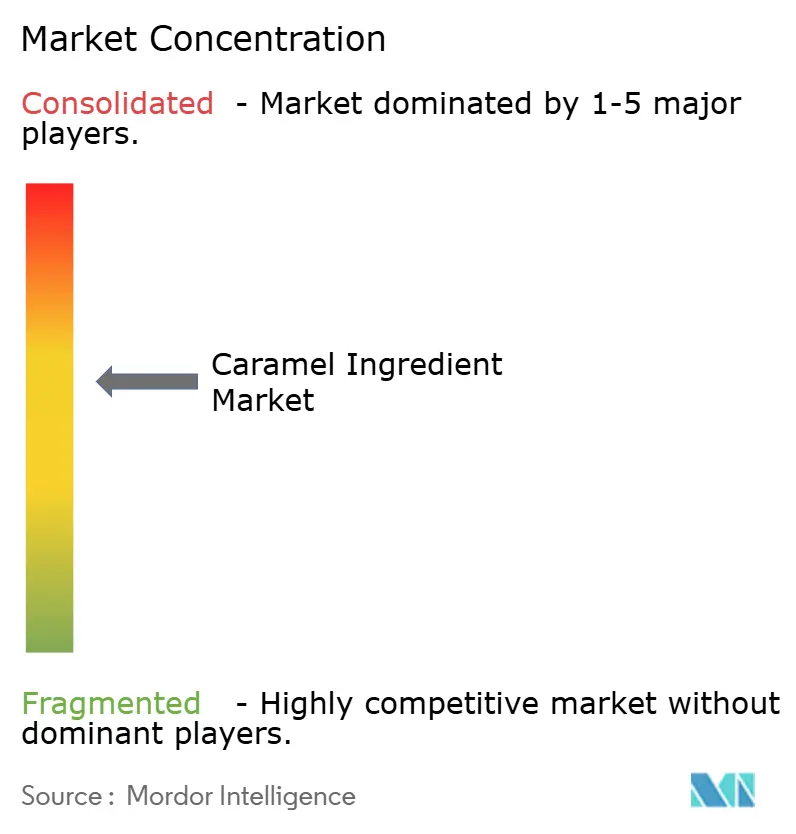
| Market Concentration | Medium |
Major Players
*Disclaimer: Major Players sorted in no particular order Image © Mordor Intelligence. Reuse requires attribution under CC BY 4.0. |
|
Caramel Ingredient Market Analysis by Mordor Intelligence
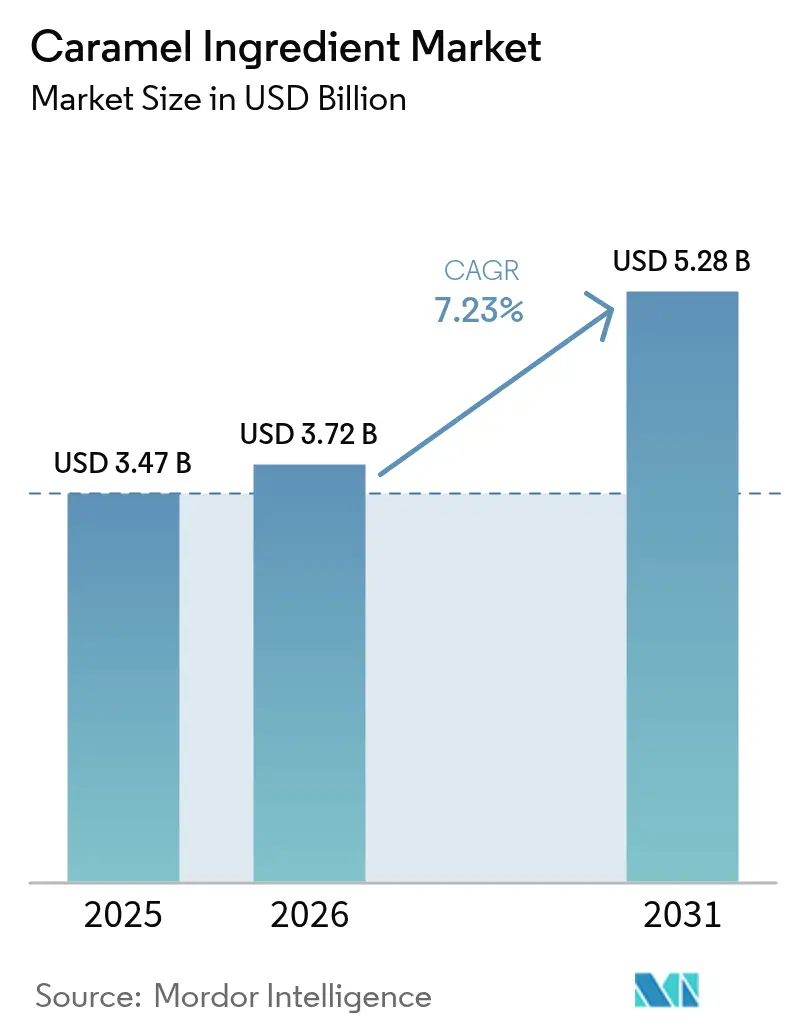
The caramel ingredients market size was valued at USD 3.47 billion in 2025 and estimated to grow from USD 3.72 billion in 2026 to reach USD 5.28 billion by 2031, at a CAGR of 7.23% during the forecast period (2026-2031). The market growth is driven by increasing demand for clean-label products, as consumers seek more natural and transparent ingredient lists in their food and beverage purchases. Regulations phasing out synthetic dyes across major markets, particularly in Europe and North America, have further accelerated the adoption of caramel ingredients as natural alternatives in food manufacturing. The consistent consumer preference for indulgent flavors in confectionery, beverages, bakery products, and dairy applications maintains steady demand throughout the year. Despite sugar price fluctuations in global markets due to weather conditions and supply chain disruptions, the industry continues to expand as manufacturers implement diverse sourcing strategies from multiple suppliers and regions, while focusing on natural offerings with higher margins. Natural caramel ingredients maintain premium pricing due to their clean-label appeal, superior quality, and growing application scope in various food segments, while FDA exemption from color-additive certification streamlines the approval process for manufacturers, reducing time-to-market for new products.[1]Source: U.S. Food and Drug Administration, “Regulatory Status of Color Additives,” fda.gov
Key Report Takeaways
- By source, natural products led with 67.40% of the caramel ingredients market share in 2025; the same segment is projected to expand at a 8.98% CAGR to 2031.
- By form, liquid/syrup formats held 61.30% revenue share in 2025, whereas powders are poised for 8.53% CAGR growth.
- By function, color applications accounted for 45.10% of the caramel ingredients market size in 2025; fillings and toppings are on track for an 8.78% CAGR through 2031.
- By application, confectionery remained dominant at 38.60% share in 2025, while beverages are forecast to grow fastest at 10.32% CAGR.
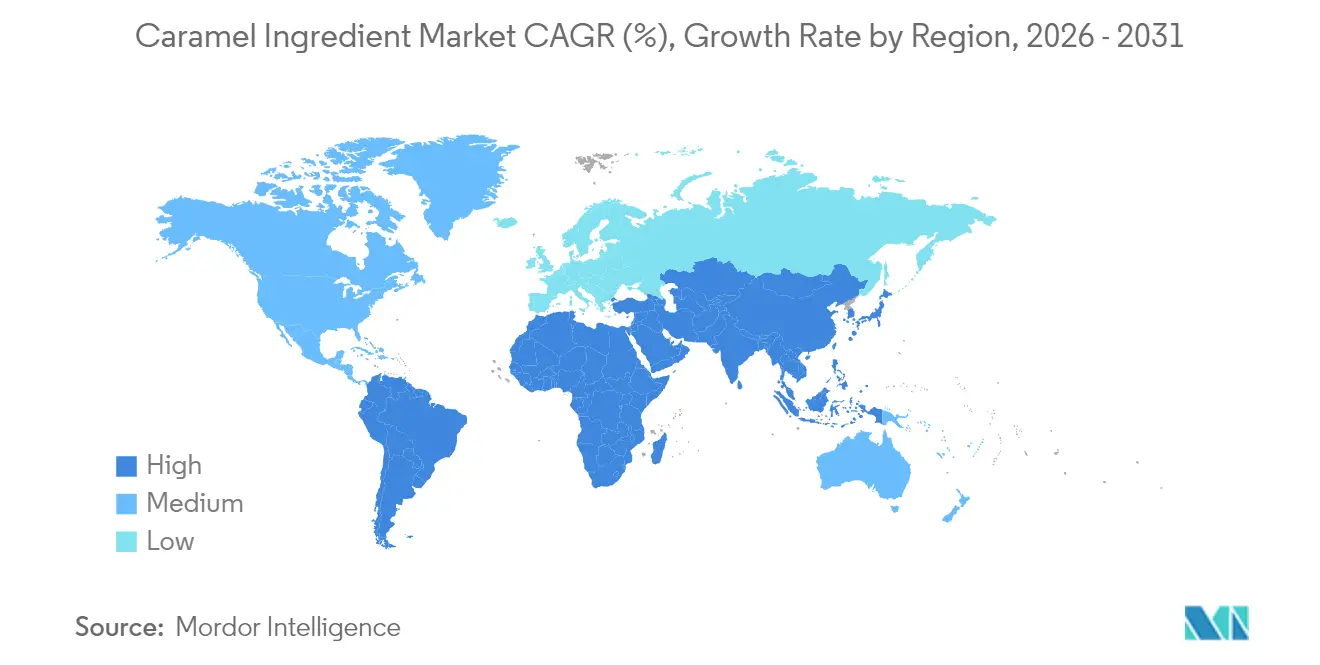
- By geography, North America led with 37.60% share in 2025; Asia-Pacific is expected to post the highest 8.76% CAGR through 2031.
Note: Market size and forecast figures in this report are generated using Mordor Intelligence’s proprietary estimation framework, updated with the latest available data and insights as of 2026.
Market Trends and Insights
Drivers Impact Analysis of Caramel Ingredient Market*
| Driver | (~) % Impact on CAGR Forecast | Geographic Relevance | Impact Timeline |
|---|---|---|---|
| Surging demand for confectionery products | +1.8% | Global, with concentration in North America and Europe | Medium term (2-4 years) |
| Rising popularity of caramel-flavored beverages | +1.5% | Asia-Pacific core, spill-over to North America | Short term (≤ 2 years) |
| Increasing demand from the bakery sector | +1.2% | Europe and North America, expanding to Asia-Pacific | Medium term (2-4 years) |
| Rising demand for natural food colorants | +1.4% | Global, led by North America and EU regulatory push | Long term (≥ 4 years) |
| Increasing adoption of caramel in savory applications | +0.9% | North America and Asia-Pacific, emerging in Europe | Long term (≥ 4 years) |
| Expanding applications in the dairy industry | +1.1% | Global, with early gains in North America and Europe | Medium term (2-4 years) |
| Source: Mordor Intelligence | |||
Surging Demand for Confectionery Products
As consumers increasingly gravitate towards premium indulgent products, the confectionery market is witnessing a surge in demand for caramel ingredients. This trend is especially pronounced in developed markets, where refined taste preferences play a pivotal role in shaping product development and manufacturing. The introduction of sophisticated flavor profiles and innovative product formulations underscores the market's evolution. A testament to this trend is Luker Chocolate's October 2023 debut of its Caramelo 33% chocolate couverture, underscoring the industry's embrace of premium caramel-based offerings and the ingredient's adaptability in upscale applications. With consumers showing a penchant for bold flavors and multi-sensory experiences, caramel has emerged as a pivotal ingredient, enhancing both texture and flavor depth in confectionery items. This evolution is mirrored in the rising demand for unique flavor pairings and varied textural experiences, spanning from traditional chocolates to contemporary fusion delights. Catering to these sophisticated consumer tastes and stringent sustainability standards, Cargill offers manufacturers a broad spectrum of confectionery ingredients, including specialized glucose syrups and tailored caramel formulations.
Rising Popularity of Caramel-flavored Beverages
As global markets tighten sugar regulations, the beverage industry turns to caramel flavoring, balancing compliance with consumer appeal. Kerry Group's Tastesense Advanced solutions empower beverage makers to retain caramel's signature taste, aligning with the Union of European Beverage Associations' ambitious 10% sugar reduction goal set for 2019-2025. This move underscores the industry's pivot towards health-conscious offerings[2]Source: Union of European Beverages Associations, "CHECK OUT OUR SECTOR'S SUGAR REDUCTION COMMITMENTS ACROSS EUROPE", unesda.eu. The demand for such innovations is evident: low and no-calorie beverages have surged in the European refreshing beverage market, highlighting shifting consumer tastes and regulatory influences. Caramel flavoring's reach now spans beyond classic soft drinks; energy drink producers are infusing caramel notes to temper bold caffeine flavors, appealing to health-savvy consumers who value natural ingredients and rich taste. This trend is underscored by Symrise's 5.9% organic growth in its Taste, Nutrition, and Health segment in Q1 2025, spotlighting the rising appetite for advanced flavor systems, especially those centered on caramel. In the Asia-Pacific, where traditional and Western flavor preferences meld, the embrace of caramel flavoring presents vast opportunities for ingredient suppliers, spurring innovation and market growth across the region's varied beverage scene.
Increasing Demand from the Bakery Sector
In the global baking industry, caramel ingredients serve dual roles as flavor enhancers and natural browning agents, playing a pivotal role in product innovation. Kerry's RA Maillose, a water-soluble browning agent sourced from dextrose, achieves a golden-brown hue via the Maillard reaction. This not only boosts the visual allure of baked goods but also elevates their taste. Meeting the industry's clean-label demands, this product ensures consistent color and flavor, all while upholding product quality and extending shelf life. This aligns with the rising consumer appetite for natural ingredients and a transparent food production process. As consumers gravitate towards artisanal and premium baked goods, the demand for caramel has surged. These ingredients empower manufacturers to craft the intricate flavor profiles reminiscent of traditional baking, be it in rich pastries, crusty bread, or specialty desserts. Caramel's versatility spans both sweet and savory realms, allowing its incorporation in bread, crackers, and niche items, thus helping brands carve a niche in the bustling retail landscape. This adaptability covers a spectrum of baking processes, temperature ranges, and formulation needs, cementing caramel's status as a cornerstone in contemporary bakery product development. Its resilience under varied processing conditions, coupled with the retention of functional properties, underscores its significance in large-scale baking operations, where consistency and quality are non-negotiable.
Rising Demand for Natural Food Colorants
The regulatory landscape for food colorants is undergoing significant changes, particularly regarding synthetic dyes. Natural caramel color emerges as a key alternative in this transition, offering manufacturers a proven and versatile coloring solution. The FDA's plan to phase out synthetic dyes from U.S. food products by the end of 2026 focuses on voluntary industry compliance rather than mandatory restrictions. This initiative, aligned with the "Make America Healthy Again" campaign, aims to reduce children's exposure to artificial colorings and potential associated health risks. Caramel color's exempt status from certification requirements provides it with distinct advantages in this context, allowing manufacturers to streamline their regulatory compliance processes. The International Food Information Council's research demonstrates that consumers increasingly avoid synthetic dyes due to health considerations, driving demand for natural alternatives. The FAO's Global Standard for Food Additives (GSFA) outlines specific requirements for various caramel types, including Caramel I (plain caramel) and Caramel IV (sulfite ammonia caramel), guiding manufacturers in their formulation choices across different food and beverage applications.[3]Source: FAO, “Food Additive Details,” fao.org China's new food additive standards GB 2760-2024, effective February 2025, align with the global shift toward natural colorants and include updated regulations that complement caramel's established safety record and widespread industry acceptance. Beyond regulatory requirements, manufacturers are adopting natural caramel colorants to enhance product quality, improve visual appeal, and meet clean-label demands while maintaining consumer trust.
Restraints Impact Analysis of Caramel Ingredient Market*
| Restraint | (~) % Impact on CAGR Forecast | Geographic Relevance | Impact Timeline |
|---|---|---|---|
| Fluctuating raw material prices | -1.2% | Global, With acute impact in North America and Europe | Short term (≤ 2 years) |
| Competition from Alternative Sweeteners and Flavors | -0.8% | North America and Europe, expanding to APAC | Medium term (2-4 years) |
| Health Concerns Over High Sugar Content | -0.6% | Global, led by developed markets | Long term (≥ 4 years) |
| Limited shelf life of caramel ingredients | -0.4% | Global, With higher impact in emerging markets | Medium term (2-4 years) |
| Source: Mordor Intelligence | |||
Fluctuating Raw Material Prices
Raw material price volatility poses a significant challenge to the caramel ingredient market, with sugar price increases in 2024 creating substantial margin pressure across the value chain. The USDA's October 2024 Sugar and Sweeteners Outlook reported reduced U.S. sugar supply for 2023/24, primarily due to adverse weather conditions. Drought and warm temperatures decreased beet sugar production to 5.17 million short tons raw value, affecting both domestic and international markets. These supply constraints have compelled manufacturers to adjust their pricing strategies and seek alternative sourcing options. The volatility affects not only sugar but also corn-based sweeteners and other essential ingredients, including dairy products and stabilizers used in caramel production. This market-wide instability requires manufacturers to implement sophisticated supply chain management practices, including long-term contracts, hedging strategies, and diversified supplier networks to maintain operational continuity. Additionally, manufacturers are investing in inventory management systems and exploring vertical integration opportunities to better control costs and ensure consistent supply availability.
Competition from Alternative Sweeteners and Flavors
Next-generation sweeteners present a significant competitive challenge to caramel ingredients, particularly in applications where sweetness is prioritized over flavor complexity. Rebaudioside M (Reb M), a steviol glycoside that demonstrates 200-350 times the sweetness potency of sucrose and maintains FDA GRAS status, provides manufacturers with a comprehensive solution to reduce sugar content while preserving consumer acceptance. The introduction of Kerry Group's Tastesense Sweetness Optimisation solutions, which enable substantial sugar reductions ranging from 30-100% while maintaining desired taste profiles, exemplifies the industry's strategic response to this evolving market pressure. The competitive landscape is especially pronounced in beverage applications, where alternative sweeteners deliver the required sweetness without caramel's inherent color contribution, compelling caramel suppliers to emphasize their ingredients' dual functionality in both sweetening and coloring capabilities. However, caramel ingredients maintain their distinct competitive advantage in applications demanding complex flavor development and natural browning characteristics, as synthetic alternatives consistently struggle to replicate the authentic taste profiles, depth of flavor, and visual appearance that consumers have come to expect from traditional preparation methods and processing techniques.
*Our forecasts treat driver/restraint impacts as directional, not additive. The impact forecasts reflect baseline growth, mix effects, and variable interactions.
Caramel Ingredient Market Segment Analysis
By Source:
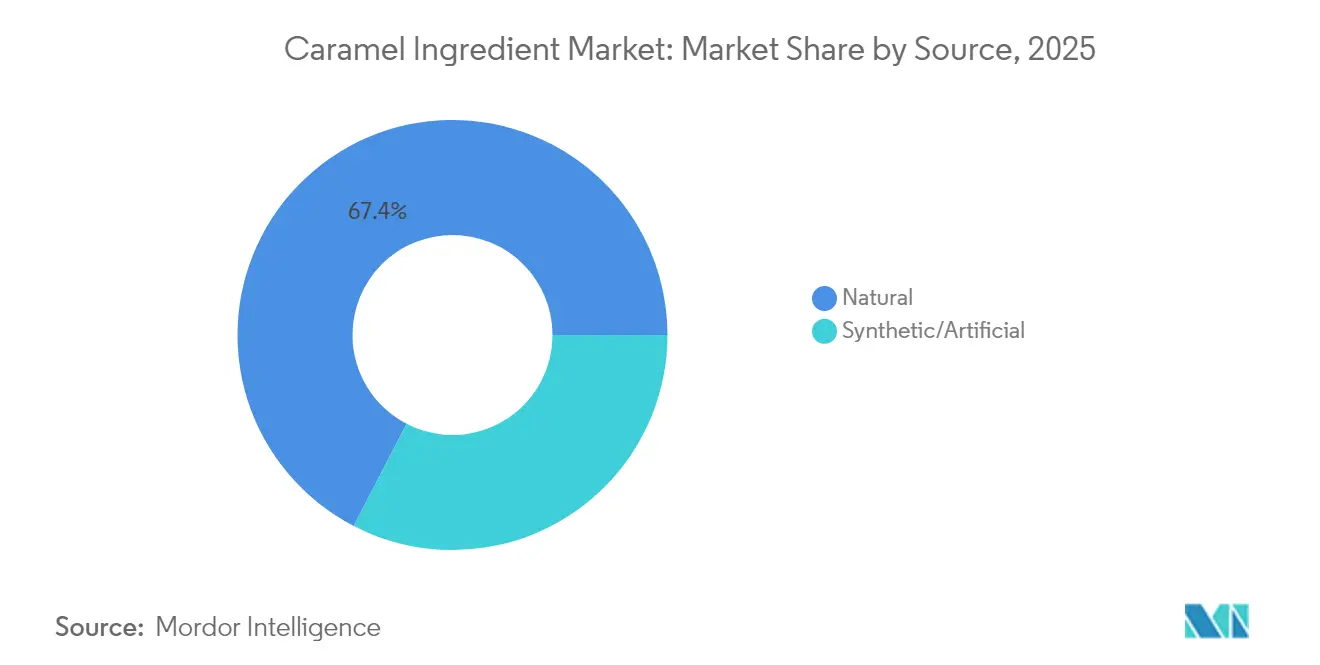
Natural Dominance Drives Premium PositioningNatural caramel ingredients held a 67.40% market share in 2025, as the industry shifted toward clean-label formulations to meet regulatory requirements and evolving consumer preferences. The natural segment is expected to grow at a 8.98% CAGR through 2031, significantly exceeding the growth rate of synthetic alternatives. This growth is primarily driven by increasing consumer demand for natural ingredients, heightened awareness of clean-label products, and stricter regulations across global markets. Synthetic and artificial caramel ingredients maintain their position in cost-sensitive applications, specific industrial processes, and manufacturing scenarios where natural alternatives are not economically viable or lack the required stability for product formulation. Advanced production methods have enhanced yield efficiency, optimized resource utilization, and reduced manufacturing costs, making natural caramel ingredients increasingly competitive with synthetic options in terms of both performance and pricing.
The market segmentation indicates a comprehensive industry-wide shift toward sustainability and transparency. Manufacturers are substantially increasing their investments in natural production capabilities and research and development to benefit from premium pricing opportunities and meet growing market demands. Natural caramel ingredients have a significant regulatory advantage as they are exempt from FDA color additive certification requirements, offering a more straightforward and cost-effective market entry pathway compared to synthetic alternatives that face increased regulatory oversight and compliance requirements.



By Form:
Liquid Formats Lead Despite Powder InnovationLiquid and syrup caramel ingredients hold 61.30% market share in 2025, maintaining their dominant position in beverage and confectionery applications due to easy incorporation and uniform flavor distribution. These formats excel in applications requiring precise control over color, flavor intensity, and texture profiles. Powder formats are experiencing the highest growth rate with an 8.53% projected CAGR through 2031. This growth stems from their benefits in dry mix applications, longer shelf life, and lower transportation costs. The powder segment shows significant expansion in bakery applications, where manufacturers require ingredients that integrate into existing production processes without major equipment changes. The format's stability in varying temperature conditions and resistance to moisture make it particularly suitable for industrial-scale production. Paste and granular formats occupy niche applications requiring specific texture or dissolution properties, such as premium confectionery and specialized dairy products.
Processing technology advancements enable manufacturers to develop caramel ingredients tailored to specific end-use applications. These innovations include improved encapsulation techniques, particle size control, and enhanced stability mechanisms. Cargill exemplifies this market adaptation through its product range of liquid and powder caramel solutions that serve various application segments. The company's portfolio includes specialized formulations for different temperature ranges, pH levels, and processing conditions. Liquid caramel maintains its market position through versatility in high-volume applications and established distribution networks, while powder formats gain market share in emerging regions where storage and distribution advantages offer competitive benefits. The market's evolution reflects increasing demand for application-specific solutions that optimize both production efficiency and final product quality.
By Function:
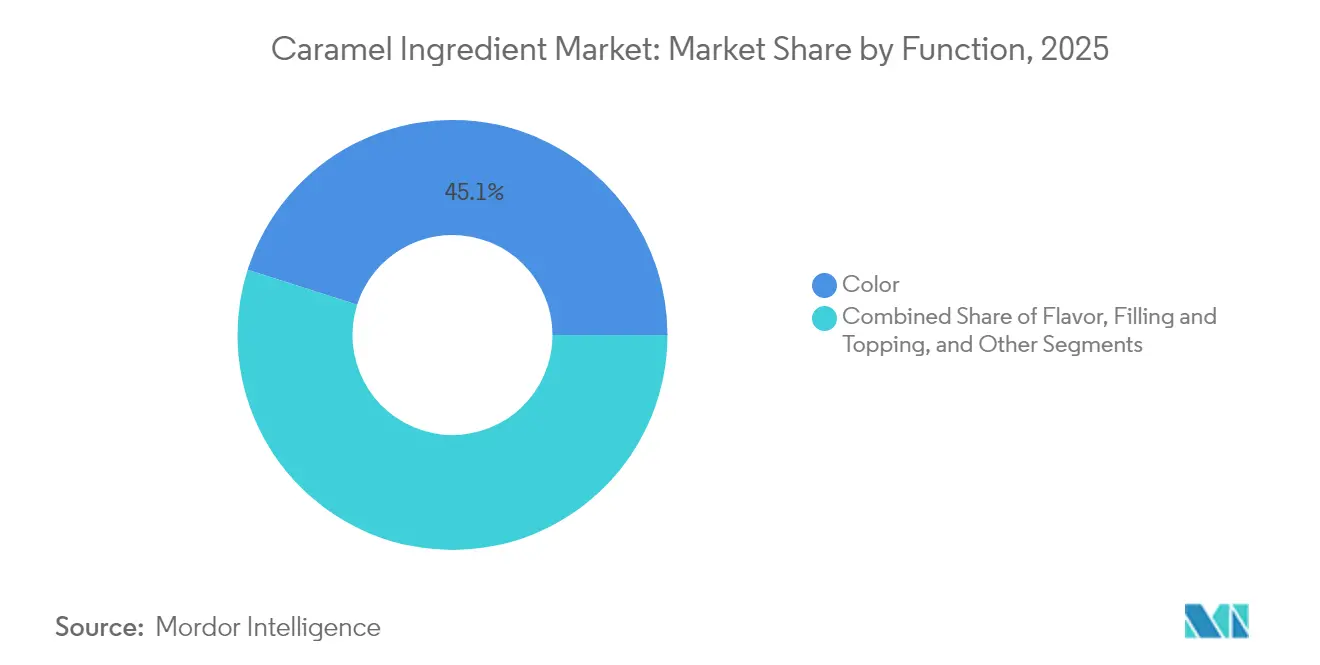
Color Applications Dominate Multi-Functional DemandCaramel ingredients used for coloring functions held a dominant market share of 45.10% in 2025, primarily due to their effectiveness as natural colorants amid increasing industry shifts away from synthetic dyes. These ingredients provide consistent, stable coloring across various food applications while meeting clean-label requirements. The filling and topping segment is experiencing the highest growth rate at 8.78% CAGR through 2031, supported by developments in confectionery and bakery products that enhance texture and visual elements. This growth encompasses applications in premium chocolates, artisanal desserts, and innovative bakery products.
Flavor applications maintain consistent demand across food categories, including beverages, dairy products, and processed foods, while other functional applications expand as manufacturers identify new uses for caramel's properties in areas such as binding, glazing, and moisture retention. This functional segmentation shows how caramel ingredients extend beyond sweetening, with manufacturers using them as multi-functional components to reduce the number of additives in their formulations. The growth in the filling and topping segment reflects increasing consumer interest in premium confectionery products, enabling manufacturers to develop visually attractive items that support higher pricing. This trend is particularly evident in premium chocolate bars, gourmet desserts, and specialty baked goods where caramel ingredients contribute to both aesthetic appeal and texture enhancement.
By Application:
Beverages Surge While Confectionery Maintains LeadershipThe beverages segment is experiencing rapid growth at 10.32% CAGR through 2031, while confectionery maintains its dominant position with the largest market share at 38.60% in 2025. This significant growth in beverages is primarily driven by the industry's strategic adoption of caramel flavoring as a solution to address stringent sugar reduction requirements while maintaining consumer satisfaction and taste preferences. Kerry Group has identified caramel as a key ingredient in their "Little Luxuries" trend forecast for 2025, emphasizing its crucial role in enhancing product appeal and indulgence without substantially increasing caloric content.
The bakery applications segment demonstrates consistent growth patterns, with caramel functioning as both a sophisticated flavor enhancer and natural browning agent in premium and artisanal baked goods. The dairy and frozen desserts segment maintains stable demand levels despite market maturity, while the snacks and cereals categories present expanding opportunities for manufacturers seeking product differentiation in increasingly competitive retail environments. Symrise's strategic collaboration with Shan Foods to establish a production facility in Pakistan demonstrates the industry's commitment to expanding production capacity for emerging markets, particularly in developing savory applications.
Geography Analysis
North America Caramel Ingredient Market
North America accounts for 37.60% of the caramel ingredients market in 2025, supported by advanced processing infrastructure and comprehensive FDA regulations that facilitate natural caramel approval. Regional manufacturers address cost challenges, including the USDA-reported 2023/24 sugar deficit of approximately 12%, through strategic price adjustments and operational efficiencies. Infrastructure investments demonstrate sustained market demand. The region's dominance is further reinforced by the presence of major manufacturers like Cargill, ADM, and Kerry Group, who maintain extensive R and D facilities and production networks.
APAC Caramel Ingredient Market
Asia-Pacific is projected to grow at 8.76% CAGR through 2031, driven by rapid economic growth and increasing consumer adoption of Western-style processed foods. Urbanization and higher disposable incomes, particularly in China and India, fuel the consumption of Western beverages and confectionery products. The market's innovation potential was highlighted at the 29th IFIA Exhibition in Tokyo, which hosted 377 exhibitors showcasing ingredient technologies and attracted over 45,000 industry professionals.
Europe Caramel Ingredient Market
Europe demonstrates consistent market growth. The Union of European Beverage Associations' sugar-reduction program benefits from caramel's ability to provide flavor complexity without additional calories. Germany, the United Kingdom, and France remain primary demand centers, backed by established confectionery manufacturing traditions dating back centuries. Southern European markets are expanding as artisanal bakery exports, incorporating caramel to improve product appearance and extend shelf life. The region's growth is supported by stringent quality standards and increasing consumer preference for natural ingredients.

Regulatory Landscape
Caramel color is regulated in the United States as a color additive exempt from certification under 21 CFR 73.85, permitted for use in foods generally in amounts consistent with good manufacturing practice. This simplifies color compliance compared with certified synthetic dyes and helps manufacturers cycle through reformulations for confectionery, bakery, dairy, and beverages.
Internationally, specifications and class definitions (Caramel I to IV) track Codex-linked frameworks such as FAO/JECFA, while the European Union continues structured surveillance of additive use through EFSA, including publication activity in April 2026 tied to EU monitoring of food additives and flavourings. In China, updated food additive requirements under GB 2760-2024 (effective February 2025) reinforce the importance of meeting identity and purity expectations for caramel colors and related caramelized ingredients when supplying multi-region product portfolios.
Value Chain Analysis
The value chain starts with procurement of carbohydrate feedstocks (sucrose, dextrose, glucose syrups, and other sugars), followed by caramelization through controlled thermal processing in batch or continuous systems. Depending on the class and target functionality, producers use permitted process aids such as acids, alkalis, sulfites, and ammonia compounds to develop specific color and flavor profiles, with in-process controls focused on reaction consistency and managing byproducts such as 4-methylimidazole (4-MEI).
Downstream, caramel ingredients are standardized, quality-tested, and converted into commercial formats (liquid/syrup, powder, paste/granular), then distributed through ingredient distributors and direct supply to industrial food and beverage manufacturers. Feedstock price volatility (notably sugar and corn derivatives), wastewater treatment needs from caramelization operations, and logistics constraints, especially for bulk liquid shipments, all affect cost and reliability. These factors increase the relative attractiveness of powder formats for longer shelf life and easier transport. Technical service and application support (for color matching, stability under pH/heat, and flavor optimization) function as a differentiator and an entry barrier for smaller suppliers targeting clean-label accounts.
Competitive Landscape
The caramel ingredients market demonstrates moderate consolidation, with competition intensifying through strategic acquisitions and capacity expansions. Tate and Lyle's USD 1.8 billion acquisition of CP Kelco in 2024 established a diversified specialty platform, enhancing sweetening and texturizing capabilities across food and beverage applications. The acquisition strengthens Tate and Lyle's position in the dairy, bakery, and confectionery segments while expanding its geographic footprint in emerging markets. Suppliers are developing multi-functional solutions, as evidenced by Kerry's RA Maillose development for enhanced flavor profiles and improved stability in high-temperature processing, and
Companies are investing significantly in capacity expansion to meet growing market demand. Investments in texture capabilities indicate strong market growth potential and customer requirements for advanced ingredient solutions. This investment includes new production lines for specialty starches and caramel colors, enabling faster response to regional market needs. Competition from alternative sweeteners has increased research and development efforts in caramel variants that offer reduced sugar content while maintaining Maillard flavor profiles and functional properties.
Growth opportunities exist in savory sauces and ready meals segments, where caramel ingredients provide superior color depth, flavor enhancement, and umami complexity that synthetic alternatives cannot match. The market shows particular potential in clean-label applications and natural ingredient formulations where caramel's versatility offers significant advantages. Manufacturers are also exploring new applications in plant-based products, premium beverages, and functional foods, where caramel ingredients contribute to both sensory appeal and technical functionality.
Caramel Ingredient Industry Leaders
-
Cargill, Incorporated
-
Sensient Technologies Corporation
-
Aarkay Food Products Ltd
-
Puratos Group
-
Roquette Freres
- *Disclaimer: Major Players sorted in no particular order
Caramel Ingredient Market Companies Covered in this Report
- Cargill, Incorporated
- Sensient Technologies Corporation
- Aarkay Food Products Ltd
- Puratos Group
- Roquette Freres
- Givaudan SA
- Bakels Worldwide
- Nigay SAS
- Martin Braun KG
- Alvin Caramel Colours (India) Pvt Ltd
- Barry Callebaut
- Ingredion Incorporated
- Sugar Foods Corporation (Concord Foods, LLC)
- Novasol Ingredients Pvt. Ltd
- Nactarome S.P.A (Royal Buisman)
- San Soon Seng Food Industries (S3)
- Metarom Group
- Oterra A/S
- Burke Candy & Ingredients
- H E Stringer Flavours Ltd

Market Opportunities and Future Outlook
As brands move away from petroleum-based dyes, there is room for caramel color as a clean-label alternative that delivers consistent brown hues across beverages, confectionery, bakery, and dairy. In the United States, caramel color benefits from its color-additive status exempt from certification (21 CFR 73.85), and February 2026 FDA communication around labeling for products without petroleum-based dyes supports on-pack claims that can accommodate naturally derived caramel color, helping brands simplify reformulation messaging while retaining color performance.
Demand is also shifting toward technical upgrading rather than only capacity. Customers are tightening specifications around process-related byproducts, particularly 4-MEI in Class III and IV colors, which increases the value of strong process control, analytical testing, and formulation support. Evidence of an active reformulation roadmap includes an updated FDA dietary exposure assessment for 4-MEI in caramel color published in January 2026 (Food Additives & Contaminants), reflecting continued industry focus on lowering 4-MEI through manufacturing changes. Separately, sugar reduction programs in beverages keep demand open for flavor systems where caramel notes and browning characteristics support perceived sweetness and indulgence, reinforcing innovation in reduced-sugar caramel flavors, reaction flavors, and multi-functional fillings and toppings used to maintain sensory appeal.
Recent Industry Developments in Caramel Ingredient Market
- March 2026: Sensient Technologies Corporation broke ground on Project Prism, a major expansion of its largest natural color plant in St. Louis, Missouri, tied to a USD 250 million investment to increase natural color manufacturing capacity. The move supports food and beverage reformulation programs shifting away from synthetic dyes and strengthens supply availability for clean-label color systems that compete with caramel color in some applications while expanding the broader natural color toolkit.
- March 2026: Cargill announced an expansion at its Port Klang, Malaysia facility with a new specialty fats production line aimed at food solutions for chocolate, confectionery, bakery, and dairy. While not a caramel-specific line, this capacity addition in adjacent ingredient systems supports the same end-use categories where caramel ingredients are formulated, strengthening integrated solution selling and regional supply-chain resilience for manufacturers.
- January 2025: Nigay invested EUR 30 million in a new production plant in Saint-Quentin, northern France, structured similarly to its existing sites in Feurs and Nesle to produce caramel for food industry and artisanal customers. The investment adds dedicated production infrastructure in a key European market and supports shorter lead times and service levels for industrial and specialty caramel applications.


Caramel Ingredient Market Report Scope and Research Methodology
Market Definition and Coverage
For this study, the caramel ingredient market includes caramel-based inputs used to add color, flavor, or texture to packaged food and beverage products. These inputs are typically supplied in liquid or powder form to manufacturers and foodservice users.
Scope exclusions: We exclude retail ready caramel candies and other finished confectionery products sold to consumers as end products.
Segments Covered in This Report
-
By Source
- Natural
- Synthetic/Artificial
-
By Form
- Liquid/Syrup
- Powder
- Others
-
By Function
- Color
- Flavor
- Filling and Topping
- Other
-
By Application
- Confectionery
- Bakery
- Beverages
- Dairy and Frozen Desserts
- Snacks and Cereals
- Other
-
By Geography
-
North America
- United States
- Canada
- Mexico
- Rest of North America
-
Europe
- Germany
- United Kingdom
- Italy
- France
- Spain
- Netherlands
- Rest of Europe
-
Asia-Pacific
- China
- India
- Japan
- Australia
- South Korea
- Rest of Asia-Pacific
-
South America
- Brazil
- Argentina
- Rest of South America
-
Middle East and Africa
- South Africa
- Saudi Arabia
- United Arab Emirates
- Rest of Middle East and Africa
-
North America
Data Sources, Market Sizing, and Validation
Desk Research
Desk research was used to set market boundaries and to anchor starting assumptions around food and beverage production trends that pull caramel colors and flavors through the value chain. We relied on public sources such as food additive regulations and guidance from bodies like the US FDA and the European Commission, trade and consumption series from sources such as FAOSTAT and UN Comtrade, and technical references from peer reviewed food science journals.
To turn that base into sizing inputs, we also reviewed company annual reports, investor presentations, product specification sheets, and reputable press coverage. This helped us understand how caramel ingredients are positioned by function and form. In a few cases, paid subscriptions for company financials and a patent database were used to cross-check revenue context and innovation activity. The sources listed here are illustrative only, and many other public documents and datasets were consulted to collect, validate, and clarify inputs.
Primary Interviews and Surveys
Primary work focused on validating purchasing patterns and pricing logic across application groups including bakery, beverages, confectionery, and dairy desserts. We spoke with ingredient suppliers, blenders, distributors, and end users across major regions so the model could be corrected for formulation shifts, clean label substitutions, and typical contract timing.
When desk inputs conflicted, follow up checks were done to confirm what is counted as caramel color versus caramel flavor, and whether filling and topping usage is recorded as an ingredient purchase versus a finished preparation. This clarified how suppliers categorize caramel inputs in their commercial offerings.
Distribution of primary research fieldwork respondents
| Company type | Respondent position | Region |
|---|---|---|
| Top tier: 39% | CXOs: 17% | APAC: 46% |
| Mid tier: 44% | Functional/Unit leaders: 32% | EMEA: 35% |
| Smaller Players: 17% | Managers: 51% | Americas: 19% |
Market-Sizing & Forecasting
Sizing starts with a top-down build where food and beverage output, category mix, and additive usage patterns are used to reconstruct the demand pool for caramel ingredients by region and application. From there, totals are checked with selective bottom-up approximations using sampled supplier revenues, channel checks, and an ASP x volume lens for common forms (liquid syrup and powder), and then the model is adjusted when the two views do not align.
Key inputs in the model include application-level production trends in bakery and beverages, the mix shift between natural and synthetic sources, the split between color and flavor functions, typical dosage and formulation substitution rates linked to clean label demand, and regional trade signals for sugar and caramelized intermediates. Where bottom-up inputs were missing for smaller markets, gaps were handled through proportional allocation using nearby country demand indicators and expert-confirmed penetration assumptions.
Forecasts were built using scenario analysis supported by trend consensus from primary discussions, since regulation, reformulation timing, and pricing pass-through can change outcomes quickly. A base case was created first, and then sensitivity ranges were tested for raw material price swings, application growth rates, and the speed of adoption for natural caramel options.
Data Validation & Update Cycle
Validation was done through several checks so the final number stays practical and traceable. Model outputs were compared against independent signals such as food additive demand direction, application growth rates, and observed pricing ranges, and large variances were flagged for rework.
Before sign-off, the market model is reviewed by another analyst who checks arithmetic logic, unit consistency, and whether assumptions match interview feedback. If a major mismatch shows up, respondents are re-contacted to confirm the specific driver, for example a function split change or a pricing reset. Reports are refreshed annually, with interim updates when material events occur, and a final pre-delivery review is completed so clients receive an up-to-date view.
Mordor Intelligence's Caramel Ingredient Market Size Compared With Other Published Estimates
Different published numbers for caramel ingredients can look confusing because each study sets its own scope and timing. The gaps usually come from what is counted as an ingredient versus a finished product, how filling and topping usage is treated, and whether the year is stated as an estimate, a base year, or a forward year.
Some sources bundle a wider set of caramel-based items, including broader flavor systems or adjacent sweet toppings, and they can apply faster ASP increases across all applications. In Mordor Intelligence sizing, the value is counted only when caramel is sold as an ingredient input by source and form, and the totals are checked against application demand signals so confectionery products are not mixed into the ingredient spend.
Benchmark comparison
| Source | Market Size | Gaps in Research Methodology |
|---|---|---|
| Mordor Intelligence | USD 3.72 B (2026) | |
| Global Consultancy A | USD 4.89 B (2026) | Uses a broader ingredient interpretation that can roll in additional caramel-based flavor and topping systems, and it starts from a different base year which lifts near-term totals through faster assumed price progression. |
| Trade Publisher B | USD 3.41 B (2024) | Reports an earlier year value and leans on shipment and ASP assumptions that may not fully adjust for regional application mix, which can understate the uplift from higher-value beverage and dairy uses in later years. |
Seen together, the spread mainly reflects scope choices and year timing, not just math. By keeping the counting rules tied to ingredient sales by function and form, and by rechecking the build with application demand indicators, the estimate stays easier to replicate and interpret for planning.


Key Questions Answered in the Report
What is the current size of the caramel ingredients market?
The caramel ingredients market stands at USD 3.72 billion in 2026 and is set to reach USD 5.28 billion by 2031.
Which source category is growing fastest?
Natural caramel ingredients are expanding at a 8.98% CAGR as brands pivot toward clean-label formulas.
Why is Asia-Pacific seen as the most attractive growth region?
Urbanization, rising incomes, are driving an 8.76% CAGR in Asia-Pacific.
How are raw material price swings affecting suppliers?
Sugar price volatility trimmed margins, but leading suppliers have offset the impact through hedging and strategic price adjustments.
Page last updated on:





