
Car Loan Market Size and Share
Market Overview
| Study Period | 2020 - 2031 |
|---|---|
| Market Size (2026) | USD 1.66 Trillion |
| Market Size (2031) | USD 2.49 Trillion |
| Growth Rate (2026 - 2031) | 8.47 % |
| Fastest Growing Market | Asia Pacific |
| Largest Market | Asia Pacific |
| Market Concentration | Medium |
Major Players *Disclaimer: Major Players sorted in no particular order Image © Mordor Intelligence. Reuse requires attribution under CC BY 4.0. | |
Car Loan Market Analysis by Mordor Intelligence
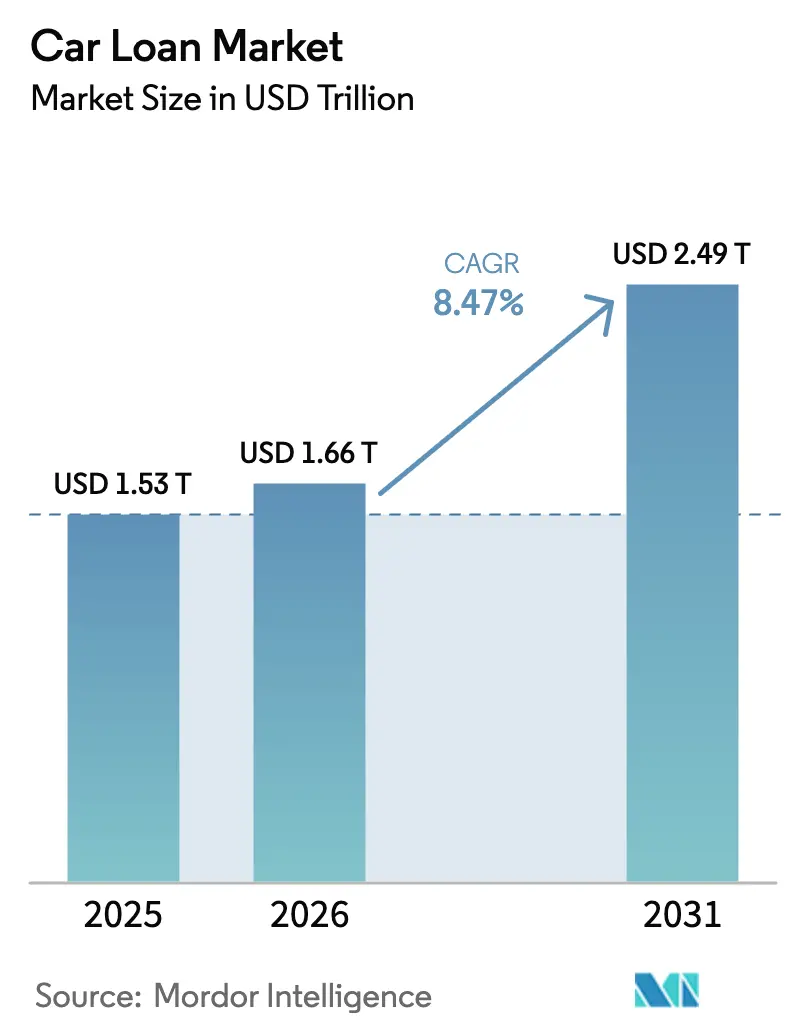
The Car Loan Market size is expected to increase from USD 1.53 trillion in 2025 to USD 1.66 trillion in 2026 and reach USD 2.49 trillion by 2031, growing at a CAGR of 8.47% over 2026-2031.
The growth follows rapid digitization of lending, regulatory easing in large emerging economies, and changing consumer preferences that favor convenient, technology-enabled financing. Asia-Pacific leads current demand and growth, propelled by the removal of mandatory down-payments in China and interest-rate caps in India that lower borrower costs. Digital lenders are expanding instant-approval products that shorten credit decision times from days to minutes, while captive finance arms are scaling to secure end-to-end customer relationships. Used-vehicle financing is rising quickly as online platforms make vehicle history and prices more transparent, and commercial-vehicle electrification is pushing innovative loan structures that account for high upfront costs and residual-value uncertainty.
Key Report Takeaways
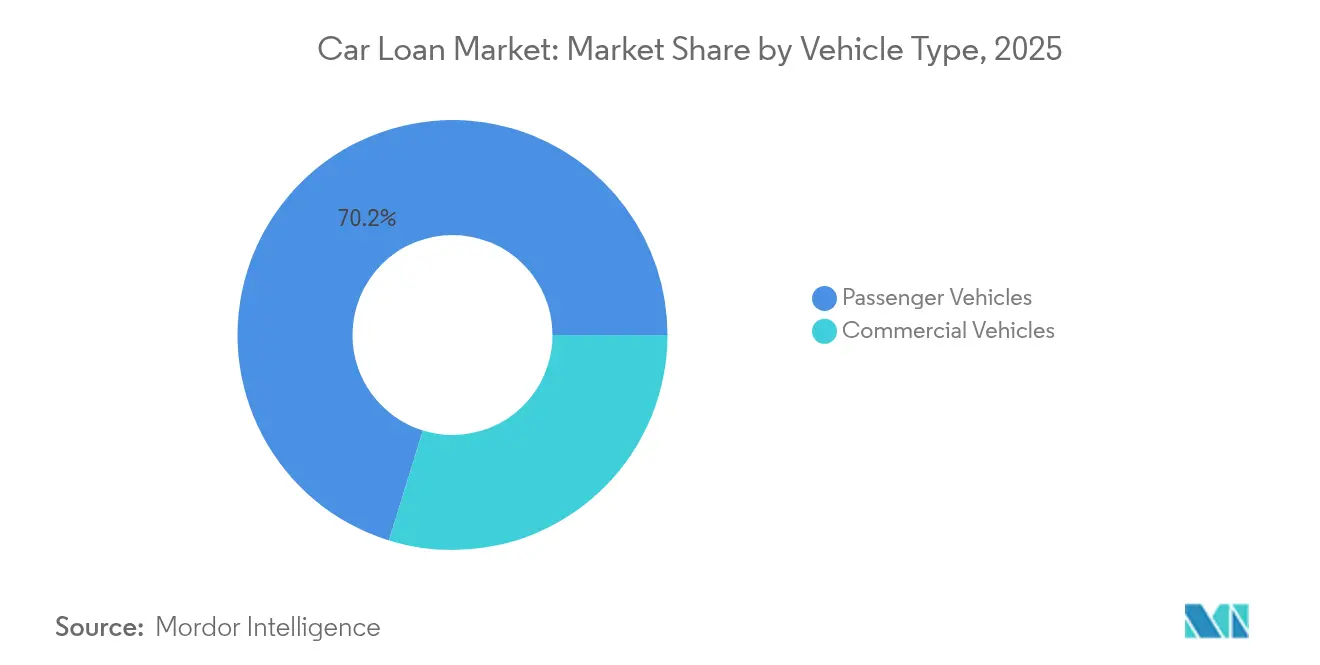
- By vehicle type, passenger vehicles led with 70.22% of the car loan market share in 2025, while commercial vehicles are projected to expand at a 9.05% CAGR to 2031.
- By ownership, new vehicles held a 60.37% share of the car loan market in 2025; used vehicles are expected to record the fastest growth at a 10.03% CAGR through 2031.
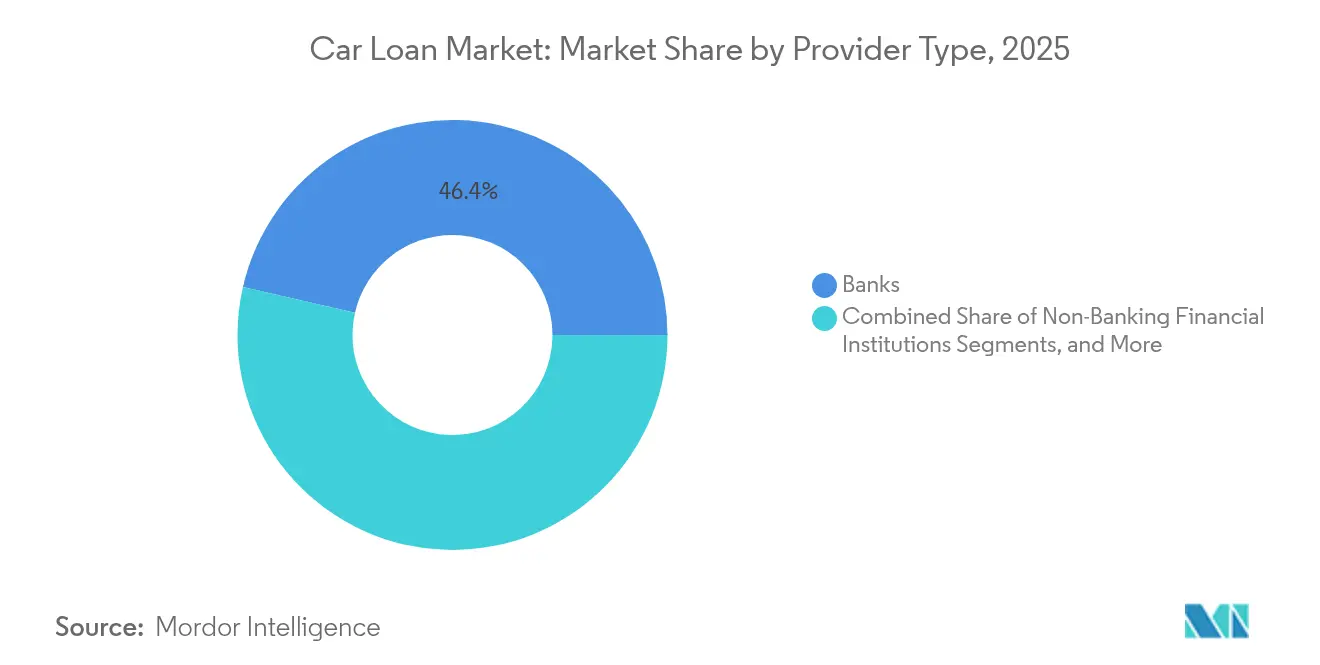
- By provider type, banks retained a 46.41% share of the car loan market in 2025, whereas fintech providers post the highest forecast CAGR at 14.12%.
- By tenure, 3–5-year loans captured a 51.99% share of the car loan market in 2025; loans exceeding five years are advancing at a 10.18% CAGR.
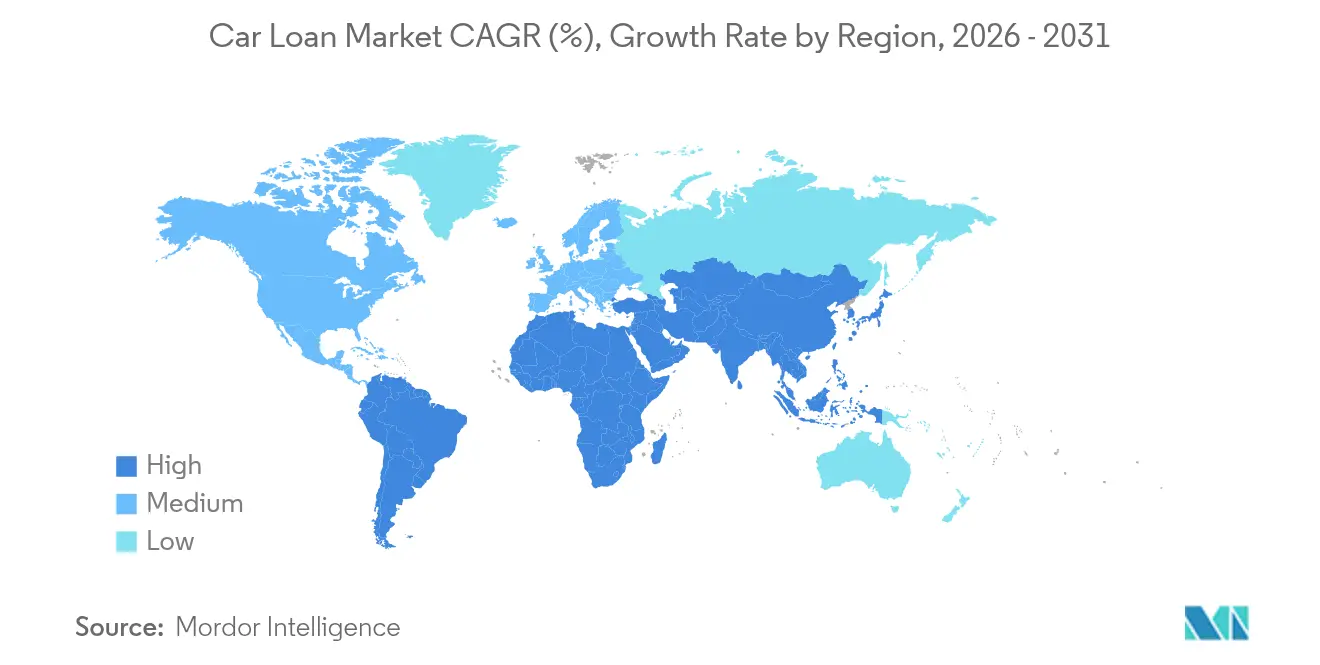
- By region, Asia-Pacific controlled 34.25% of the car loan market in 2025 share and is set to grow at a 9.74% CAGR, the fastest of all regions.
Note: Market size and forecast figures in this report are generated using Mordor Intelligence’s proprietary estimation framework, updated with the latest available data and insights as of 2026.
Market Trends and Insights
Drivers Impact Analysis of Car Loan Market*
| Driver | (~) % Impact on CAGR Forecast | Geographic Relevance | Impact Timeline |
|---|---|---|---|
| Rising demand for luxury vehicles in emerging markets | +1.3% | Asia-Pacific core, spill-over to Latin America | Medium term (2-4 years) |
| Expansion of automakers’ captive finance arms | +1.0% | Global, emphasis on North America & Europe | Long term (≥ 4 years) |
| Growing penetration of online used-car platforms | +1.5% | North America & Europe, expanding to APAC | Short term (≤ 2 years) |
| Digital lending & instant approvals via fintech APIs | +1.7% | Global, led by North America & China | Short term (≤ 2 years) |
| Subscription-based ownership models boosting bundled finance | +0.7% | Europe & North America, pilot programs in APAC | Medium term (2-4 years) |
| Carbon-credit-linked interest rebates for EV purchases | +0.5% | Europe & California, expanding to China | Long term (≥ 4 years) |
| Source: Mordor Intelligence | |||
Rising demand for luxury vehicles in emerging markets
Disposable-income growth in China and India is outpacing vehicle price inflation, pulling premium models into mainstream consideration. Beijing’s decision to drop the long-standing down-payment requirement on personal car loans has widened access to high-ticket cars[1]. Automakers are matching the policy pivot with aggressive captive-finance offers tailored to luxury buyers, often at preferential rates that reflect lower default risk. Banks react by designing underwriting models aligned to higher loan amounts and longer asset lifecycles. Lenders that embed early in this segment gain brand loyalty and cross-sell potential as buyers upgrade.
Expansion of automakers’ captive finance arms
Original-equipment manufacturers are scaling finance subsidiaries such as Ford Credit, which managed USD 133.2 billion in receivables in 2023 [2]. Control over residual-value data and maintenance insights lets captive lenders price loans more precisely than independent banks. Preferential bundles that combine insurance, software, and service contracts differentiate offers and lock in recurring revenue. Competitors are forced to focus on niche borrower bands or enhance speed and simplicity through technology alliances. This deeper integration also provides automakers with granular feedback loops that inform product design and marketing.
Growing penetration of online used-car platforms
Carvana reported USD 13.67 billion revenue in 2024 after integrating credit, vehicle selection, and delivery into a single user journey. Algorithm-driven pricing and instant credit decisions remove dealer mark-ups, attracting younger borrowers who value transparency. Lenders partner with marketplaces or risk losing prime digital traffic. The model also yields richer loan-performance data that refines risk scoring. Their scale economies in reconditioning and logistics lower per-unit costs, reinforcing the appeal of the online-first channel.
Digital lending & instant approvals via fintech APIs
Partnerships such as NXTsoft and Upstart connect banks and credit unions to AI-driven underwriting engines that cut manual reviews by more than 70%. Borrowers receive approval in minutes, and institutions reduce per-loan processing costs. Global adoption is accelerating, led by North America, where regulatory clarity favors open-banking interfaces. Providers lacking API capabilities cede volume to faster rivals. As more credit unions plug into open APIs, standardized data flows improve fraud detection and compliance reporting.
Restraints Impact Analysis of Car Loan Market*
| Restraint | (~) % Impact on CAGR Forecast | Geographic Relevance | Impact Timeline |
|---|---|---|---|
| Rising interest rates & tighter monetary policy | -2.1% | Global, emphasis on developed markets | Short term (≤ 2 years) |
| High delinquency risk among sub-prime borrowers | -1.3% | North America & Europe, emerging in APAC | Medium term (2-4 years) |
| Shared-mobility uptake reducing vehicle purchases | -0.8% | Urban centers globally, led by North America & Europe | Long term (≥ 4 years) |
| Stricter debt-to-income caps in key markets | -0.6% | Europe & Asia-Pacific, selective US markets | Medium term (2-4 years) |
| Source: Mordor Intelligence | |||
Rising interest rates & tighter monetary policy
Elevated policy rates have pushed average auto-loan coupons to multi-decade highs. In April 2025, the European Central Bank recorded a composite cost of 3.27% for new household loans, down only 5 basis points from the prior month[3]. North American consumers respond by lengthening loan terms to protect their monthly budgets. Lenders face margin squeeze as funding costs outrun yield gains, prompting revised pricing grids and stricter debt-to-income caps. Dealers are offering buydown incentives, but these measures only partly offset rising monthly obligations.
High delinquency risk among subprime borrowers
Default rates in the lowest credit tiers climbed through 2024, triggering tighter underwriting and higher loss provisions. European regulators advise banks to enhance IFRS 9 models to capture new geopolitical and climate-related risks. U.S. lenders deploy AI tools to segment risk more finely, but many scale back sub-prime exposure, creating credit-access gaps for vulnerable borrowers. Portfolio rebalancing supports long-term stability but temporarily limits loan origination volumes. Secondary-market investors demand higher spreads on asset-backed securities backed by subprime loans, raising funding costs for specialty lenders.
*Our forecasts treat driver/restraint impacts as directional, not additive. The impact forecasts reflect baseline growth, mix effects, and variable interactions.
Car Loan Market Segment Analysis
By Vehicle Type:
Commercial Vehicles Drive GrowthPassenger vehicles retained 70.22% of the 2025 car loan market share, benefiting from established dealer networks and broad consumer appetite. Commercial-vehicle financing posted a 9.05% CAGR outlook for 2026-2031, surpassing passenger-vehicle growth yet composing a smaller revenue base. Fleet electrification mandates and booming last-mile logistics expand demand for asset-backed loans that incorporate operational data.
Regulatory targets for carbon reduction push transport companies toward electric vans and trucks that carry higher sticker prices. Lenders design utilization-based repayment models and residual-value guarantees to mitigate technology risk. Passenger-vehicle lenders focus on digital origination and loyalty programs that package insurance, maintenance, and connectivity under single-invoice plans.

By Ownership:
Used Vehicles Accelerate Digital TransformationNew-vehicle loans held a 60.37% share in the global car loan market in 2025, while used-vehicle financing is projected to grow at a 10.03% CAGR, outpacing the growth of new-vehicle loans. Online marketplaces expand inventory transparency, while improved reconditioning standards boost buyer confidence. The car loan market size for used vehicles is poised to widen as platforms integrate credit and warranty products in-app.
New-vehicle financing relies on automaker incentives and captive finance arms, yet faces affordability tension from rising MSRP and interest rates. As credit conditions tighten, value-conscious consumers pivot to late-model cars, feeding used-vehicle momentum. Lenders diversify portfolios across both ownership segments to balance growth and risk.
By Provider Type:
Fintech Disruption AcceleratesBanks held a 46.41% share in the global car loan market in 2025, but fintech lenders are projected to expand at a 14.12% CAGR by scaling API-driven origination and automated risk models. The car loan industry sees alliances such as traditional banks embedding fintech tools to retain customers who expect instant decisions.
Non-bank finance companies evolve funding mixes after regulators in emerging markets liberalize wholesale borrowing. Captive lenders exploit proprietary telematics and maintenance data to sharpen pricing, while fintechs compete on user experience and speed. Competitive gaps narrow as incumbents digitize, but first-mover advantage favors agile platforms.
By Tenure:
Extended Terms Reflect Affordability PressuresLoans of 3-5 years comprised 51.99% of the 2025 car loan market share, yet contracts exceeding five years grow at 10.18% CAGR as consumers offset high rates and vehicle prices by stretching payments. The car loan market size for extended-term products is gaining prominence amid inflationary income stress.
Longer maturities increase cumulative interest and default exposure. Lenders introduce step-up payment schedules and periodic credit reviews to manage risk. Prime borrowers still prefer shorter durations to minimize cost, maintaining healthy demand in the under-3-year segment. Product variety enables institutions to match offers with household cash-flow profiles.
Geography Analysis
APAC Car Loan Market
Asia-Pacific led with 34.25% of the 2025 car loan market share and is forecasted to advance at a 9.74% CAGR through 2031. China’s removal of down-payments opened credit to new segments, while India’s ban on foreclosure charges for floating-rate loans enhances borrower flexibility. Rising middle-class car ownership, growing EV penetration, and wider fintech adoption underpin regional momentum.
North America Car Loan Market
North America remains a mature yet innovative arena. Deep credit bureaus enable granular risk-based pricing, and firms such as Ford Credit leverage scale to fund USD 133.2 billion in receivables. Electric-vehicle incentives and digital-first banks like Ally Financial broaden product choice and push competitive pricing.
Europe Car Loan Market
Europe navigates a complex policy mix of consumer protection and cross-border banking reforms. The European Central Bank promotes integrated capital markets, encouraging lenders to scale beyond domestic borders. Subscription models and carbon-credit-linked rate discounts spread quickly as regulators accelerate zero-emission goals. Interest-rate relief remains modest, but stable employment and sustainability policies sustain steady loan demand.
Mordor Intelligence provides coverage of the car loan market across other key regional markets, including Europe and Asia, each with their regulatory frameworks and demand patterns. Detailed country-level analysis extends to United Kingdom, China, France, Brazil, Russia, South Korea, India, and Japan incorporating local coverage and market participation, as required.
Regulatory Landscape
Regulation of car loans centers on consumer protection, fair-lending, credit reporting, and servicing and collections controls, with enforcement shared across multiple bodies and increasing state-level oversight. In the United States, lender and dealer-linked origination practices are shaped by ECOA and TILA for credit terms and disclosures, FCRA for credit reporting, FDCPA for collections activities, and SCRA protections for servicemembers. Scrutiny has broadened beyond federal agencies, with state attorneys general in jurisdictions such as New York, Massachusetts, Illinois, Colorado, and Maryland pursuing practices tied to underwriting, add-on products, and fee transparency.
The operating environment is also being influenced by new and evolving policy actions in 2026. The CFPB published its 2026 regulatory agenda (July 2026), including planned rulemaking activity that touches auto finance oversight, while the FTC conducted an early-2026 warning letter campaign directed at nearly 100 auto dealers focused on advertising and pricing compliance risks that can flow into financing. On the state side, California's CARS Act is scheduled to take effect in October 2026, tightening standards around fee disclosure, advertising, and financing terms, and New York's FAIR Business Practices Act expands tools to challenge unfair or deceptive practices, including junk fees. This raises compliance expectations for lenders, servicers, and dealer networks that feed the car loan market.
Value Chain Analysis
The car loan value chain runs from customer acquisition and origination (dealer, OEM captive channels, banks, fintech apps, and used-car marketplaces) through pre-qualification, underwriting, verification, funding, and closing, followed by servicing, collections, and asset disposition. Captive finance entities such as Toyota Financial Services and Ford Credit often integrate tightly with OEM and dealer ecosystems to support new-vehicle sales and bundled offerings, while banks and non-banks compete in indirect and digital channels, particularly in used-vehicle and higher-risk segments.
Technology layers are increasingly embedded end-to-end, including eKYC/KYB and fraud checks, API-based decisioning and pricing distribution, and digital documentation workflows (including electronic chattel paper and eVaulting where applicable), alongside automated titling and lien management processes. Funding and balance-sheet management sit behind origination scale, with securitization (auto ABS) and capital markets issuance remaining important channels for non-banks and captives, while banks rely more on deposits and wholesale funding. As open APIs synchronize data across dealers, OEMs, lenders, and service providers, cycle times and per-loan processing costs fall, but compliance, auditability, and data-governance requirements rise in parallel given the breadth of participants touching the loan lifecycle.
Competitive Landscape
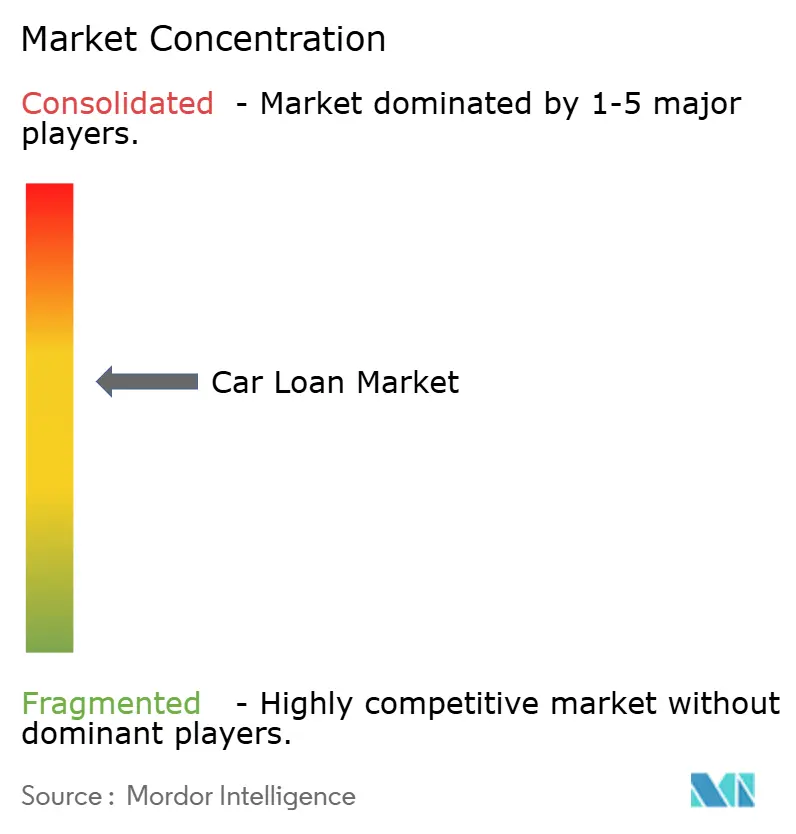
Market concentration is moderate as incumbent finance arms, banks, and fintech entrants contest share. Ford Credit’s substantial receivables base illustrates incumbent scale, though 2023 earnings before tax fell to USD 1,322 million amid higher funding costs. GM Financials’ withdrawal of a bank application highlights regulatory uncertainty shaping strategy.
Fintech platforms emphasize user-centric design and AI risk scoring; Upstart’s bank partnerships automate more than 70% of loan workflows. Captive lenders deepen loyalty with bundled services and data-driven pricing. Traditional banks respond by investing in APIs or acquiring technology firms to upgrade speed.
White-space opportunities include commercial-EV financing, subscription-ownership credit bundles, and cross-border loans enabled by regulatory harmonization. Competitive advantage now rests on blending scale, technology, and compliance. Providers that master cost-efficient digital origination while managing asset risk gain sustainable margins in the evolving car loan market.
Car Loan Industry Leaders
-
Toyota Financial Services
-
Ford Credit
-
Ally Financial
-
Chase Auto Finance
-
Wells Fargo Auto
- *Disclaimer: Major Players sorted in no particular order
Car Loan Market Companies Covered in this Report
- Toyota Financial Services
- Ford Credit
- Ally Financial
- Chase Auto Finance
- Wells Fargo Auto
- Bank of America
- Capital One Auto Finance
- Santander Consumer USA
- BMW Financial Services
- Honda Financial Services
- Hyundai Capital Services
- Nissan Motor Acceptance Corp.
- GM Financial
- Volkswagen Financial Services
- TD Auto Finance
- Société Générale – ALD Automotive
- HSBC Auto Loans
- Westlake Financial Services
- Lithia Driveway Finance
- Carvana Finance (Bridgecrest)
Market Opportunities and Future Outlook
Opportunities are opening in scaled digital distribution and indirect channels where major incumbents are already demonstrating strong origination momentum. In Q2 2026, Wells Fargo Auto reported 40.6% year-over-year growth in originations and Chase Auto reported an 8.9% year-over-year increase, while U.S. Bank posted a 61.2% year-over-year increase in indirect loan and lease originations, signaling active competition for dealer and platform-led volume. This aligns with the market shift toward API-enabled origination and instant approvals, where lenders can embed eligibility, pricing, and document workflows into dealer systems and online used-car journeys, improving conversion and reducing friction.
Another whitespace is financing that tracks how vehicles are used, not only owned, including subscription and service-based mobility models that bundle insurance and maintenance alongside credit. Toyota Motor Europe and Toyota Financial Services expansion of electrified-vehicle access programs for ride-hailing drivers (through a multi-country Uber partnership) shows how captives can attach financing and leasing to platform demand and higher-utilization use cases. At the same time, regulatory activity in 2026, including heightened state enforcement and new standards such as California's CARS Act effective October 2026, increases demand for compliant fee and term transparency, dealer oversight, and auditable decisioning. That creates room for lenders and fintech enablers that can operationalize compliant digital sales, servicing, and complaint-management at scale.
Recent Industry Developments in Car Loan Market
- July 2026: Toyota Motor Europe / Toyota Financial Services launched a partnership with Uber in ten European countries to provide flexible financing, leasing, and insurance solutions for ride-hailing drivers to access electrified vehicles. The launch expands automotive financing for the ride-hailing market in Europe. Deepens captive financing integration with mobility platforms to drive EV adoption and asset utilization.
- July 2026: Wells Fargo Auto reported a 40.6% year-over-year increase in second-quarter auto loan originations. The increase signals strong demand and capacity expansion for consumer auto lending in a volatile backdrop.
- July 2026: Chase Auto Finance reported an 8.9% year-over-year increase in second-quarter auto loan originations. The growth supports competitive dynamics and indicates active pricing and risk strategies in the market.
Car Loan Market Report Scope and Research Methodology
Market Definition and Coverage
This market covers the value of outstanding and newly originated car loans used to finance passenger and light commercial vehicles, across banks, captive lenders, credit unions, and non-bank finance firms, measured in USD on an annual basis.
Scope exclusions: Vehicle leasing, dealer floorplan financing, refinancing fees that are not part of loan value, and broader consumer lending products not tied to a vehicle purchase are excluded.
Segments Covered in This Report
- By Vehicle Type
- Passenger Vehicle
- Commercial Vehicle
- By Ownership
- New Vehicles
- Used Vehicles
- By Provider Type
- Banks
- Non-Banking Financial Institutions
- Original Equipment Manufacturers
- Other Provider Types (Fintech Companies)
- By Tenure
- Less than 3 Years
- 3-5 Years
- More than 5 years
- By Region
- North America
- United States
- Canada
- Mexico
- South America
- Brazil
- Argentina
- Chile
- Colombia
- Rest of South America
- Europe
- United Kingdom
- Germany
- France
- Spain
- Italy
- Benelux (Belgium, Netherlands, and Luxembourg)
- Nordics (Sweden, Norway, Denmark, Finland, and Iceland)
- Rest of Europe
- Asia-Pacific
- China
- India
- Japan
- South Korea
- Australia
- South-East Asia (Singapore, Indonesia, Malaysia, Thailand, Vietnam, and Philippines)
- Rest of Asia-Pacific
- Middle East and Africa
- United Arab Emirates
- Saudi Arabia
- South Africa
- Nigeria
- Rest of Middle East and Africa
- North America
Data Sources, Market Sizing, and Validation
Desk Research
Desk research was used to set the market boundary, build the starting demand pool, and create sanity checks before we spoke to industry participants. We referenced public economic and credit indicators that influence car loan demand and pricing, such as Federal Reserve data on interest rates, World Bank and IMF macro series, OECD indicators, and consumer credit publications from central banks and supervisors.
We also reviewed non-paywalled sources that help explain vehicle purchase behavior and credit risk movements, such as national statistics offices, transport and vehicle registration agencies, and filings and investor presentations from lenders with auto exposure. Where helpful, we used paid subscriptions for company financials and news coverage, along with a patent database to track underwriting and digital origination themes. These sources are illustrative, and many other public and paid references were used to collect data, validate assumptions, and clarify gaps.
Primary Interviews and Surveys
Primary work focused on validating the size logic and the forecast inputs that are hard to read from public data alone, such as how lenders adjust approval cutoffs, pricing spreads, and term length by credit tier. We covered a mix of lender types, distributors (including dealer-linked channels), and supporting ecosystem roles, and then used the feedback to reconcile scope gray areas and confirm the reasonableness of key assumptions across regions.
Distribution of primary research fieldwork respondents
| Company type | Respondent position | Region |
|---|---|---|
| Top tier: 30% | CXOs: 12% | APAC: 43% |
| Mid tier: 55% | Functional/Unit leaders: 42% | EMEA: 34% |
| Smaller Players: 15% | Managers: 46% | Americas: 23% |
Market-Sizing & Forecasting
The sizing starts with a top-down demand pool build, where vehicle sales and parc signals are reconstructed into financed units, which are then translated into loan value using observed loan-to-value behavior and average ticket sizes. To keep the totals realistic, we corroborate the result with selective bottom-up approximations such as sampled lender portfolio roll ups, channel checks on penetration by new and used vehicles, and ASP times volume cross-checks for major geographies.
Key model inputs include new and used vehicle sales volumes, average vehicle transaction prices, average loan amount per financed vehicle, typical loan tenors and their mix shifts, interest rate levels that move monthly payments, and delinquency trends that can tighten credit supply. Forecasting uses scenario analysis supported by expert views on rate paths, affordability, and underwriting tightness, and it is then translated into a base case by weighting scenarios that were most consistently supported in interviews. Where bottom-up data is patchy for smaller markets, gaps are handled through proxy penetration rates and ticket sizes anchored to similar countries, followed by a reasonableness check against macro and credit indicators.
Data Validation & Update Cycle
Outputs are checked in several passes so that large variances are spotted early and explained before sign-off. The model totals are compared against independent signals like consumer credit balances, financing penetration cues, and lender disclosure trends, and then any odd jumps are re-tested by adjusting a small set of drivers rather than rewriting the whole model.
If an assumption materially changes, respondents are re-contacted and the desk inputs are refreshed to confirm what moved and why. Reports are refreshed annually, with interim updates when major events impact rates, vehicle affordability, or credit availability, and a final pre-delivery review is completed to make sure the latest data is reflected.
Mordor Intelligence's Car Loan Market Sizing Compared With Other Published Estimates
Published estimates for car loan market size can vary widely because the underlying time cut used for exchange rates, the treatment of average loan amount progression, and the handling of refinancing and renewals are not always aligned. Differences also show up when one publisher counts only new originations while another leans on outstanding balances, which can inflate totals in periods of longer loan tenors.
In this study, the refresh cadence is tied to the latest available 2026 inputs, and the currency timing and ticket size logic are re-checked against rate-led payment shifts before finalizing the model, which is why the Mordor Intelligence number lands where it does versus sources that rely on older FX averages or a flat loan amount assumption.
Benchmark comparison
| Source | Market Size | Gaps in Research Methodology |
|---|---|---|
| Mordor Intelligence | USD 1.66 T (2026) | |
| Global Consultancy A | USD 1.38 T (2026) | Uses a more conservative average loan amount curve and applies older currency averages for multi-country rollups, which can understate value when vehicle prices and rates shift within the year. |
| Industry Association B | USD 1.92 T (2026) | Leans closer to outstanding balance style accounting and includes broader auto credit categories in some regions, which can lift totals versus an origination-aligned loan value view. |
The table shows that most of the spread can be traced back to what is being counted (originations versus balances), and how fast loan sizes and FX are updated. By keeping the inputs traceable to vehicle demand, financing penetration, and realistic ticket sizes, the final estimate stays repeatable and easier to audit across countries and years.
Key Questions Answered in the Report
What is the projected growth rate for the car loan market through 2031?
The market is forecast to grow at an 8.47% CAGR, advancing from USD 1.53 trillion in 2025 to USD 2.49 trillion by 2031.
Which region is expected to show the fastest expansion?
Asia-Pacific is projected to post a 9.74% CAGR, supported by regulatory easing and growing middle-class demand.
Why are fintech lenders gaining share in automotive financing?
Fintechs provide instant approvals using API-based underwriting, resulting in a 14.12% CAGR that outpaces traditional banks.
How are rising interest rates affecting car loan affordability?
Elevated rates lengthen loan terms and compress lender margins, with cost-of-borrowing indicators still above pre-2022 levels.
What factors drive growth in used-vehicle financing?
Online marketplaces enhance price transparency and speed of credit decision, pushing used-vehicle loan growth above 10% CAGR.
How are electric-vehicle trends influencing loan products?
Lenders introduce carbon-credit-linked rate discounts and longer terms to support higher-priced EV purchases while meeting sustainability goals.