United States Auto Loan Market Size and Share
Market Overview
| Study Period | 2020 - 2031 |
|---|---|
| Forecast Data Period | 2026 - 2031 |
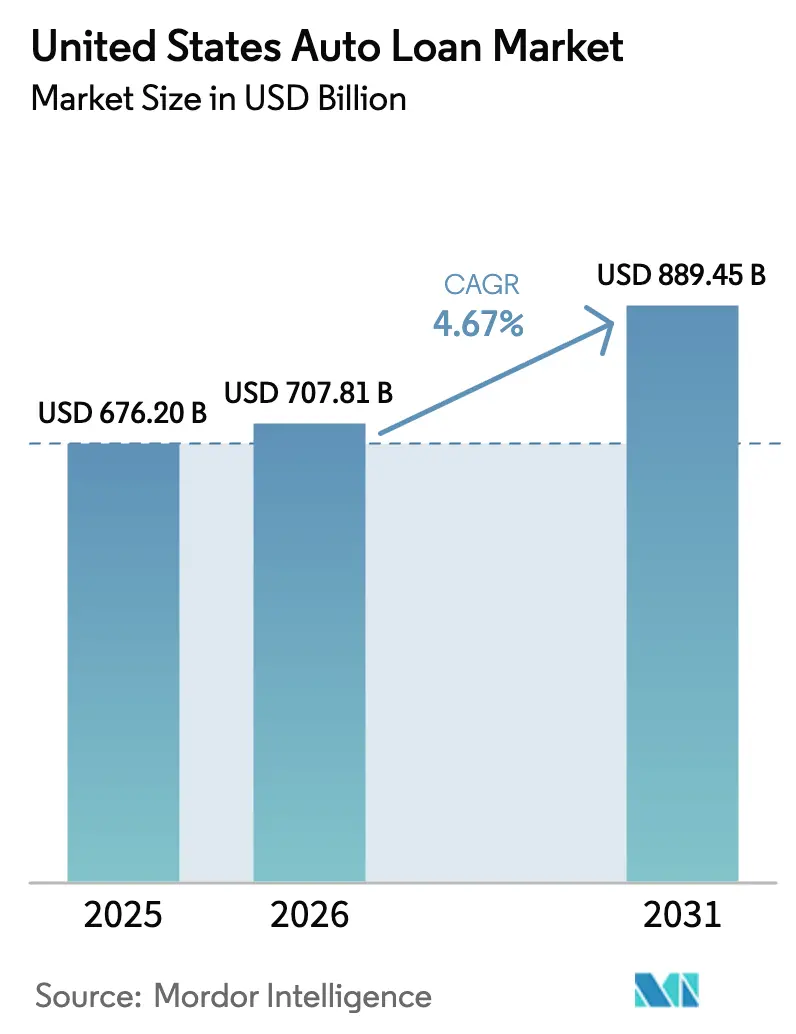
| Base Year Market Size (2025) | USD 676.20 Billion |
| Market Size (2026) | USD 707.81 Billion |
| Market Size (2031) | USD 889.45 Billion |
| Growth Rate (2026 - 2031) | 4.67% CAGR |
| Market Concentration | Medium |
Major Players *Disclaimer: Major Players sorted in no particular order Image © Mordor Intelligence. Reuse requires attribution under CC BY 4.0. | |
United States Auto Loan Market Analysis by Mordor Intelligence
The United States Auto Loan Market size is expected to increase from USD 676.20 billion in 2025 to USD 707.81 billion in 2026 and reach USD 889.45 billion by 2031, growing at a CAGR of 4.67% over 2026-2031.
A finalized federal car loan interest deduction that permits up to USD 10,000 for loans on domestically assembled vehicles through 2028 supports affordability at the margin and encourages credit uptake in the United States auto loan market. Portfolio mix trends favor captive lenders and fintech platforms, with captives and fintechs positioned as the fastest growers through 2031 on the back of digital origination and better funding economics in the United States auto loan market. Funding conditions have been broadly resilient since late 2025 as auto ABS volumes and spreads stabilized, keeping prime issuers competitive on APRs in the United States auto loan market. Lenders continue to invest in automation and decisioning at the point of sale, with scaled platforms processing millions of applications annually while compressing time to decision in the United States auto loan market. Credit performance is bifurcated as subprime credit conditions remain more challenging than prime, a theme the Federal Reserve highlights in its 2025 consumer delinquency review, which influences underwriting and pricing in the United States auto loan market.
Key Report Takeaways
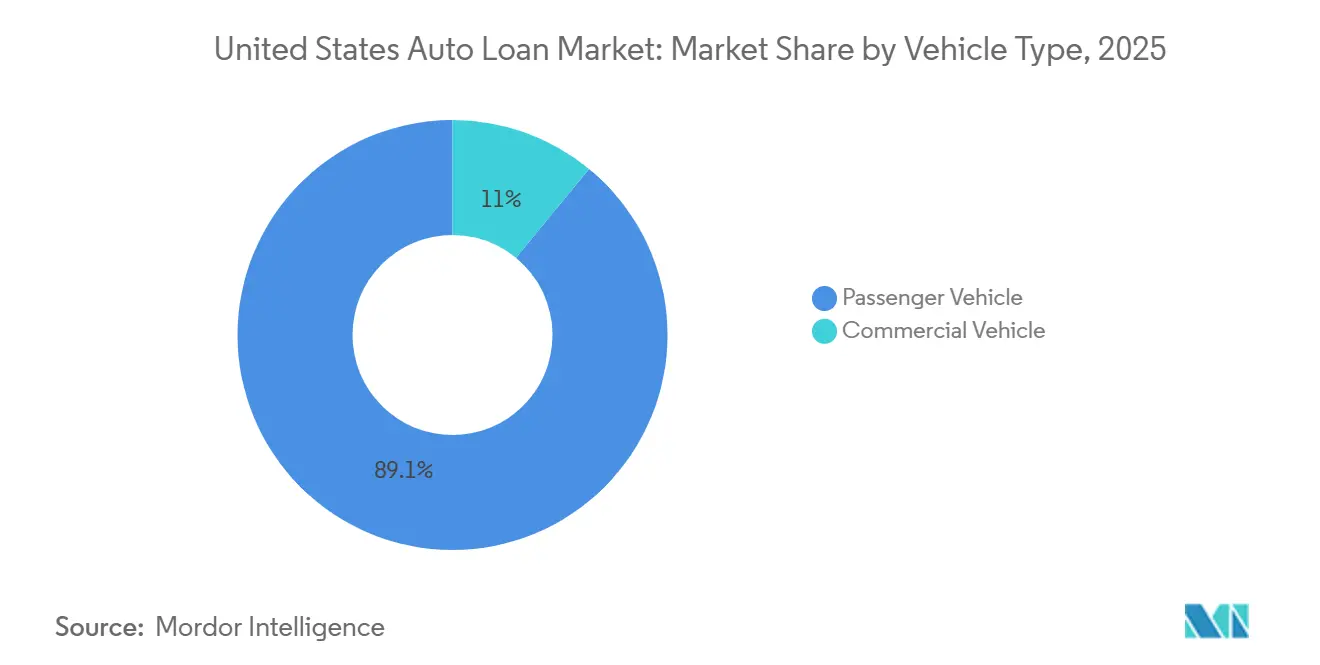
- By vehicle type, passenger vehicles led with 89.05% of the United States auto loan market share in 2025, while commercial vehicles are projected to expand at a 6.08% CAGR through 2031.
- By vehicle model, cars accounted for 87.35% of the United States auto loan market share in 2025, while pickups and small vans are projected to grow at a 7.05% CAGR through 2031.
- By ownership, used vehicles held 57.80% of the United States auto loan market share in 2025 and are projected to grow at a 6.45% CAGR through 2031.
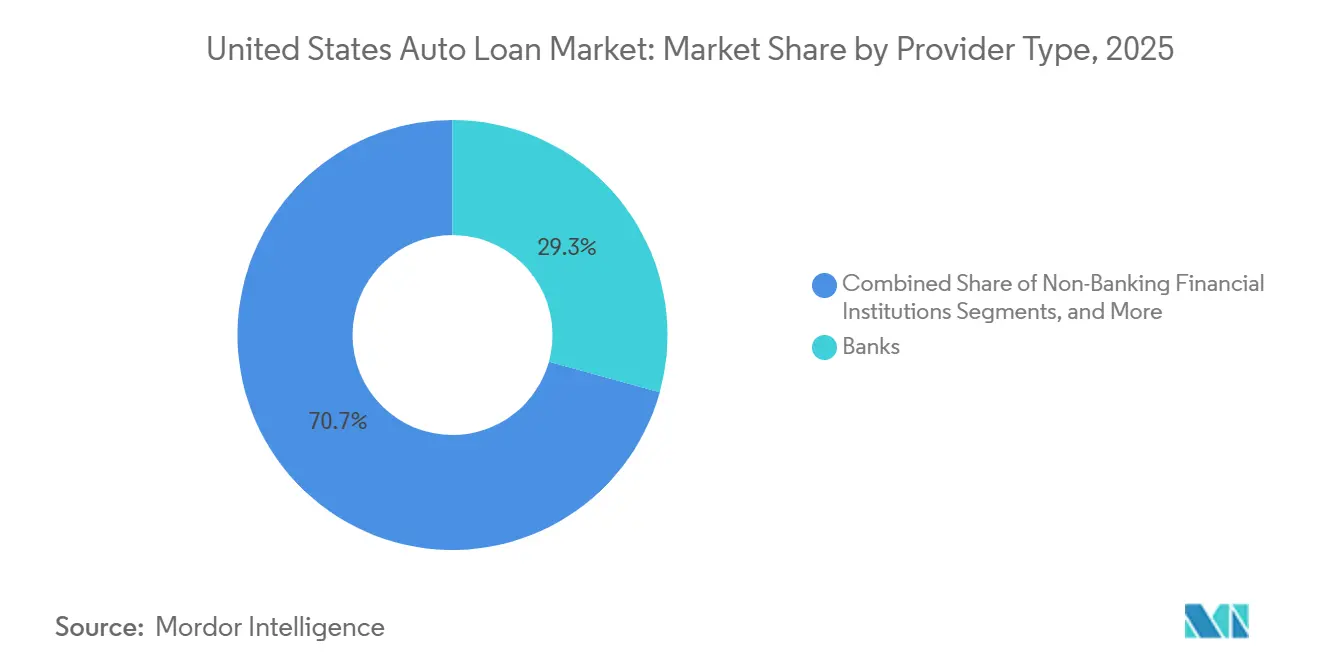
- By provider type, banks held 29.29% of the United States auto loan market share in 2025, while fintech platforms are projected to post the fastest growth at a 12.28% CAGR through 2031.
- By tenure, loans longer than five years held 52.70% of the United States auto loan market share in 2025 and are projected to grow at a 6.57% CAGR through 2031.
Note: Market size and forecast figures in this report are generated using Mordor Intelligence’s proprietary estimation framework, updated with the latest available data and insights as of 2026.
Proportional positioning is established by comparing country level and regional contributions against the global total, including that of United states. The auto loan market share in our global report expresses these relative weights.
United States Auto Loan Market Trends and Insights
Drivers Impact Analysis*
| Driver | (~) % Impact on CAGR Forecast | Geographic Relevance | Impact Timeline |
|---|---|---|---|
| Digitally authenticated eContracting reduces time-to-fund and expands addressable approvals | +0.8% | Global, early gains in California, Texas, and Florida dealership hubs | Medium term (2-4 years) |
| ABS market access normalizes funding costs for prime issuers | +1.2% | Global, concentrated among captive lenders and national banks | Medium term (2-4 years) |
| New-vehicle inventory recovery and OEM incentives lift captive-finance originations | +1.0% | Global, with spill-over to dealer networks in the Midwest and Southeast | Short term (≤ 2 years) |
| Used-vehicle finance as volume anchor amid affordability-led mix shift | +1.4% | Global, pronounced in lower-income metros and rural corridors | Long term (≥ 4 years) |
| Point-of-sale transferability of federal clean-vehicle credits | +0.3% | National, early uptake in the Pacific and Mountain states | Short term (≤ 2 years) |
| Data-driven underwriting lowers fraud and early-default risk | +0.6% | Global fintech adoption is concentrated in urban tech corridors | Medium term (2-4 years) |
| Source: Mordor Intelligence | |||
Digitally Authenticated eContracting Reduces Time-to-Fund and Expands Addressable Approvals
Digital contracting continues to shorten the time between negotiation and funded contracts, which eases dealer floor-plan exposure and reduces abandonment during funding. Wolters Kluwer reported a 7.07% sequential increase in eContracting volume in Q2 2025 and a 9.26% year-over-year rise, underscoring sustained adoption at scale in the United States auto loan market[1]Wolters Kluwer, “Wolters Kluwer Announces Second Quarter Data for Its Auto Finance Digital Transformation Index,” Wolters Kluwer, wolterskluwer.com. Broader selling volumes supported this digitization push as new-vehicle sales in June 2025 paced at 15.3 million units, signaling a strong retail backdrop for electronic workflows in dealer finance offices. At the lender level, Ally processed 14.6 million applications in 2024 and reported a 10.41% yield on retail auto receivables, which shows that scaled originations and disciplined pricing can coexist when friction is engineered out of the onboarding experience [2]Ally Financial, “Ally 2025 Proxy Statement,” Ally, ally.com. End-to-end digital origination reduces processing time and manual reconciliation, with lenders reporting material approval-time compression and lower fulfillment costs in the United States auto loan market. Adoption is densest in California, Texas, and Florida, given dealer concentration and consumer digital familiarity, while rural markets advance as broadband availability and dealer training improve over the medium term.
ABS Market Access Normalizes Funding Costs for Prime Issuers, Enabling Competitive APRs
Securitization activity strengthened through late 2025, with asset-backed securities issuance reaching USD 358 billion by October 2025 and auto ABS representing 34% of that total at over USD 123 billion, supporting competitive funding for prime-focused issuers in the United States auto loan market. Investor acceptance of alternative scoring rose as VantageScore usage in ABS set new records in 2025, with more than USD 22.5 billion of deals using its models, a signal that investors value transparency and data breadth in collateral pools. Policy adjustments reinforced structural flexibility for lenders, as the Federal Reserve’s December 2025 Truth in Lending thresholds update for 2026 streamlined compliance for higher-value loans in packaging and disclosure. Banks also moderated direct exposure to auto balances through mid-2024, which opened space for captives and select nonbanks to leverage the ABS window and retail deposits where available in the United States auto loan market. The combined effect is a funding base that is both deep and diversified for well-structured prime pools, which supports stable APRs and predictable access to term funding across cycles in the United States auto loan market.
Used-Vehicle Finance Remains the Volume Anchor Amid Affordability-Led Mix Shift
Subprime pool performance in late 2025 showed higher 30-day-plus delinquencies within securitized collateral, which kept risk management a central priority for lenders that lean into used volumes. Negative equity remains a persistent issue, with the CFPB documenting higher repossession risk for borrowers who roll prior balances into new contracts, a pattern that can be most acute when the collateral used depreciates faster than the principal paydown. Certified pre-owned programs help mitigate loss severity by improving collateral quality, which allows captives and banks to sustain competitive pricing even as affordability headwinds persist in the United States auto loan market. This steady mix aligns with consumer budgets and dealer inventory, and it provides a buffer against new-vehicle price pressures.
Point-of-Sale Transferability of Federal Clean-Vehicle Credits Boosts Financed EV Uptake
Point-of-sale transferability enabled eligible EV buyers to apply the federal clean-vehicle credit directly at purchase through late 2025, which reduced financed amounts and monthly payments for qualifying units in the United States auto loan market. The IRS confirmed that vehicles acquired after September 30, 2025, no longer qualify, absent a prior binding contract, which shifts the economics of many 2026 EV transactions and introduces new considerations for lenders and dealers [3]Internal Revenue Service, “Credits for New Clean Vehicles Purchased in 2023 or After,” IRS, irs.gov. Industry outlooks for 2026 anticipate a phase where EV adoption continues without the same federal tailwind, while interest in hybrids and off-lease EVs remains a factor in used channels. Captives are testing telematics-supported pricing and maintenance bundles to protect EV residuals and improve end-of-term outcomes for lenders and consumers in the United States auto loan market. Geographic concentration of EV financing remains strongest in Pacific and Mountain states, where infrastructure and local incentives help offset the change in federal policy.
Restraints Impact Analysis*
| Restraint | (~) % Impact on CAGR Forecast | Geographic Relevance | Impact Timeline |
|---|---|---|---|
| Elevated subprime delinquency and loss normalization tighten credit and raise APRs | -1.1% | Global, concentrated in low-income metros and Rust Belt corridors | Medium term (2-4 years) |
| Auto insurance premium inflation raises total cost-to-drive and DTI/PTI fail rates | -0.7% | National, with spill-over acute in New Jersey, Rhode Island, Michigan, Washington DC | Long term (≥ 4 years) |
| Regulatory scrutiny of add-ons, negative equity, and servicing practices curbs fee income | -0.5% | National, California, and New York enforcement lead | Medium term (2-4 years) |
| Investor caution on deep-subprime ABS shelves constrains funding for fringe lenders | -0.9% | National, subprime originators in Texas, Georgia, and Nevada are most exposed | Medium term (2-4 years) |
| Source: Mordor Intelligence | |||
Elevated Subprime Delinquency and Loss Normalization Tighten Credit and Raise APRs
Consumer delinquency pressures became more visible during 2025, with the Federal Reserve noting broader increases across credit products and higher transition rates into later-stage delinquencies, which tightened underwriting in the United States auto loan market. Lenders responded by focusing origination toward stronger credit tiers and by tempering approval rates for riskier segments to maintain portfolio quality. Banks also reduced direct auto balances through mid-2024, creating room for captives and select nonbanks to absorb eligible demand with balanced risk models in the United States auto loan market. This bifurcation between prime and subprime performance adds pricing pressure to lower-score cohorts and places a premium on robust verification and servicing practices. While broader employment conditions remain supportive, elevated monthly payments and non-loan ownership costs continue to test payment capacity in the United States auto loan market.
Regulatory Scrutiny of Add-ons, Negative Equity, and Servicing Practices Curbs Fee Income
Federal scrutiny of contract terms, disclosures, and add-on products has intensified since 2024, with proposed rules that would bar certain unilateral amendments and waivers across consumer finance contracts, which increases compliance duties for lenders and dealers in the United States auto loan market. The CFPB also documented the prevalence of negative equity and its link to higher repossession risk, reinforcing the need for lenders to manage loan-to-value and trade-in dynamics at origination. California’s Combating Auto Retail Scams Act, effective October 2026, mandates clearer price and add-on disclosures and introduces a three-day cancellation right for specific used-vehicle transactions, which reduces cross-sold fee revenue and may slow throughput in the state. States such as Louisiana and Ohio updated documentary fee rules for 2026, which affect dealer fee structures and financed amounts where those fees are rolled into principal. The net effect is a shift toward more transparent pricing with lower ancillary revenue, which tightens margins and encourages lenders to rely more on core lending economics in the United States auto loan market.
*Our forecasts treat driver/restraint impacts as directional, not additive. The impact forecasts reflect baseline growth, mix effects, and variable interactions.
Segment Analysis
By Vehicle Type: Fleet Electrification and Last-Mile Logistics Lift Commercial Segment
Passenger vehicles commanded 89.05% of 2025 originations, while commercial vehicles are projected to expand at a 6.08% CAGR through 2031 as last-mile delivery and small fleet demand increase within the United States auto loan market. This composition reflects the scale of retail financing, but also a gradual shift as logistics operators standardize telematics-linked loans that adjust pricing to actual usage and maintenance. Telematics integration and route analytics inform risk profiling, which helps lenders improve recoveries and match terms to asset life in the United States auto loan market. Electric and alternative-fuel commercial units carry higher sticker prices but benefit from structured products such as residual risk sharing and battery-inclusive financing that protect both obligor and lender. Full-service leases that bundle maintenance and fleet management reduce operating volatility for small operators and keep amortization aligned with utilization, which supports performance stability.
Commercial financing centers on corridors with manufacturing, agriculture, and logistics hubs across the Midwest and Southeast, where replacement cycles and safety compliance drive steady refresh of equipment. Retail passenger vehicle volumes remain the anchor due to entrenched captive financing and a large base of repeat buyers who respond to OEM incentives and branded loyalty offers in the United States auto loan market. Small fleets and owner-operators benefit from online applications and automated data validation that cut approval timing from days to hours while expanding access beyond relationship-based lending. Lenders maintain focus on used trucks as well, balancing residual value, maintenance costs, and historical performance to align pricing and terms with the cash flow profile of buyers. These combined dynamics reinforce a steady but diversified trajectory for the vehicle type mix over the forecast period.


By Vehicle Model: Lifestyle Marketing and Residual Strength Propel Pickup Segment
Cars, including sedans, hatchbacks, and SUVs, held 87.35% share in 2025, while pickups and small vans are projected to grow at a 7.05% CAGR to 2031, supported by strong three-year residuals that preserve 65-70% of MSRP and sustain favorable trade cycles in the United States auto loan market. Dual-use positioning for pickups appeals to households to balance recreational and work needs, which expands addressable demand and helps lenders underwrite a broader set of use cases. Captives leverage tiered APR incentives and loyalty programs to retain repeat buyers who trade with less negative equity due to stronger resale values. Certified pre-owned programs add depth to model-level financing by extending warranties, roadside assistance, and inspection standards that reduce loss severity on defaults. Regionally, pickup financing is strongest in Southern and Mountain states, where lifestyle and commercial uses overlap.
Motorcycles and scooters remain specialist segments with seasonal cycles, while heavy trucks and buses operate under commercial credit criteria that tie to utilization and operator creditworthiness. Cars remain the workhorse of household transportation, but incremental growth favors pickups and crossovers where OEMs can justify greater incentive spend per unit relative to margin. Lenders use digital tools to personalize offers and streamline funnel conversion, a process illustrated by Capital One’s conversational assistant that lowers friction early in the shopping journey. Certified pre-owned financing offers from OEMs, including low APR promotions on select models, help preserve affordability and keep late-model inventory moving through dealer channels. These dynamics support the United States auto loan market by stabilizing collateral values and enabling repeat purchase cycles.
By Ownership: Affordability Constraints Accelerate Used-Vehicle Dominance
Used vehicles held a 57.80% share in 2025 and are projected to grow at a 6.45% CAGR through 2031, which reinforces used vehicles as the volume anchor of the United States auto loan market. The United States auto loan market size tied to used inventory benefits from lower per-loan balances and from CPO programs that extend warranties and lower default loss severity by assuring vehicle condition. Certified programs also boost auction recoveries when repossessions occur because warranty transferability and inspection documentation support stronger bids. As lenders manage collateral volatility, they rely on CPO supply to maintain yields that balance consumer affordability with risk in the United States auto loan market. Origination platforms continue to streamline digital verification for income and employment, which helps contain fraud and improve funnel conversion.
New-vehicle finance grows more slowly due to higher transaction prices, but normalized inventories and selective incentives support steady prime-tier volumes in 2026. Subprime delinquencies in securitized pools remained meaningfully higher than prime in late 2025, which encourages lenders to stay disciplined on LTVs in used channels. Negative equity dynamics documented by the CFPB further motivate the use of shorter terms or residual structures to avoid compounding rollovers at trade-in. Captives continue to subsidize select CPO models with promotional APRs, which guards share and sustains late-model flow through franchise dealers. The United States auto loan industry remains anchored by used-vehicle finance, where affordability, verified condition, and disciplined underwriting keep volumes healthy.
By Provider Type: Fintech Disruption Redefines Near-Prime Access
Banks held a 29.29% share in 2025, while fintech platforms are projected to post a 12.28% CAGR to 2031 and OEM captives an 8.02% CAGR, reshaping access and competition across the United States auto loan market. Scaled lenders have migrated to cloud-native microservices, embedded ML scoring, and near real-time verifications that deliver sub-two-minute credit decisions and reduce fulfillment costs at scale. Captives defend share by pairing subsidized APRs with dealer programs that raise showroom close rates while keeping time-to-fund tight. As banks balance risk appetite and reserve levels, they lean into prime tiers and use deposit funding to stay competitive in the United States auto loan market. Fintech partnerships provide white-label origination stacks to credit unions and regionals, broadening reach with compliance automation and data connectivity.
In parallel, adoption of alternative scoring gained traction in structured finance, with VantageScore usage in ABS issuance reaching record levels in 2025, signaling broader acceptance among market participants. The United States auto loan industry benefits from this transparency as lenders calibrate approval policies for near-prime borrowers with steady cash flows. Digital assistants and pre-qualification tools such as Capital One’s Chat Concierge support higher funnel conversion by addressing research and test-drive scheduling before a full application is submitted. Portfolio strategies focus on diversification across credit tiers and channels to manage shifts in funding costs and risk. These moves support a competitive balance where banks, captives, and fintechs each lean into their structural advantages.
By Tenure: Extended Terms Balance Affordability Against Equity Erosion
Loans longer than five years held 52.70% of 2025 originations and are projected to grow at a 6.57% CAGR through 2031, reflecting how extended terms help consumers meet payment targets in the United States auto loan market. The United States auto loan market size associated with longer tenures continues to expand as vehicle prices remain elevated and lenders price for longer risk horizons within credit policy. Lenders weigh the trade-off between monthly affordability and total interest paid, which rises with term length and can compound negative equity risk if depreciation outpaces amortization. Residual-based products and balloon structures reduce per-payment amounts by setting a future guaranteed value, which can limit rollovers at trade time. Servicing strategies emphasize proactive interventions to keep accounts current as ownership costs remain high.
Shorter-term loans in the under-three-year and three-to-five-year bands see steadier but slower growth because monthly payments are higher at a given APR and balance. The CFPB’s analysis of negative equity underscores the importance of right-sized terms and disciplined LTVs to avoid elevated repossession risk within two years of origination. Lenders also use term-based pricing to reflect cumulative risk and to encourage borrowers to consider structures that align with expected usage and maintenance needs. As vehicles age during the loan, maintenance costs increase, which can pressure budgets if payments remain high relative to income. These realities keep term selection central to both borrower outcomes and portfolio performance in the United States auto loan market.
Geography Analysis
State-level policy and fee frameworks shape affordability and operating models, and these differences often dictate how originations distribute in the United States auto loan market. Documentary fees vary widely, and Ohio’s updated 2026 guidance caps documentary service charges at USD 398, while Louisiana’s levels adjust annually based on inflation formulas that constrain increases. California’s CARS Act takes effect in October 2026, adding disclosures and a three-day cancellation right for certain used transactions priced at USD 50,000 or less, which can reshape throughput and finance-and-insurance practices in the state. These measures highlight how compliance can affect financed amounts and ancillary revenue, which influences lender pricing and dealer incentives. Lenders operating across multiple states maintain jurisdictional overlays to align underwriting and disclosure with local requirements in the United States auto loan market.
Repossession and cure rules differ by state, creating a compliance and operations matrix for servicers and repossession agents. Massachusetts provides a 21-day right to cure, while Ohio mandates specific notices on default and public sale timing, and California’s Rees-Levering Act has separate reinstatement provisions distinct from UCC redemption, all of which affect recovery timing and cost in the United States auto loan market. Louisiana limits self-help repossession and require specific legal steps, which adds time and procedural cost relative to other states. Alaska and other jurisdictions lay out different sale requirements once collateral is retaken, and lenders coordinate with counsel and agents to ensure process fidelity. These disparate rules mean recovery workflows and loss severity can vary by state, which informs pricing and reserve policies.
Usury and rate-cap regimes further segment underwriting strategies and product availability. States such as California cap certain consumer rates unless specific exemptions tied to federal benchmarks apply, while other states impose no general cap for corporate borrowers, which affects dealer-arranged financing options and risk-based pricing. Policymakers also consider broader consumer finance reforms, including 36% APR cap proposals that exclude vehicle purchase loans, which underscores the distinct policy treatment of auto finance within consumer credit frameworks. As these regimes evolve, national lenders maintain state-by-state calibration and prefer scalable compliance automation tied to origination and servicing systems. This approach limits errors and preserves consistency across dealer networks and digital channels in the United States auto loan market. The result is a geographic map where policy, fees, and repossession norms influence both affordability and operational risk.
Mordor Intelligence examines the auto loan market across diverse other regional markets as well, including Europe, while also offering granular country-level perspectives for Brazil, France, Russia, Germany, South Korea, China, India, and Japan and more.
Competitive Landscape
The United States auto loan market remains competitive and moderately fragmented, with banks, captives, and fintech platforms each leaning into distinct structural advantages. Banks focus on prime borrowers and use deposits to price competitively, while captives couple OEM incentives and dealer integration to defend share in retail channels. Fintech platforms bring speed and data depth to near-prime approvals, expanding coverage where traditional models are most rigid in the United States auto loan market. Lender technology programs illustrate this arms race, with Ally processing 14.6 million applications in 2024 on cloud-native stacks and embedding machine learning for underwriting and servicing. Digital assistants such as Capital One’s Chat Concierge streamline vehicle research and test-drive scheduling while delivering pre-qualification pathways that improve conversion.
Strategic moves in 2025 and 2026 underscore the importance of low-cost funding and physical distribution. JPMorgan announced plans to open more than 160 branches in over 30 states in 2026 and renovate 600 locations, which expands retail deposit gathering that can support consumer lending across categories, including auto. Santander entered into a merger agreement to acquire Webster Financial, which expands deposit capacity and positions the combined franchise to price auto receivables more competitively where risk and return are attractive in the United States auto loan market. Ally authorized a multiyear USD 2 billion share repurchase program in December 2025, signaling capital strength alongside continued focus on dealer services and deposit growth. These examples show how funding, distribution, and technology investments converge to shape share outcomes.
Capital markets acceptance of alternative data also supports competitive positioning. VantageScore usage in ABS set records in 2025, which helps issuers tell a more complete credit story to investors and maintain diversified funding windows in the United States auto loan market. Captives test telematics-linked programs and EV residual protection features that reduce depreciation risk, aiming to build durable positions as electrification advances. Banks, in turn, balance risk across cycles while expanding digital originations and partnerships that improve funnel efficiency. Competitive intensity remains high across credit tiers, and strategic differentiation rests on the interplay of cost of funds, digital capabilities, and compliance maturity in the United States auto loan market.
United States Auto Loan Industry Leaders
Ally Financial
Capital One Auto Finance
Toyota Financial Services
Bank of America Auto
Wells Fargo Auto
- *Disclaimer: Major Players sorted in no particular order

Recent Industry Developments
- February 2026: Banco Santander entered into a merger agreement to acquire Webster Financial Corporation for USD 12.3 billion (USD 48.75 cash plus 2.0548 Santander ADSs per Webster share), creating a top 10 retail and commercial bank by assets nationwide with an expected close in the second half of 2026. The consolidation positions Santander Consumer USA to leverage Webster's USD 80 billion in deposits to fund auto receivables at lower costs than asset-backed securities, tightening competitive pricing against captive lenders who similarly exploit deposit-based funding advantages following Ford and GM's industrial bank approvals.
- February 2026: JPMorgan Chase announced plans to open more than 160 branches across 30+ states in 2026 while renovating 600 existing locations. The three-year expansion blueprint calls for 500+ new branches, 1,700 renovations, and 3,500 employees, targeting underserved markets where deposit mobilization can undercut fintech platforms' wholesale-funded origination models and recapture retail auto lending share lost to captives and nonbanks during the 2023-2024 retrenchment.
- December 2025: Ally Financial authorized a multiyear, USD 2 billion share repurchase program with no expiration date, beginning in Q4 2025, to return capital to shareholders while maintaining a robust CET1 ratio above regulatory minimums. The buyback complements Ally's strategic refocus on Dealer Financial Services, Corporate Finance, and deposits following divestitures of noncore consumer portfolios, streamlining operations around core auto origination competencies.
- March 2025: Capital One launched Chat Concierge, a multi-agent conversational assistant that compares vehicles, schedules test drives, and personalizes loan offers without requiring upfront personal information, reducing abandonment rates and streamlining the origination funnel. The interface integrates with dealer CRM systems and reflects lenders' pivot toward digital-first origination with sub-two-minute decision turnarounds.


United States Auto Loan Market Report Scope
An automobile loan is a secured installment loan enabling borrowers to finance the purchase of passenger or commercial vehicles, including two-wheelers. The vehicle serves as collateral, with lenders paying sellers directly, and borrowers repaying the loan plus interest in monthly installments over a set term.
| Passenger Vehicle |
| Commercial Vehicle |
| Motorcycles/Scooters |
| Cars (Hatchbacks, Sedans, SUVs, etc.) |
| Pickups and Small Vans |
| Trucks and Buses |
| Others |
| New Vehicles |
| Used Vehicles |
| Banks |
| Non-Banking Financial Institutions |
| Original Equipment Manufacturers |
| Other Provider Types (Fintech Companies) |
| Less than 3 Years |
| 3-5 Years |
| More than 5 years |
| By Vehicle Type | Passenger Vehicle |
| Commercial Vehicle | |
| By Vehicle Model | Motorcycles/Scooters |
| Cars (Hatchbacks, Sedans, SUVs, etc.) | |
| Pickups and Small Vans | |
| Trucks and Buses | |
| Others | |
| By Ownership | New Vehicles |
| Used Vehicles | |
| By Provider Type | Banks |
| Non-Banking Financial Institutions | |
| Original Equipment Manufacturers | |
| Other Provider Types (Fintech Companies) | |
| By Tenure | Less than 3 Years |
| 3-5 Years | |
| More than 5 years |


Key Questions Answered in the Report
What is the United States auto loan market size in 2026 and the growth outlook to 2031?
It is USD 707.81 billion in 2026 and is projected to reach USD 889.45 billion by 2031 at a 4.67% CAGR, supported by resilient funding access and continued digital adoption.
Which segments lead growth within the United States auto loan market through 2031?
Commercial vehicles, pickups and small vans, fintech providers, and loan tenures for longer than five years are projected to grow fastest based on the current mix and funding dynamics.
How are policy changes affecting the United States auto loan market in 2026?
A finalized car loan interest deduction through 2028 and California’s CARS Act taking effect in October 2026 influenced affordability, disclosures, and dealer practices, with lenders calibrating underwriting and pricing accordingly.
What risks are most material to portfolio performance in the United States auto loan market?
Elevated subprime delinquency, negative equity at trade-in, and insurance-driven total cost-to-own pressures necessitate stricter underwriting practices and more selective term adjustments in the market.
How are lenders in the United States auto loan market using technology to compete?
Lenders deploy eContracting, alternative data, and AI assistants to cut time to decision, curb fraud, and personalize offers, while integrated CPO programs support collateral quality and lower loss severity.
What role does securitization play in the United States auto loan market today?
Auto ABS remains a key funding channel for prime issuers, with stable volumes and broader investor acceptance of alternative scoring that helps maintain competitive APRs and diversified liquidity.
Page last updated on:


