ESG Finance Market Size and Share
Market Overview
| Study Period | 2020 - 2031 |
|---|---|
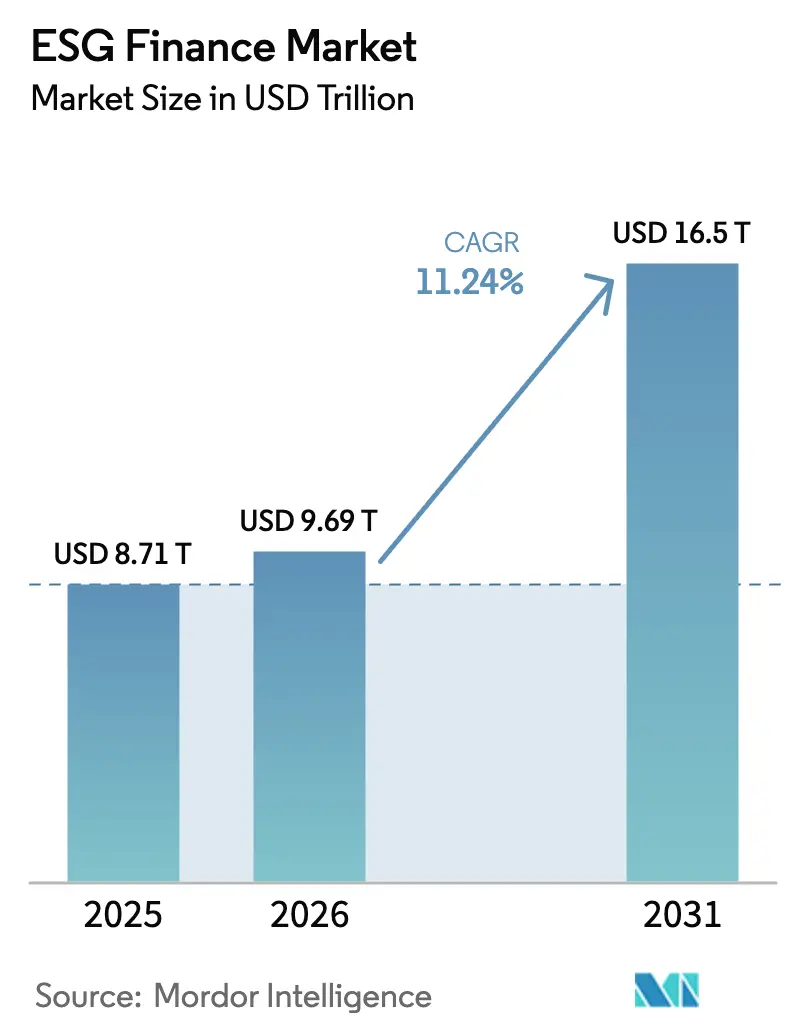
| Market Size (2026) | USD 9.69 Trillion |
| Market Size (2031) | USD 16.5 Trillion |
| Growth Rate (2026 - 2031) | 11.24% CAGR |
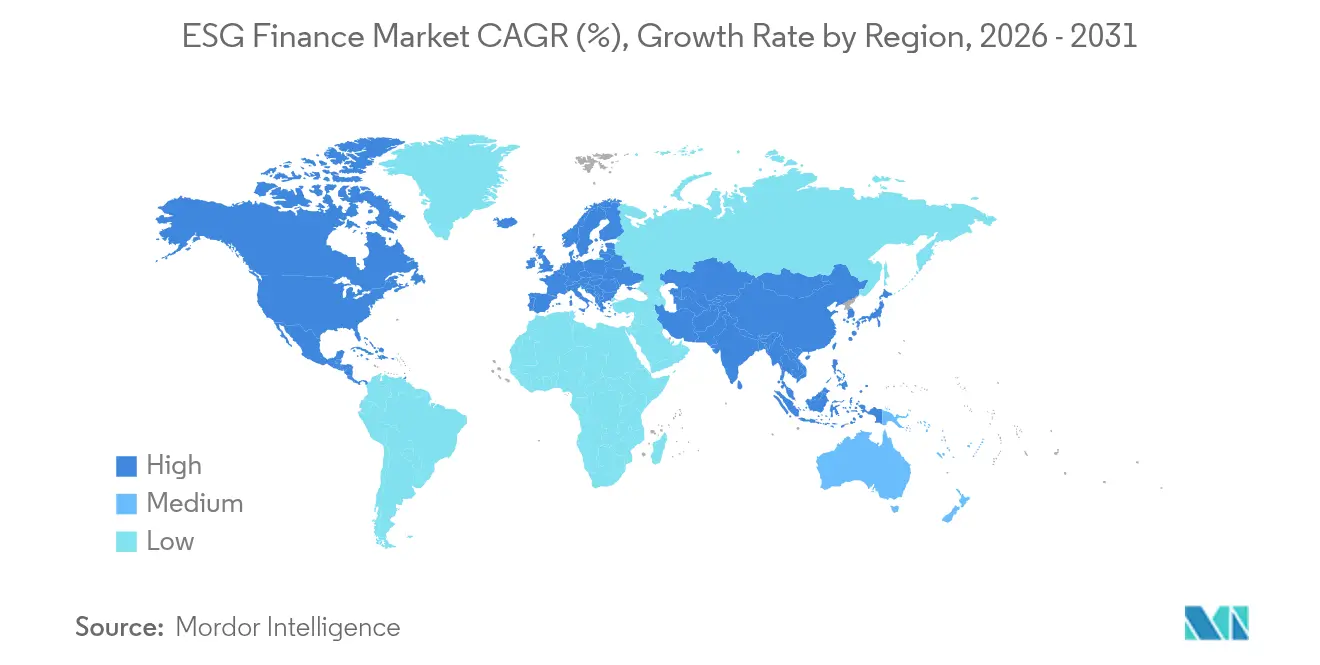
| Fastest Growing Market | Asia Pacific |
| Largest Market | Europe |
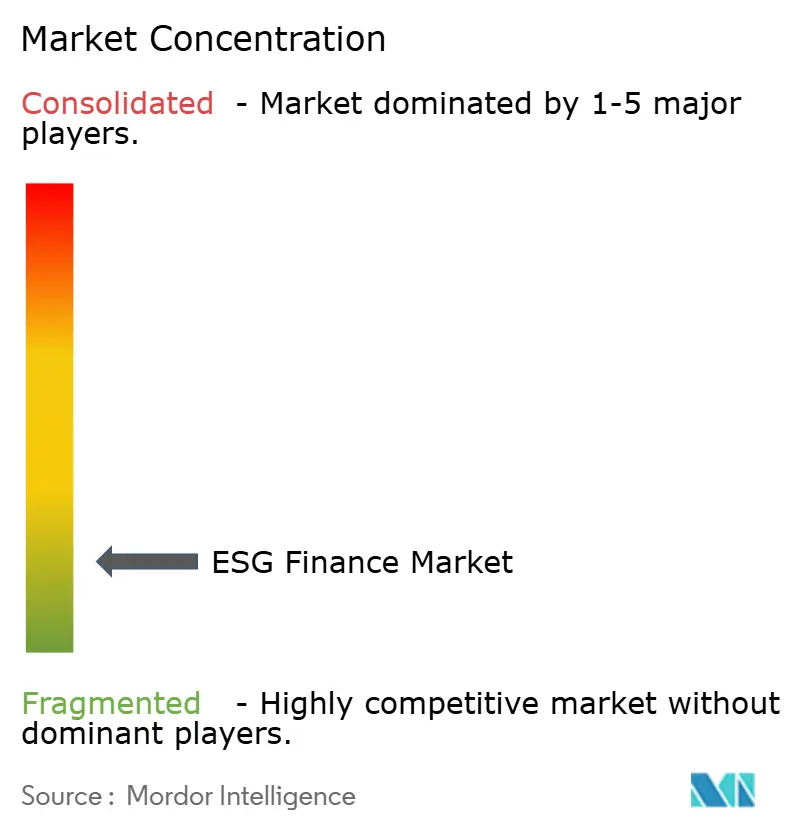
| Market Concentration | Low |
Major Players *Disclaimer: Major Players sorted in no particular order Image © Mordor Intelligence. Reuse requires attribution under CC BY 4.0. | |
ESG Finance Market Analysis by Mordor Intelligence
The ESG Finance Market size is expected to increase from USD 8.71 trillion in 2025 to USD 9.69 trillion in 2026 and reach USD 16.5 trillion by 2031, growing at a CAGR of 11.24% over 2026-2031.
Growth rests on mandatory sustainability disclosures now enforced across the United States, European Union, and several Asia-Pacific markets, which channel capital toward issuers with verifiable environmental and social performance data. Heightened demand for transparent, use-of-proceeds structures cements green bonds as the dominant instrument class, while performance-linked formats such as sustainability-linked loans deepen issuer participation. FinTech platforms accelerate data standardization, helping retail investors align small-ticket investments with climate and inequality objectives. Meanwhile, policy divergence—illustrated by large U.S. banks exiting the Net-Zero Banking Alliance—introduces market volatility yet also incentivizes regulatory arbitrage strategies that fuel product innovation.
Key Report Takeaways
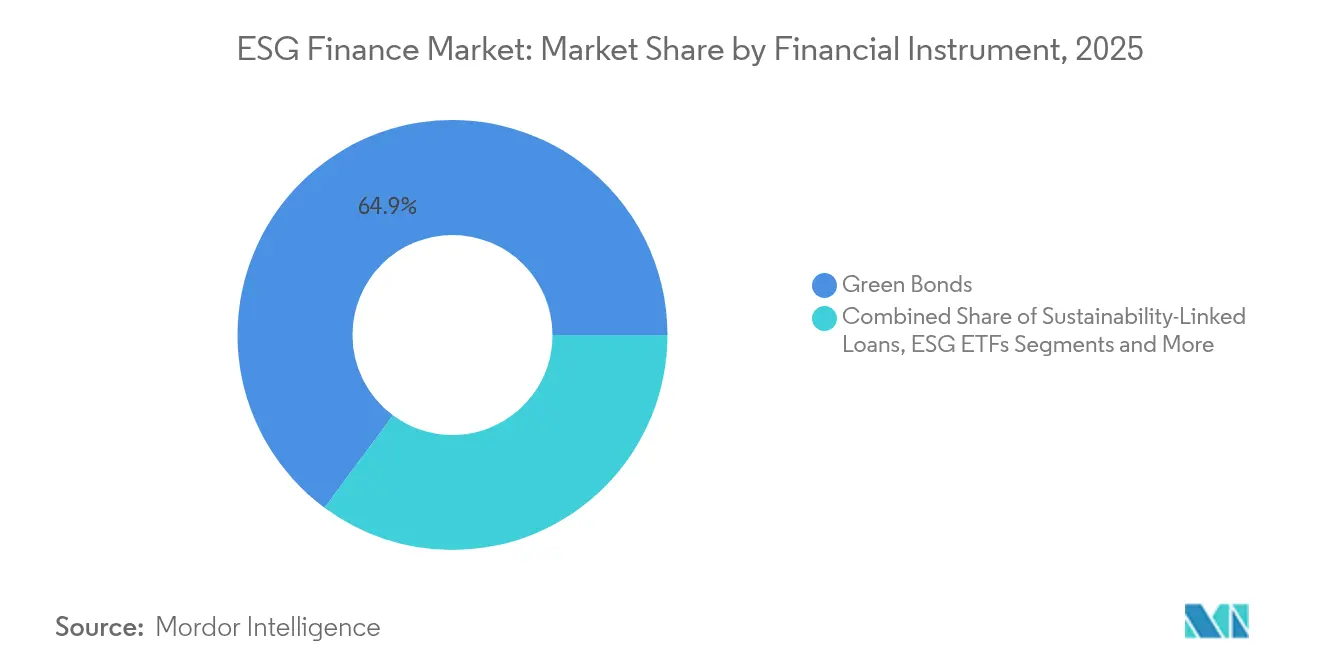
- By financial instrument, green bonds led with 64.85% of ESG finance market share in 2025, while sustainability-linked loans are projected to expand at a 16.02% CAGR through 2031.
- By investor type, institutional investors held 23.75% of the ESG finance market size in 2025; retail investors registered the fastest trajectory at a 12.05% CAGR to 2031.
- By ESG theme, environmental investments accounted for 20.72% of the ESG finance market size in 2025; social-focused strategies are poised to advance at a 12.39% CAGR through 2031.
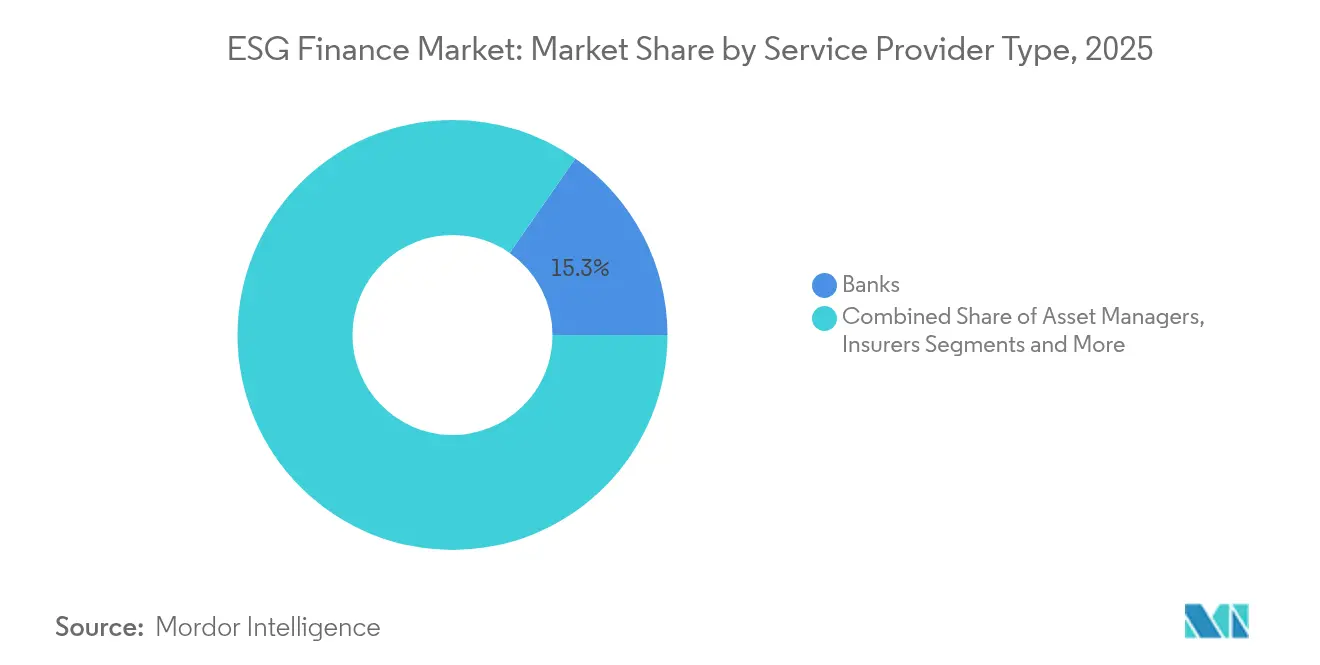
- By service-provider group, banks maintained a 15.32% share of the ESG finance market in 2025, while FinTech platforms are expected to post a 16.74% CAGR through 2031.
- By region, Europe commanded 37.55% of the ESG finance market share in 2025; Asia-Pacific is projected to record a 13.18% CAGR, the highest globally, to 2031.
Note: Market size and forecast figures in this report are generated using Mordor Intelligence’s proprietary estimation framework, updated with the latest available data and insights as of 2026.
Global ESG Finance Market Trends and Insights
Drivers Impact Analysis*
| Driver | (~) % Impact on CAGR Forecast | Geographic Relevance | Impact Timeline |
|---|---|---|---|
| Regulatory mandates for sustainable disclosure | +2.5% | Global (EU, U.S. lead) | Medium term (2-4 years) |
| Institutional investor demand for ESG portfolios | +1.8% | Global, concentrated in developed markets | Long term (≥ 4 years) |
| Rising issuance of green & sustainability-linked bonds | +1.2% | Global (Europe, Asia-Pacific core) | Short term (≤ 2 years) |
| Corporate net-zero commitments | +0.8% | Global, led by multinationals | Long term (≥ 4 years) |
| Tokenization & blockchain-based ESG instruments | +0.6% | North America, EU early adoption; Asia-Pacific following | Medium term (2-4 years) |
| Biodiversity-risk metrics integration | +0.4% | Global, nature-rich economies prioritize | Long term (≥ 4 years) |
| Source: Mordor Intelligence | |||
Regulatory Mandates for Sustainable Disclosure
Standardized climate and sustainability reporting rules in the United States and European Union reduce information asymmetry, lower compliance friction, and give asset owners comparable Scope 1 and Scope 2 metrics. The U.S. Securities and Exchange Commission will require large accelerated filers to publish greenhouse-gas data in 2026 filings, creating an immediate incentive for high-emission sectors to finance decarbonization. The EU’s Corporate Sustainability Reporting Directive extends oversight to social and governance metrics under a double-materiality lens, broadening corporate data sets available to investors[1]European Commission, “Corporate Sustainability Reporting Directive,” ec.europa.eu . Parallel regulations in California and several Asian jurisdictions reinforce the global baseline, making cross-border disclosure alignment indispensable for multinational issuers. As comparable data spreads, capital naturally tilts toward entities that meet or outperform regional benchmarks, reinforcing the ESG finance market’s growth flywheel.
Institutional Investor Demand for ESG-Aligned Portfolios
Pension, insurance, and sovereign funds now view climate risk as a core fiduciary concern rather than a peripheral ethical choice. Norway’s Government Pension Fund Global expanded exclusion lists to cover severe biodiversity damage, signaling that environmental stewardship is integral to long-term wealth preservation[2]Norway Government Pension Fund Global, “Responsible Investment Report 2025,” nbim.no . U.S. public pensions increasingly require external managers to prove ESG integration, prompting index providers to embed sustainability screens in flagship benchmarks. Insurance regulators in Europe oblige carriers to run climate stress tests, driving higher allocations to low-carbon bonds and transition-aligned equities. This steady institutional shift crowds capital into compliant issuers and rewards service providers that supply transparent, decision-ready sustainability analytics. Over time, the liquidity premium enjoyed by ESG-rated securities narrows spreads and further accelerates issuance volumes across asset classes.
Rising Issuance of Green & Sustainability-Linked Bonds
Global green bond volume hit around USD 670 billion in 2025, and pipeline visibility suggests renewed momentum as sovereigns finance climate-adaptation infrastructure[3]Climate Bonds Initiative, “Sustainable Debt Market Summary 2024,” climatebonds.net. Sustainability-linked bonds (SLBs) gain popularity among industrial issuers that lack pure-play green projects but still commit to measurable performance targets, with coupon step-ups reinforcing accountability. The European Union’s NextGenerationEU program channels public funds into member-state SLB frameworks, offering a blueprint for emerging-market treasuries. Rating agencies publish second-party opinions that vet use-of-proceeds and KPI credibility, allowing passive funds to enter an asset class once dominated by bespoke mandates. As index creators roll out dedicated green bond benchmarks, ETF wrappers improve secondary-market liquidity, making SLBs a mainstream portfolio component for both institutional and retail buyers.
Corporate Net-Zero Commitments
More than 1,800 listed companies have pledged net-zero pathways, generating multidecade financing demand for renewable energy, carbon-capture infrastructure, and low-carbon supply chains. JPMorgan Chase alone targets USD 2.5 trillion in climate finance by 2030, signaling that large banks will act as capital conduits for corporate transition plans[4]JPMorgan Chase, “2025 Climate Report,” jpmorganchase.com . Disclosure of green-to-brown financing ratios lets investors monitor progress and price transition risk more accurately. Supply-chain decarbonization requirements push ESG finance into mid-cap supplier networks that previously lacked direct access to sustainable funding. Meanwhile, carbon-removal credits emerge as an investable asset class, backed by verifiable capture tons tracked on blockchain registries, broadening the spectrum of net-zero financing instruments.
Restraints Impact Analysis*
| Restraint | (~) % Impact on CAGR Forecast | Geographic Relevance | Impact Timeline |
|---|---|---|---|
| Lack of standardised ESG data & reporting | -1.5% | Global, emerging markets are most affected | Medium term (2-4 years) |
| Green-washing & investor scepticism | -0.9% | Global, higher scrutiny in developed markets | Short term (≤ 2 years) |
| Emerging-market FX volatility | -0.7% | Emerging markets, spillover to global portfolios | Short term (≤ 2 years) |
| Limited ESG talent in regional banks | -0.3% | Asia-Pacific, Middle East & Africa | Medium term (2-4 years) |
| Source: Mordor Intelligence | |||
Lack of Standardised ESG Data & Reporting
Divergent rating methodologies mean the same issuer can score in the top quintile with one data vendor and the bottom with another, forcing investors to buy multiple subscriptions and build internal reconciliation models. Small-cap and emerging-market issuers struggle to absorb the cost of parallel frameworks, limiting their access to international capital. Absence of common taxonomies encourages regulatory arbitrage: issuers list in lenient jurisdictions, undermining global comparability. Data-quality lapses, such as restated emissions inventories, erode investor confidence and inflate due diligence expenses. Until universal baselines emerge, the ESG finance market faces friction that subtracts from headline growth.
Green-Washing & Investor Scepticism
Regulators worldwide tighten marketing rules after identifying funds that label themselves “sustainable” while holding material positions in high-emission industries. The U.S. SEC advanced enforcement actions against misleading ESG disclosures, prescribing fines that increase reputational risk for asset managers. European authorities released draft guidelines on anti-greenwashing to standardize sustainability claims, raising compliance hurdles for new product launches. Rising media scrutiny uncovers discrepancies between stated goals and actual portfolios, prompting sophisticated investors to demand third-party verification. Heightened skepticism temporarily slows inflows into lightly vetted funds but ultimately strengthens the asset class by rewarding transparent structures.
*Our forecasts treat driver/restraint impacts as directional, not additive. The impact forecasts reflect baseline growth, mix effects, and variable interactions.
Segment Analysis
By Financial Instrument: Green Bonds Consolidate Grid Position
Green bonds represented 64.85% of the ESG finance market in 2025, illustrating investor appetite for ring-fenced climate projects that deliver measurable outcomes. The ESG finance market size for green bonds is projected to expand at a high-single-digit pace through 2031 as sovereign, municipal, and supranational issuers channel proceeds into energy transition infrastructure. Sustainability-linked loans, growing at 16.02% CAGR, attract corporations seeking flexibility to use capital across broader operational needs while tying margins to pre-agreed KPIs. Despite lower 2025 shares, ESG-labelled derivatives and transition bonds fill financing gaps for hard-to-abate sectors, illustrating maturation beyond straightforward use-of-proceeds formats. Market infrastructure continues to improve; second-party opinions, verified frameworks, and dedicated index families collectively reduce the cost of issuance and enhance tradability, further crowding capital into labelled debt.
Momentum in ETFs magnifies retail access: Goldman Sachs launched a Global Green Bond ETF that tracks investment-grade issues, broadening the ESG finance market’s investor pool. Sovereign adoption remains pivotal; Germany, Italy, and the United Kingdom maintain multi-year green gilt programs, ensuring regular benchmark-size supply that anchors secondary liquidity. Development finance institutions partner with local banks to provide credit enhancements for emerging-market issues, catalyzing green bond penetration in regions with historically limited capital-market depth. SLB covenant design evolves toward step-down features that reward over-performance, correcting criticism that coupons only ratchet upward. Collectively, these innovations underpin a virtuous cycle of issuance, liquidity, and diversified investor demand that cements labelled debt’s structural dominance in the ESG finance market.


By Investor Type: Retail Digitization Accelerates Democratization
Institutional investors controlled 23.75% of the ESG finance market in 2025, enabled by in-house stewardship teams and multi-asset mandates that integrate sustainability filters across entire portfolios. Fiduciary adaptations—such as New York City Teachers’ Retirement System’s commitment to net-zero by 2040—anchor baseline demand for ESG instruments. Retail investors, however, constitute the fastest-growing cohort, posting a 12.05% CAGR as robo-advisors embed personalized ESG preferences within automated asset-allocation algorithms. Digital brokerages reduce ticket sizes, inviting first-time investors to allocate fractional shares in green bond ETFs and low-carbon equity baskets. This democratization metabolizes fresh liquidity, helping issuers tighten pricing on new deals and encouraging market entrants from traditionally underserved geographies.
Sovereign wealth funds (SWFs) employ intergenerational equity frameworks that amplify long-duration ESG demand; Norway’s GPFG and Singapore’s GIC systematically tilt portfolios toward low-carbon infrastructure and social housing. Insurance companies, governed by Solvency II climate scenarios and NAIC guidance, reweight general-account assets to instruments with certified environmental benefits, underpinning a steady demand base. As retail ownership rises, asset managers develop educational dashboards that translate complex metrics such as Scope 3 emissions into plain-language scorecards. Product providers embed gamified features—carbon-reduction goals and social-impact badges—finely tuned to digital-native investor expectations. Together, these dynamics democratize capital allocation and reinforce institutional stewardship, broadening the ESG finance market’s resilience across economic cycles.
By ESG Theme: Social Pillar Catches Up to Climate Leadership
Environmental mandates accounted for 20.72% of the ESG finance market size in 2025 as investors prioritized decarbonization metrics and biodiversity safeguards to comply with regulatory carbon caps. Yet social-centred strategies now register a 12.39% CAGR, reflecting broadened stakeholder focus on inequality, labor rights, and community inclusion. The Taskforce on Inequality and Social-Related Financial Disclosures (TISFD) opened public consultation in 2024, supplying draft metrics that asset owners already reference when renegotiating mandates. Governance-only strategies maintain relevance, particularly through shareholder voting policies that tie executive compensation to ESG milestones. Integrated approaches—combining E, S, and G elements—gain institutional favor because they better capture the interdependencies among carbon, human capital, and oversight risks.
Bond issuers increasingly adopt social project frameworks to fund affordable housing, healthcare infrastructure, and inclusive education, diversifying labelled-debt supply beyond environmental use cases. Stock exchanges create premium segments for companies meeting combined ESG threshold scores, unlocking index-eligibility benefits that shift capital into balanced performers. Proxy advisory firms calibrate voting guidelines to favour boards that disclose diversity matrices and tie variable remuneration to multi-factor ESG scorecards. Thematic funds focused on fair-wage supply chains, gender equity, and indigenous community support underscore a wider investment canvas that more accurately reflects societal priorities. As data spreads and disclosure mandates mature, social metrics inch toward the same transparency enjoyed by carbon accounting, narrowing the relative valuation gap between environmental and social instruments.
By Service Provider Type: FinTech Platforms Challenge Universal Banks
Banks captured 15.32% of the ESG finance market share in 2025, using their balance sheets to underwrite large-ticket loans and labelled bonds for blue-chip issuers. Universal banks benefit from client relationships and regulatory insight, yet face compressing margins as capital-light FinTechs automate portfolio construction and data aggregation. FinTech platforms, projected to grow at 16.74% CAGR, leverage cloud-native architectures to deliver granular ESG analytics at lower cost, enabling smaller asset managers and retail investors to execute sophisticated screens. Data vendors partner with blockchain consortia to tokenise green-bond coupons and verify carbon credit provenance, reducing settlement friction and enhancing auditability. Meanwhile, asset managers integrate artificial-intelligence engines that parse satellite imagery and IoT sensor feeds to validate issuer disclosures, improving risk-adjusted performance.
Insurance carriers deploy scenario-analysis software that quantifies physical-climate exposure down to asset-level granularity, influencing both underwriting and investment decisions. Advisory firms bundle transition-planning services with capital-raising mandates, though the most successful pivot from generic consulting to outcome-based fee models tied to decarbonization milestones. In regional markets, talent shortages hamper smaller banks’ ability to originate structured ESG products, opening white-space for specialized boutiques. Cooperative efforts among SWIFT, major custodians, and ESG data providers aim to embed sustainability identifiers within global settlement rails, streamlining trade matching and regulatory reporting. Ultimately, technology-enabled specialization tilts value capture away from balance-sheet scale toward analytical depth and data fluency.
Geography Analysis
Europe retained 37.55% of ESG finance market share in 2025 thanks to regulatory clarity, deep investor pools, and established verification architecture such as the EU Taxonomy and Sustainable Finance Disclosure Regulation. The European Central Bank’s climate stress tests anchor supervisory pressure that compels banks to align lending books with decarbonization pathways, reinforcing regional issuance volumes. Paris and Frankfurt maintain competitive advantage in green-bond underwriting leagues, while London preserves relevance by voluntarily mirroring many EU rules in a post-Brexit context. Sovereign entities like Germany and Italy schedule annual green gilt calendars that set benchmark yield curves and attract global reserve-manager participation. Nordic financial institutions extend leadership through sovereign wealth fund policies that integrate biodiversity and human-rights exclusions, reinforcing Europe’s holistic ESG credentials.
Asia-Pacific records the fastest advance, with the ESG finance market expected to expand at 13.18% CAGR through 2031. China’s People’s Bank issued a domestic green finance taxonomy in 2025 that harmonizes with the EU framework on key criteria, improving cross-border fund flows. Japan pilots transition bonds that help industrial firms phase out coal assets while maintaining access to affordable finance, demonstrating a pragmatic pathway for high-emission economies. India’s Securities and Exchange Board finalised assurance standards for green bonds, unlocking inbound flows from development agencies and SWFs. ASEAN member states collectively publish sustainable-finance principles, reducing documentary friction for regional issuers and investors. Younger demographic cohorts in Southeast Asia demand mobile-first ESG investment apps, underpinning retail-driven capital formation that augments institutional allocations.
North America presents mixed signals: mandatory SEC climate disclosures bolster data quality, yet political contestation prompts major banks to exit alliances such as the Net-Zero Banking Alliance. Canada’s Office of the Superintendent of Financial Institutions integrates climate metrics within capital adequacy assessments, pushing domestic banks to refine risk models. Latin American markets leverage biodiversity-linked bonds to monetize natural-capital endowments, translating forest-protection commitments into coupon savings for sovereign treasuries. Gulf Cooperation Council sovereign funds diversify hydrocarbon windfalls into renewable energy and water-desalination projects, using sustainability frameworks to attract co-investment from European partners. Africa pioneers aggregation platforms that bundle smaller clean-energy projects into securitized vehicles, mitigating ticket-size constraints that historically deterred institutional participation. Collectively, these regional dynamics illustrate a converging yet heterogeneous set of pathways toward ESG finance maturity.

Competitive Landscape
Market fragmentation prevails, with the top five players accounting for only one-fifth of assets under management tied to ESG strategies. Universal asset managers BlackRock, Vanguard, and State Street exploit scale to launch low-fee ESG index funds, yet face intensified scrutiny over proxy-voting choices that influence climate resolutions. Specialized managers such as Robeco and Calvert capture mandates from mission-driven institutions seeking impact-aligned outcomes beyond benchmark tracking. MSCI, Sustainalytics, and Bloomberg expand data coverage to meet granular regulatory disclosures, embedding application-programming interfaces that allow asset owners to customize factor weightings. FinTech entrants introduce tokenized sustainability instruments, facilitating fractional ownership and transparent audit trails that resonate with digital-native investors.
Large banks recalibrate ESG positioning: Bank of America, Citigroup, and Morgan Stanley withdrew from the Net-Zero Banking Alliance in January 2025, citing alignment constraints with evolving domestic policy. Nonetheless, these banks maintain individual net-zero commitments, suggesting that competitive differentiation now rests on proprietary frameworks rather than collective pledges. Technology adoption sets performance boundaries; MSCI deploys machine-learning classifiers that scan unstructured text for controversy signals, reducing manual analyst workloads and accelerating rating updates. White-space persists in biodiversity finance, where measurement standards lag and few incumbents possess credible taxonomic expertise. Overall, the ESG finance market earns a concentration score of 2 because no single cohort commands a decisive share and product innovation continues to attract diverse new entrants.
ESG Finance Industry Leaders
BlackRock, Inc.
Vanguard Group
State Street Global Advisors
UBS Group AG
BNP Paribas
- *Disclaimer: Major Players sorted in no particular order

Recent Industry Developments
- June 2025: STOXX and ICE partnered to launch climate-aligned fixed-income indices, strengthening analytic infrastructure for bond investors.
- May 2025: STOXX and ICE partnered to launch climate-aligned fixed-income indices, strengthening analytic infrastructure for bond investors.
- January 2025: Bank of America, Citigroup, and Morgan Stanley exited the Net-Zero Banking Alliance, indicating strategic recalibration amid changing U.S. policy priorities.
- December 2024: Fuze and Fils introduced the first digital-asset sustainability solution in the MENA region, integrating carbon-offset tracking into blockchain transactions.


Global ESG Finance Market Report Scope
The ESG finance market is segmented by investment type, transaction type, investor type, industry vertical, and region. By investment type, the market is segmented into equity, fixed income, mixed allocation, and others. By transaction type, the market is segmented into green bonds, social bonds, mixed sustainability bonds, ESG-integrated investment funds, and others. By investor type, the market is segmented into institutional investors and retail investors. By industry vertical, the market is utilities, transport & logistics, chemicals, food and beverage, government, and others, and by region, the market is segmented into North America, Latin America, Europe, Asia-Pacific, Middle East and Africa. The report offers market size and forecasts for the ESG finance market in value (USD) for all the above segments.
| Green Bonds |
| Sustainability-Linked Loans |
| ESG Equity Funds |
| ESG ETFs |
| Other Instruments |
| Institutional Investors |
| Retail Investors |
| Government / Public Institutions |
| Sovereign Wealth Funds |
| Environmental |
| Social |
| Governance |
| Integrated / Combined |
| Banks |
| Asset Managers |
| Insurers |
| Data & Rating Providers |
| FinTech Platforms |
| Advisory & Consulting Firms |
| North America | Canada |
| United States | |
| Mexico | |
| South America | Brazil |
| Peru | |
| Chile | |
| Argentina | |
| Rest of South America | |
| Europe | United Kingdom |
| Germany | |
| France | |
| Spain | |
| Italy | |
| BENELUX (Belgium, Netherlands, Luxembourg) | |
| NORDICS (Denmark, Finland, Iceland, Norway, Sweden) | |
| Rest of Europe | |
| Asia-Pacific | India |
| China | |
| Japan | |
| Australia | |
| South Korea | |
| South-East Asia | |
| Rest of Asia-Pacific | |
| Middle East and Africa | United Arab Emirates |
| Saudi Arabia | |
| South Africa | |
| Nigeria | |
| Rest of Middle East and Africa |
| By Financial Instrument | Green Bonds | |
| Sustainability-Linked Loans | ||
| ESG Equity Funds | ||
| ESG ETFs | ||
| Other Instruments | ||
| By Investor Type | Institutional Investors | |
| Retail Investors | ||
| Government / Public Institutions | ||
| Sovereign Wealth Funds | ||
| By ESG Theme | Environmental | |
| Social | ||
| Governance | ||
| Integrated / Combined | ||
| By Service Provider Type | Banks | |
| Asset Managers | ||
| Insurers | ||
| Data & Rating Providers | ||
| FinTech Platforms | ||
| Advisory & Consulting Firms | ||
| By Geography | North America | Canada |
| United States | ||
| Mexico | ||
| South America | Brazil | |
| Peru | ||
| Chile | ||
| Argentina | ||
| Rest of South America | ||
| Europe | United Kingdom | |
| Germany | ||
| France | ||
| Spain | ||
| Italy | ||
| BENELUX (Belgium, Netherlands, Luxembourg) | ||
| NORDICS (Denmark, Finland, Iceland, Norway, Sweden) | ||
| Rest of Europe | ||
| Asia-Pacific | India | |
| China | ||
| Japan | ||
| Australia | ||
| South Korea | ||
| South-East Asia | ||
| Rest of Asia-Pacific | ||
| Middle East and Africa | United Arab Emirates | |
| Saudi Arabia | ||
| South Africa | ||
| Nigeria | ||
| Rest of Middle East and Africa | ||


Key Questions Answered in the Report
What is the current size and expected growth of the ESG finance market?
The ESG finance market stands at USD 9.69 trillion in 2026 and is projected to rise to USD 16.5 trillion by 2031, reflecting an 11.24% CAGR.
Which financial instrument holds the largest share of ESG finance activity?
Green bonds lead the field, capturing 64.85% of the total ESG finance market share in 2025.
Which geographic region is growing the fastest in ESG finance?
Asia-Pacific is forecast to expand at a 13.18% CAGR through 2031, outpacing all other regions.
What primary driver is accelerating capital flows into ESG-aligned assets?
Mandatory sustainability disclosure requirements across major economies are steering
How significant is retail participation in the ESG finance market’s growth?
Retail investor activity is climbing at a 12.05% CAGR as digital wealth platforms lower entry barriers and embed ESG screening tools.
How concentrated is the ESG finance competitive landscape?
The top five players account for approximately one-fifth of ESG-linked assets, reflecting a concentrated market structure alongside significant fragmentation.
Page last updated on:


