
United States Car Loan Market Size and Share
Market Overview
| Study Period | 2020 - 2031 |
|---|---|
| Forecast Data Period | 2026 - 2031 |
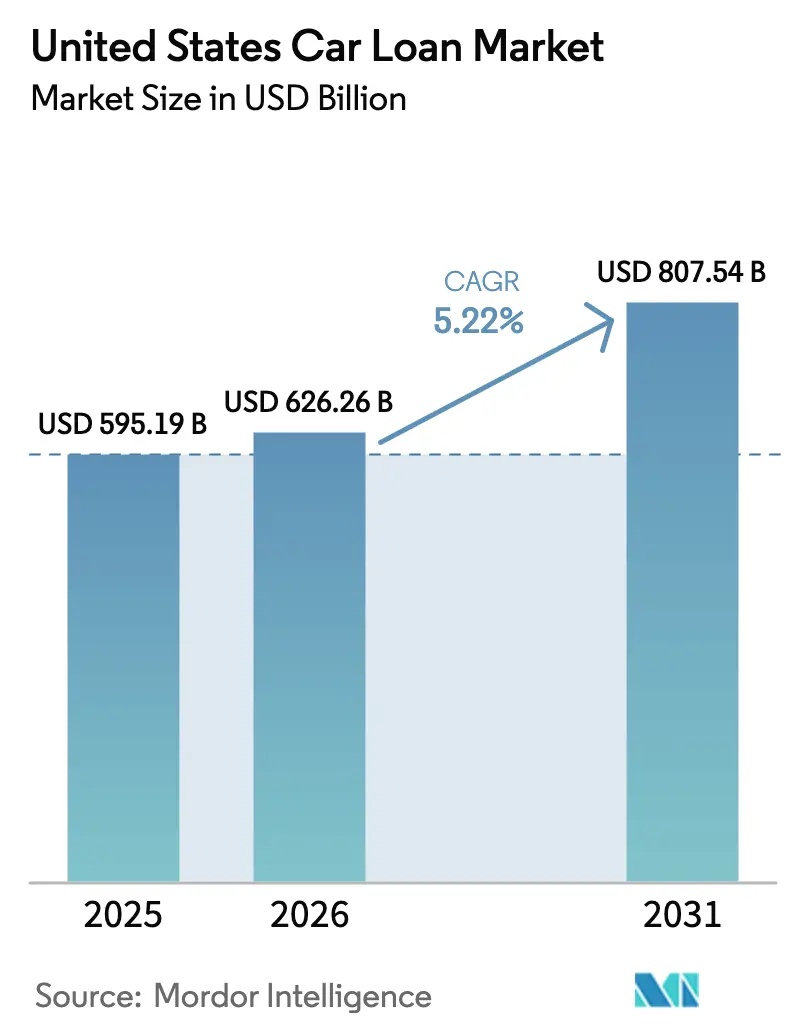
| Base Year Market Size (2025) | USD 595.19 Billion |
| Market Size (2026) | USD 626.26 Billion |
| Market Size (2031) | USD 807.54 Billion |
| Growth Rate (2026 - 2031) | 5.22 % |
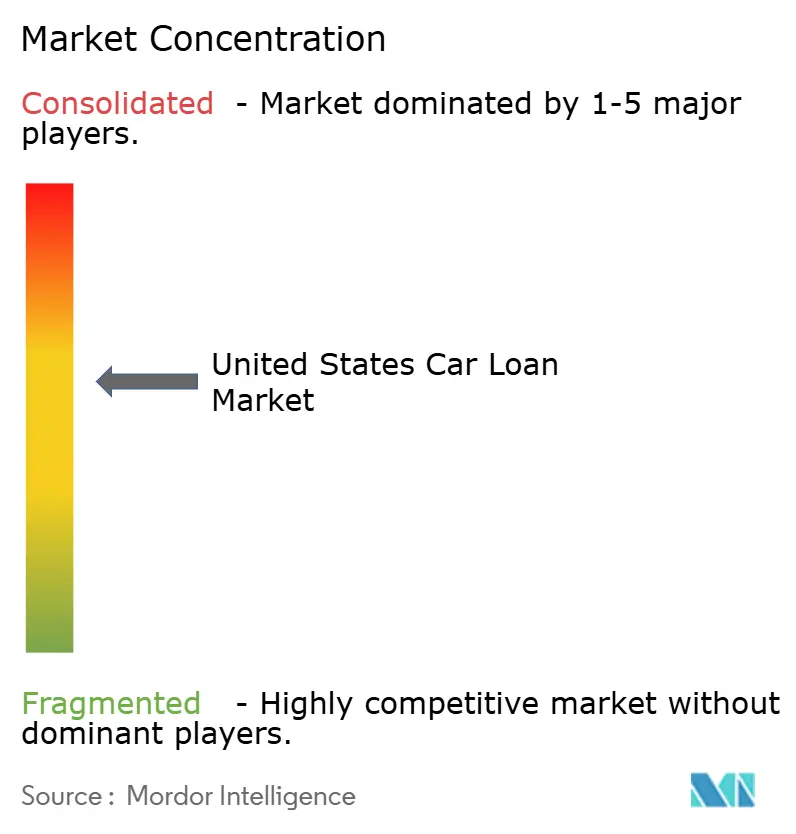
| Market Concentration | Medium |
Major Players *Disclaimer: Major Players sorted in no particular order Image © Mordor Intelligence. Reuse requires attribution under CC BY 4.0. | |
United States Car Loan Market Analysis by Mordor Intelligence
United States car loan market size in 2026 is estimated at USD 626.26 billion, growing from 2025 value of USD 595.19 billion with 2031 projections showing USD 807.54 billion, growing at 5.22% CAGR over 2026-2031. Sustained demand for passenger vehicles, the rapid shift toward digital origination, and expanding captive-lender programs underpin this growth. Artificial-intelligence underwriting is lifting approval rates for underserved borrowers and trimming processing costs, while federal and state incentives for electric vehicles (EVs) are lowering default risk and unlocking new product niches. Consolidation is accelerating across banks and fintechs as scale and data depth become decisive competitive advantages. On the risk side, sticky prime rates, rising delinquencies on ultra-long loans, and tightening capital rules compel lenders to refine pricing, shorten loan terms, and strengthen collections.
Key Report Takeaways
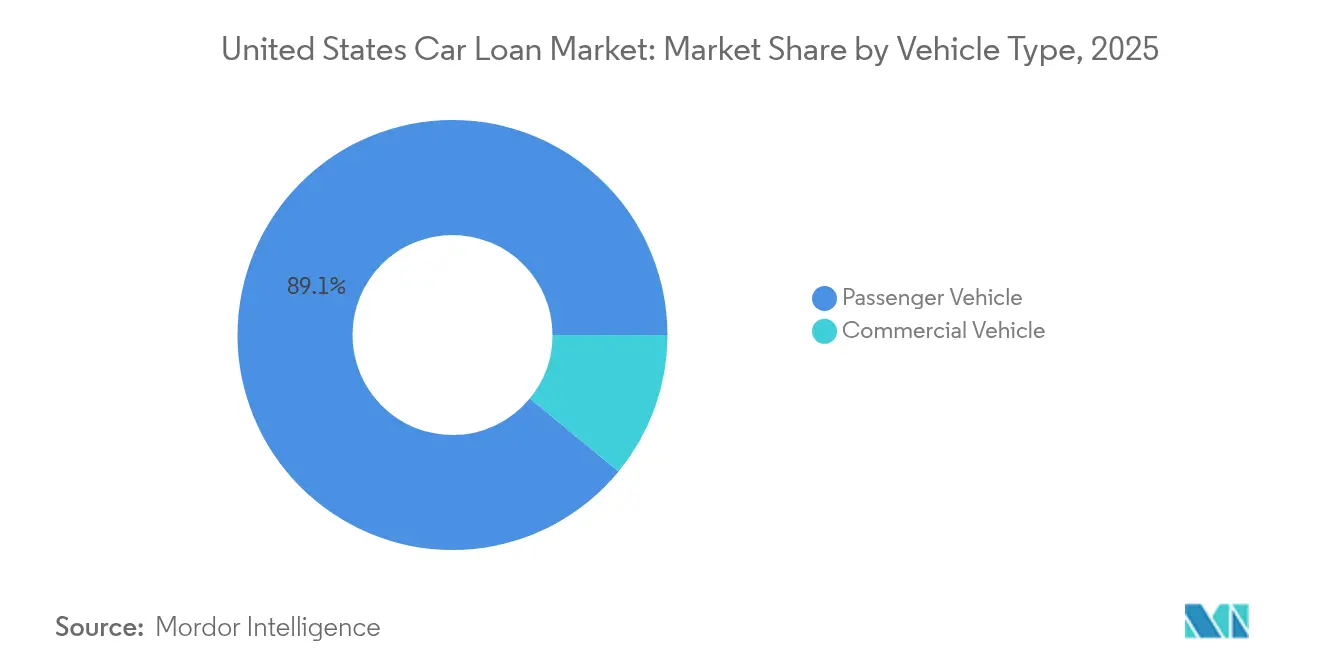
- By vehicle type, passenger vehicles led with an 89.05% share of the United States car loan market in 2025 and are projected to expand at a 5.69% CAGR through 2031.
- By ownership, used vehicles accounted for 62.35% of the United States car loan market share in 2025, and are forecasted to grow at a 6.45% CAGR to 2031.
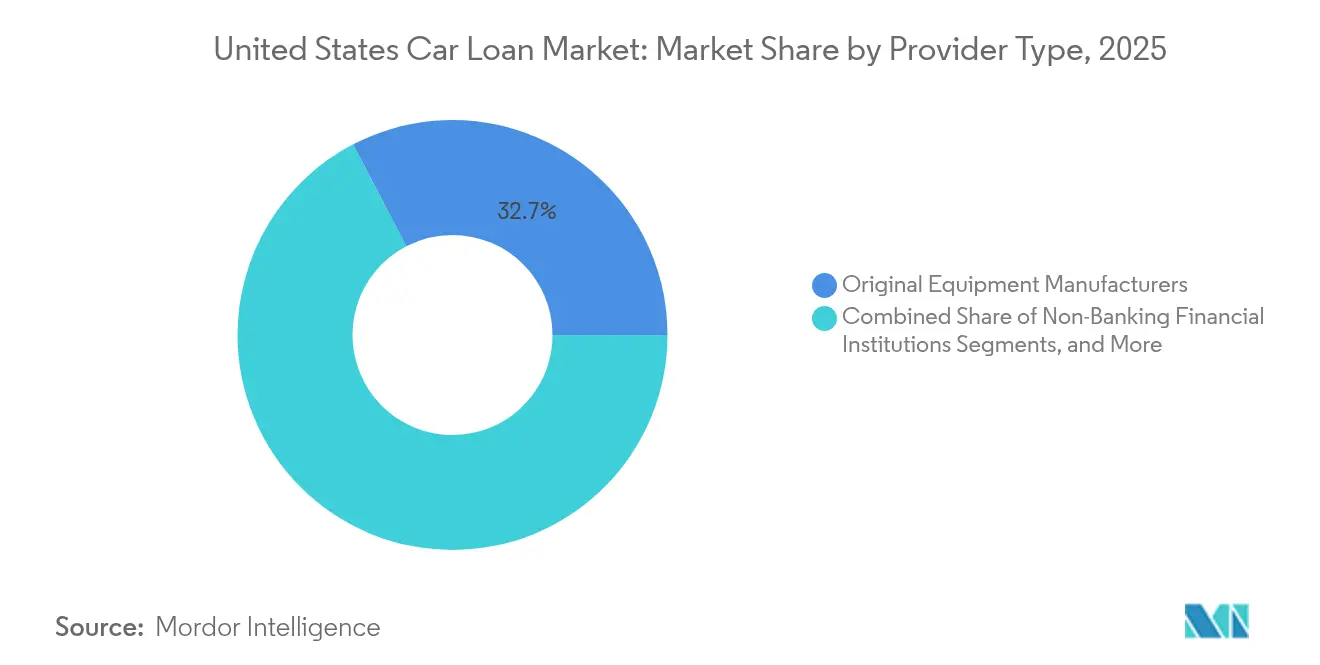
- By provider type, original equipment manufacturers held 32.65% of the United States car loan market in 2025; fintech lenders recorded the fastest 12.28% CAGR over 2026-2031.
- By tenure, loans longer than 5 years represented 52.70% of the United States car loan market size in 2025; loans shorter than 3 years are growing at a 6.85% CAGR.
Note: Market size and forecast figures in this report are generated using Mordor Intelligence’s proprietary estimation framework, updated with the latest available data and insights as of 2026.
India participates in a competitive field that extends beyond its own borders. The market landscape in the global car loan industry outlined by Mordor Intelligence covers that wider structure.
United States Car Loan Market Trends and Insights
Drivers Impact Analysis*
| Driver | (~) % Impact on CAGR Forecast | Geographic Relevance | Impact Timeline |
|---|---|---|---|
| Surge in captive-lender penetration post-inventory rebound | +0.8% | National, concentrated in OEM strongholds | Medium term (2-4 years) |
| Growing EV financing incentives & green-loan tax credits | +0.6% | National, early gains in California, Texas, Florida | Long term (≥ 4 years) |
| Digitization of loan origination & AI-driven underwriting | +0.9% | National, led by metropolitan areas | Short term (≤ 2 years) |
| Credit-union shift toward indirect auto lending | +0.4% | Regional, strongest in Midwest and Southeast | Medium term (2-4 years) |
| Used-car price volatility widening refinance volumes | +0.7% | National, amplified in high-cost coastal markets | Short term (≤ 2 years) |
| OEM subscription & buy-back guarantees lowering residual-value risk | +0.5% | National, pilot programs in urban centers | Long term (≥ 4 years) |
| Source: Mordor Intelligence | |||
Surge in captive-lender penetration post-inventory rebound
Captive finance arms regained momentum as dealership inventory normalized, allowing promotional APRs that drove their share of new-vehicle funding to 58% in Q3 2024. Ford Credit will deploy a data-driven insights platform in 2025 to sharpen pricing and retention. General Motors’ choice to pause a bank-charter pursuit lets GM Financial focus capital on rate-subsidized programs, sustaining its edge. Competitive pressure pushes banks and credit unions to differentiate through faster approval cycles rather than lower rates. As OEM inventories rise, captives can selectively scale back incentives, protecting margins while holding volume leadership.
Growing EV financing incentives & green-loan tax credits
Federal tax credits extended under the Inflation Reduction Act and layered state rebates cut effective borrowing costs for qualifying EV buyers[1]U.S. Department of Energy, “Alternative Fuels Data Center,” energy.gov. EV borrowers display 29% lower default probabilities and enjoy interest rates 2.2 percentage points below internal-combustion peers. Lenders now tailor products that reflect battery-warranty terms and charging-network density. Nonetheless, used-EV prices fell 31.8% in 2024, prompting stricter loan-to-value caps. Sophisticated risk models linking mileage, battery health, and regional resale data are becoming prerequisites to scale this segment nationwide.
Digitization of loan origination & AI-driven underwriting
Digital originations climbed 29% year over year, a record high, as consumers embraced end-to-end online workflows. AI-based pricing engines can lift lender profitability by 34% through granular risk segmentation while broadening access for prime-borderline applicants. CarGurus and Chase now provide pre-qualified rates across 9,000 dealerships, mirroring shopper preferences to secure financing at home. Moody’s purchase of Numerated underscores how incumbents embed automation to retain share. With digital adoption up 165% since 2020, lenders lacking real-time decision tools risk rapid disintermediation.
Credit-union shift toward indirect auto lending
Credit unions pivot toward dealer-originated contracts to offset a direct-lending slowdown, though the National Credit Union Administration stresses enhanced due diligence standards. OneAZ’s Credit Flex Auto Program, backed by Open Lending, shows how partnerships deliver near-prime reach while maintaining cooperative pricing advantages. Regional unions enjoy strong Midwest and Southeast membership bases but face technology-investment hurdles. Sophisticated unions leverage indirect channels to preserve relevance, yet compliance complexity may widen the capability gap versus larger peers.
Restraints Impact Analysis*
| Restraint | (~) % Impact on CAGR Forecast | Geographic Relevance | Impact Timeline |
|---|---|---|---|
| Sticky prime-rate environment elevating APRs | -1.2% | National, amplified in rate-sensitive markets | Short term (≤ 2 years) |
| Rising delinquency among long-term loans | -0.8% | National, concentrated in subprime segments | Medium term (2-4 years) |
| Higher capital-adequacy costs under Basel III endgame | -0.6% | National, banks >USD 100 billion assets | Medium term (2-4 years) |
| EV residual-value uncertainty pressuring loan-to-value caps | -0.4% | National, acute in EV-concentrated markets | Long term (≥ 4 years) |
| Source: Mordor Intelligence | |||
Sticky prime-rate environment elevating APRs
The Federal Reserve’s 4.25%–4.5% policy band keeps average new-car payments at USD 749, straining buyer budgets. Forecast easing to 7% auto APR by year-end offers marginal relief. Subprime consumers bear the brunt as lenders narrow credit boxes, pushing many toward buy-here-pay-here lots. Dealers see shrinking promotional-rate allocations from captives, especially on entry-level models. The ongoing rate plateau compresses dealer reserve spreads and prompts banks to chase super-prime borrowers, intensifying competitiveness at the high end while sidelining riskier segments.
Rising delinquency among long-term loans
Subprime 60-day delinquencies reached 6.56% in January 2025, five times the prime levels. Payment extensions are now issued to nearly 4% of subprime accounts versus 0.8% for prime borrowers, yet these often deepen negative equity. Over 10% of borrowers rolled in average negative equity of USD 5,073 on new vehicles, amplifying loss-given-default severity[2]Consumer Financial Protection Bureau, “Data Point: Vehicle Trade-in Equity,” consumerfinance.gov. Federal Reserve studies link higher payments directly to default probability, spotlighting structural weaknesses in ultra-long loans. Tighter underwriting for 84-month terms is spreading as lenders prioritize asset quality over volume.
*Our forecasts treat driver/restraint impacts as directional, not additive. The impact forecasts reflect baseline growth, mix effects, and variable interactions.
Segment Analysis
By Vehicle Type: Passenger vehicle financing sustains scale advantage
Passenger vehicles captured 89.05% share of the United States car loan market in 2025, with the segment poised to grow at a 5.69% CAGR over the forecast period. The United States car loan market benefits from standardized collateral, large dealer networks, and broad lender participation that compress spreads and support volume. Connected-car data is feeding new underwriting signals, helping captives tailor offers for loyalty and maintenance packages. Commercial-vehicle financing serves cyclical industries such as logistics and construction, demanding bespoke risk models and higher down-payment thresholds. Telematics adoption is lower among small fleets, but data-sharing mandates under the Infrastructure Investment and Jobs Act could equalize analytics quality. Passenger EV uptake accelerates data granularity, letting lenders track battery health and mileage in real time, further refining pricing.
Commercial financing growth trails the broader United States car loan market, yet margin potential remains attractive because line-haul trucks and last-mile vans carry higher ticket sizes and service revenues. Risk diverges by subsector; for-hire carriers correlate with freight indices, whereas municipal fleets present steadier cash flows. Banks leverage relationship accounts to win these deals, while fintech entrants focus on point-of-sale platforms targeting owner-operators. Collective experience suggests that default frequency is lower, but loss severity is higher due to asset depreciation curves. Thus, the commercialization of telematics and predictive maintenance data stands to reshape residual-value projections and securitization appetite over the forecast period.



By Ownership: Pre-owned segment leads value creation
Used-vehicle loans accounted for 62.35% of the United States car loan market in 2025 and are expanding at a 6.45% CAGR, above the overall United States car loan market. Buyers chase affordability as new-vehicle transaction prices remain elevated, and off-lease volumes inject late-model units with manufacturer warranties. Carvana’s Q1 2025 rebound highlighted consumer preference for digital, end-to-end purchasing, especially among near-prime shoppers. With 39% of all borrowers having negative equity, refinance activity centers on used-car portfolios where rate reductions can restore equity faster. EV depreciation raises caution; lenders set tighter 80% loan-to-value caps on three-year-old electrics versus 110% for comparable gasoline models.
New-vehicle lending, 37.65% of the United States car loan market size, relies on OEM-backed 0% APR events and loyalty rebates. Captives protect share through bundled service contracts that extend customer lifecycle value. However, Toyota’s pullback on incentives signals confidence that the supply-demand balance permits less aggressive financing. Fintech aggregators increasingly route prime borrowers directly to banks with instant approvals, eroding dealer finance penetration. As inventory normalizes, the used-to-new price gap should narrow, yet persistently high interest rates keep monthly payment spreads wide, preserving used-segment momentum.
By Provider Type: Technology reshapes competitive lines
Original-equipment financing arms held a 32.65% share of the United States car loan market in 2025, tapping proprietary customer and vehicle data to maintain underwriting precision. Banks compete on balance-sheet depth but suffer slower tech rollout, while fintechs outpace the market at a 12.28% CAGR by delivering frictionless interfaces and AI-driven approvals. TransUnion’s acquisition of Monevo underscores a data-network land-grab as credit marketplaces grow. Captives, meanwhile, prioritize customer lifetime value; Ford Credit’s analytics platform aims to upsell insurance and maintenance, extending wallet share.
Fintech lenders exploit cloud-native architecture to underwrite thin-file borrowers, charging risk-adjusted spreads that traditional players avoid. Partnerships proliferate; OneMain’s Foursight deal provides near-prime expansion without building new infrastructure. Banks counter by white-labeling digital origination portals to preserve dealer relationships. For investors, asset-backed securities backed by fintech pools attract demand due to granular performance data and rapid seasoning cycles, indicating growing institutional comfort with alternative underwriting frameworks.
By Tenure: Shorter maturities regain favor
Loans exceeding five years still commanded 52.70% of the United States car loan market in 2025, but face moderating demand as consumers weigh total-interest outlays. Median negative equity on 84-month loans was –USD 8,485, versus positive USD 7,783 on 36-month contracts, illustrating the drag of extended terms. The less than 3 years segment is the fastest-growing slice, advancing at a 6.85% CAGR. Lenders now embed tiered rate discounts, nudging borrowers toward quicker payoff schedules.
The United States car loan market size for the 3–5-year bracket remains resilient, balancing affordability and asset-life alignment. Subscription models also chip away at long-term loans by offering similar monthly costs with flexible exits. Banks and captives adjust residual curves accordingly, ensuring securitization pools remain within rating-agency tolerance. As monetary policy eases, lenders may ease pricing on shorter terms further, stimulating uptake among credit-aware consumers and bolstering portfolio health.
Geography Analysis
Regional dispersion within the United States car loan market reflects income differentials, regulatory regimes, and evolving mobility patterns. Coastal states, led by California and the Northeast corridor, register the highest average loan amounts due to elevated vehicle prices and early EV adoption that benefits from layered state rebates. These markets also exhibit stronger digital-originations penetration, reflecting higher broadband coverage and fintech density.
The Southeast and Texas corridors combine population influx and diversified manufacturing bases, sustaining robust loan demand across new and used segments. Credit-union penetration is notable in the Midwest, where cooperative traditions foster loyalty; the Federal Reserve notes credit-union consumer-credit share rose to 6% of nominal GDP. Midwest lenders now face heightened rivalry from national fintechs that bypass branch networks, expanding options for rural borrowers.
Mountain West and Plains regions display stable delinquency profiles tied to agricultural and energy cycles. Urban centers nationwide pilot subscription models; Autonomy’s Tesla program launched first in Los Angeles before spreading to Miami and Dallas. Conversely, rural buyers retain a preference for traditional ownership, though online portals increasingly service their financing needs. State privacy-law divergence remains a looming cost; Toyota Financial Services flagged the burden of managing 51 separate frameworks as lawmakers in 34 states weigh new standards. Lenders with centralized compliance teams are better positioned to absorb these hurdles, suggesting geography will continue to influence cost-to-serve and product design.
Mordor Intelligence provides coverage of the car loan market across other key regional markets, including Europe and Asia, each with their regulatory frameworks and demand patterns. Detailed country-level analysis extends to China, India, United Kingdom, Japan, France, Brazil, and Russia incorporating local coverage and market participation, as required.
Regulatory Landscape
United States auto lending operates under a layered framework spanning federal consumer-protection and banking rules and state enforcement. The Consumer Financial Protection Bureau (CFPB) signaled continued focus on fair lending, data accuracy, collections practices, and the use of AI in underwriting, and its 2026 regulatory agenda (released July 2026) included a planned Notice of Proposed Rulemaking in September 2026 addressing the definition of "larger participants" in the automobile financing market. This change could expand supervisory coverage for nonbank lenders and servicers.
State activity adds further compliance complexity for national platforms and dealer-linked origination. California's CARS Act is slated to take effect in October 2026, introducing consumer-protection requirements at the state level following the vacatur of the federal FTC CARS Rule. Other states have strengthened unfair-or-deceptive-practices enforcement tools (for example, New York's FAIR Business Practices Act), increasing scrutiny of advertising, optional-product add-ons, and servicing conduct across indirect and digital channels.
Value Chain Analysis
The United States car loan value chain begins with vehicle purchase and lead generation (OEM websites, marketplaces, and dealer networks) and then moves to origination through captives, banks, credit unions, and independent/fintech lenders using direct-to-consumer and indirect (dealer) channels. As of March 2026, captives and banks represented similarly large pools of outstanding auto debt (about USD 530 billion at captives versus USD 529 billion at banks), underscoring the role of both OEM-linked incentive financing and balance-sheet lenders in shaping pricing and underwriting norms.
Enablement and monetization layers sit behind origination and servicing. Dealers and lenders rely on loan origination systems, credit decisioning and fraud controls that pull bureau data (Equifax, Experian, and TransUnion) via integrated APIs for real-time credit retrieval, and servicing platforms that manage billing, collections, extensions, and recoveries. Funding and risk transfer complete the chain through warehouse lines and securitization, where loan performance data, collateral valuation (including used-vehicle volatility), and term structure (notably loans longer than five years) influence advance rates, pricing, and investor appetite.
Competitive Landscape
The United States car loan market features moderate concentration, with the top providers controlling a considerable share of the market. Captive lenders dominate new-car funding, while fintech platforms and credit unions carve niches in used and near-prime segments. Traditional banks juggle balance-sheet strength with rising technology costs. Consolidation defines strategic moves: Capital One’s USD 35.3 billion acquisition of Discover creates scale in payments and auto portfolios, signaling an arms race for data and network breadth.
Technology is the primary competitive lever. AI engines that slice risk pools into micro-segments promise 34% higher profitability. Moody’s purchase of Numerated secures origination IP critical for bank clients integrating automation. Subscription offerings pose a longer-term channel threat by bypassing financing altogether, prompting captives to experiment with bundled mobility packages.
EV financing represents a white-space opportunity. Lower default rates and policy incentives attract lenders, yet residual-value volatility demands battery analytics and conservative advance rates. Credit unions seek indirect-lending alliances to regain relevance, but compliance overhead could accelerate attrition among smaller institutions. Overall, the market rewards scale, data science, and agile compliance postures.
United States Car Loan Industry Leaders
Ally Financial Inc.
Bank of America Corp.
Toyota Financial Services
Capital One Financial Corp.
Ford Motor Credit Co.
- *Disclaimer: Major Players sorted in no particular order

Market Opportunities and Future Outlook
Refinance and payment-relief products offer a near-term whitespace as rate-sensitive borrowers seek cash-flow improvement and lenders look for lower-cost balances with fresh underwriting. Evidence of rising refinance activity in early 2026 (with Q1 2026 refinanced loans showing average monthly savings of USD 81) supports opportunities for banks, credit unions, and fintech marketplaces to expand retention offers, portfolio recapture, and dealer-enabled refinance workflows. Demand is particularly concentrated in used-vehicle heavy portfolios where negative equity and payment stress are more prevalent.
Data-driven segmentation and compliant AI underwriting also create opportunity, but implementation depends on governance as regulators emphasize data accuracy, fair lending, and model risk management. With total outstanding auto debt around USD 1.7 trillion as of March 2026 and super-prime borrowers accounting for a majority of originations (50.9% of loans and 65.6% of leases in early 2026), lenders are investing in decisioning, verification, and servicing analytics to defend prime share while selectively addressing near-prime and subprime pockets (which comprised 22.4% of total auto debt) through structured programs, tighter term controls, and improved collections strategies.
Recent Industry Developments
- May 2026: Ally Financial unveiled the Life Today brand platform and marketing campaign to position the company as a financial partner for consumer saving and spending needs. The launch shapes consumer engagement in auto financing by signaling a digital first identity and broadening cross-sell opportunities to prime and near-prime borrowers.
- April 2026: Ally Financial reported first quarter 2026 results including $11.5 billion in consumer auto originations, with 41% of originations in the highest credit quality tier. The campaign strengthens digital-first origination and consumer-facing positioning to capture prime and near-prime auto lending demand.
- January 2026: Bank of America announced a multi-year extension of its strategic relationship with Volvo Car Financial Services to provide auto loan and lease origination, financing, and servicing for U.S. retailers and customers through 2030. The partnership strengthens captive lender ecosystem and funding channels, maintaining scale and collaboration across Volvo’s lending and servicing operations to support loan volumes and network breadth.


Research Methodology Framework and Report Scope
Market Definition and Coverage
This market covers the outstanding value of car loans in the United States that finance the purchase of passenger and commercial vehicles, across both new and used vehicles, and across lender types that originate and hold these loans.
Scope exclusions: We exclude vehicle leasing receivables, unsecured personal loans used informally for vehicle purchases, and dealer fees or insurance products that are bundled but not part of the loan balance.
Segmentation Overview
- By Vehicle Type
- Passenger Vehicle
- Commercial Vehicle
- By Ownership
- New Vehicles
- Used Vehicles
- By Provider Type
- Banks
- Non-Banking Financial Institutions
- Original Equipment Manufacturers
- Other Provider Types (Fintech Companies)
- By Tenure
- Less than 3 Years
- 3-5 Years
- More than 5 years
Data Sources, Market Sizing, and Validation
Desk Research
Desk research was used to set the starting facts and boundaries before the model was built. We leaned on public sources that show how the auto credit pool is behaving and how vehicle demand is shifting, including Federal Reserve consumer credit and rate series, Federal Reserve Bank of New York household debt and delinquency tracking, the Consumer Financial Protection Bureau for supervision context and market observations, and U.S. Bureau of Economic Analysis plus U.S. Bureau of Labor Statistics series for income and inflation context.
To make the numbers usable for sizing, the public series were aligned with lender disclosures and industry reporting, including SEC filings and earnings decks from listed lenders, plus association and regulator publications. We also reviewed reputable press coverage on underwriting and term trends. Where needed, paid subscriptions for company financials and intelligence were used, alongside selective shipment-level import and export checks for related vehicle-flow signals, to cross-check lender mix and product shifts. The desk source list here is illustrative, and many other public and proprietary references were reviewed for data collection, validation, and clarification.
Primary Interviews and Surveys
Primary work was run to pressure-test the desk assumptions and to convert broad indicators into market-ready inputs. We spoke with lenders, dealer finance teams, loan servicing and collections specialists, and risk leaders to confirm changes in approval rates, pricing spreads, and how new versus used financing is being treated. Because this is a United States-only market, coverage focused on major state-level demand pockets and credit tiers, so differences in delinquencies, rate sensitivity, and term preference were not averaged away.
Distribution of primary research fieldwork respondents
| Company type | Respondent position |
|---|---|
| Top tier: 29% | CXOs: 13% |
| Mid tier: 50% | Functional/Unit leaders: 38% |
| Smaller Players: 21% | Managers: 49% |
Market-Sizing & Forecasting
Sizing was built using a top-down reconstruction of the United States car loan balance pool, where consumer credit balance trends are translated into auto-loan totals using lender mix and product structure checks. Once the total was shaped, it was corroborated with selective bottom-up approximations using sampled lender portfolio disclosures, typical average loan amount ranges, and estimated financed unit volumes from new and used vehicle activity.
A few inputs that mattered in this market model included benchmark interest rates and observed pricing spreads by credit tier, new versus used financing shares, average loan amount and loan-to-value movement, average term length shifts (including 72 to 84 months), and delinquency direction, which signals tightening or easing. Where a lender category did not disclose enough detail, gaps were handled through peer proxy ratios and then adjusted after follow-up checks with lender and dealer finance respondents.
For forecasting, scenario analysis was used so rate paths, vehicle demand normalization, and underwriting tightness could be flexed in a controlled way. The final run was selected based on what interviewees viewed as the most probable credit cycle. The year-by-year curve was also checked against affordability signals like payment levels and income growth so the trajectory stayed realistic.
Data Validation & Update Cycle
Outputs were validated through a step-by-step set of checks before sign-off. We compared model totals against independent signals such as consumer credit aggregates, lender portfolio growth commentary, and delinquency trend direction, and then investigated any variance that did not match the wider credit picture.
A second analyst review was used to re-check definitions, math consistency, and year-to-year movements, and re-contact was triggered when a key assumption moved outside the range supported by interviews. Reports are refreshed annually, with interim updates when major policy, rate, or credit events materially change origination appetite or portfolio performance. Before delivery, a final update pass is completed so clients receive the latest view consistent with the stated scope.
Mordor Intelligence's United States Car Loan Market Sizing Compared With Other Published Estimates
Published market values for car loans can look far apart even when the topic sounds the same, since the counting method and what is being measured are not always aligned. Differences usually come from whether the estimate tracks outstanding loan balances versus annual originations, whether leases are blended in, and how new and used financing are treated when disclosure is partial.
In practice, the bigger gaps come from mixing flow and stock metrics and from applying aggressive average loan amount growth when rates stay elevated. Some estimates also convert from vehicle sales to financed value using a single financing penetration rate, which can miss shifts in credit tier mix and longer-term adoption. The baseline here stays tied to outstanding balances by excluding lease receivables, and by re-checking lender mix and delinquency movement close to publication, which is where the refresh cadence and validation steps differ for Mordor Intelligence.
Benchmark comparison
| Source | Market Size | Gaps in Research Methodology |
|---|---|---|
| Mordor Intelligence | USD 595.19 B (2025) | |
| Industry Analytics Firm A | USD 650.00 B (2025) | This figure appears to include auto lease receivables along with loans, which lifts totals in periods when leasing share rises. It also uses a blended average balance per account that can overstate value when used-vehicle loan sizes soften. |
| Financial Data Publisher B | USD 185.00 B (2024) | This number is closer to annual origination value than outstanding balances, so it will read much smaller by design. The method also seems to apply a single financed-unit conversion from vehicle sales without fully adjusting for credit tier pullbacks and refinancing contraction. |
Looking across the three figures, the spread mostly comes from mixing outstanding balances with yearly origination flow, and from whether leases are counted as part of the credit pool. When scope and units are kept consistent and the inputs are tied to observable balance trends, lender mix, and term structure, the resulting market value is easier to trace and repeat year to year.


Key Questions Answered in the Report
What is the current value of the United States car loan market?
The market is valued at USD 626.26 billion in 2026, with a projected rise to USD 807.54 billion by 2031.
Which vehicle category attracts the most financing?
Passenger vehicles dominate, securing 89.05% market share in 2025 due to their broad consumer appeal.
Why are used-vehicle loans growing faster than new-vehicle loans?
Used vehicles captured 62.35% of the market share in 2025 and are projected to grow at a 6.45% CAGR because affordability pressures remain high and off-lease supply is plentiful.
How are rising delinquencies affecting lenders?
Delinquencies on 84-month loans, particularly among subprime borrowers, push lenders to tighten underwriting and favor shorter terms to control risk.
What role do fintech companies play in auto finance?
Fintech lenders expand market reach with digital origination and AI underwriting, advancing at a 12.28% CAGR and challenging traditional banks.
How is EV adoption influencing auto-loan products?
EV borrowers show 29% lower default rates and qualify for lower rates, but lenders adjust loan-to-value caps to manage uncertain residual values.
Page last updated on:





