Calcium Propionate Market Size and Share
Market Overview
| Study Period | 2021 - 2031 |
|---|---|
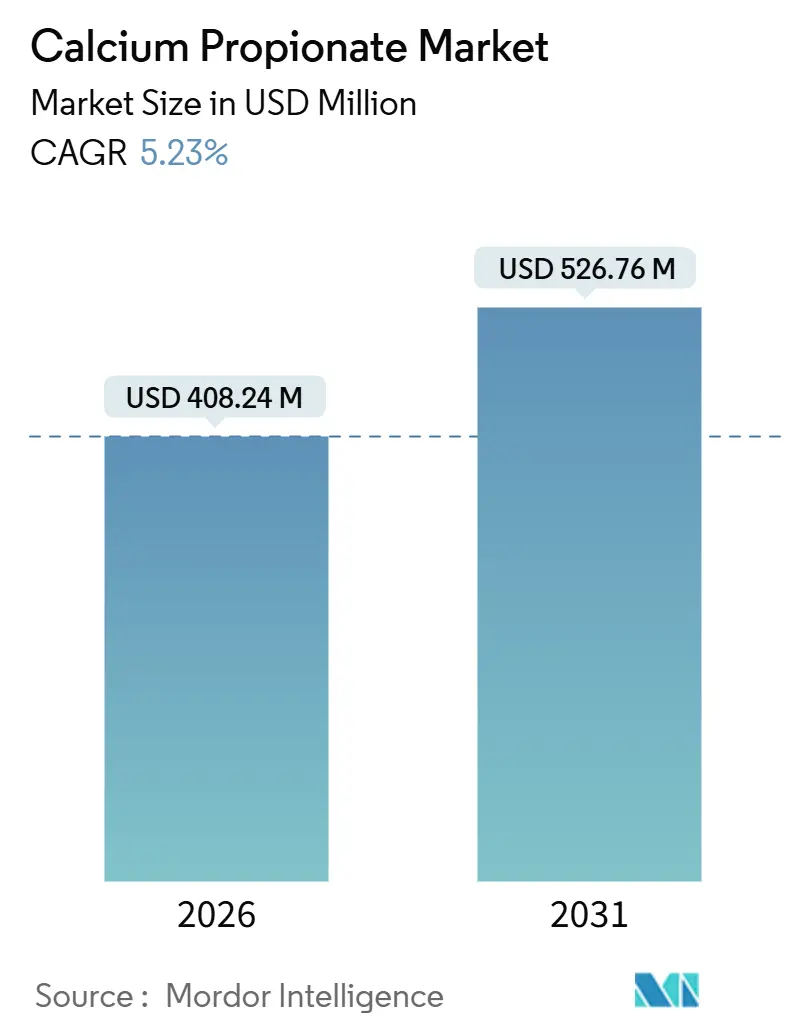
| Market Size (2026) | USD 408.24 Million |
| Market Size (2031) | USD 526.76 Million |
| Growth Rate (2026 - 2031) | 5.23% CAGR |
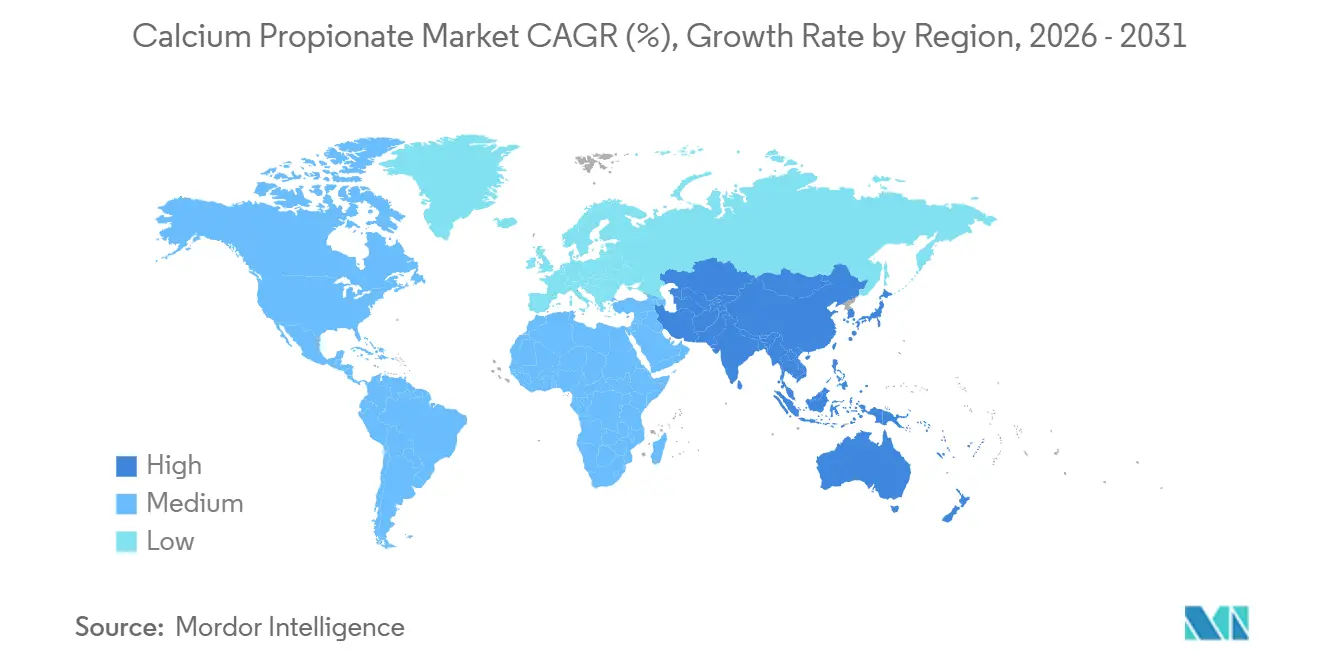
| Fastest Growing Market | Asia-Pacific |
| Largest Market | North America |
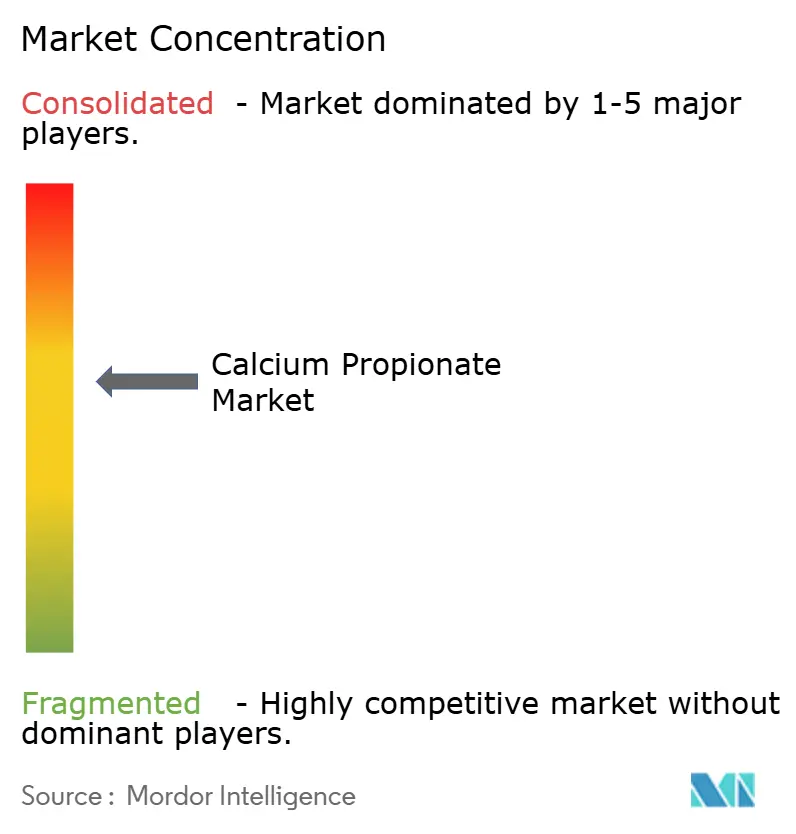
| Market Concentration | Medium |
Major Players *Disclaimer: Major Players sorted in no particular order Image © Mordor Intelligence. Reuse requires attribution under CC BY 4.0. | |
Calcium Propionate Market Analysis by Mordor Intelligence
The Calcium Propionate Market size is estimated at USD 408.24 million in 2026, and is expected to reach USD 526.76 million by 2031, at a CAGR of 5.23% during the forecast period (2026-2031). Momentum rests on industrial bakeries and feed producers that balance longer shelf life with demand for cleaner labels, cost-effective preservation and consistent regulatory acceptance across regions. Dry form, valued for proven handling economics, retained 65.22% revenue share in 2025, while liquid/suspension will expand at 5.68% CAGR thanks to precision-dosing systems in automated bakery lines and aquaculture feed mills. Food-grade dominated with 71.12% of 2025 sales, yet pharmaceutical grade is the fastest mover at 6.24% CAGR as film-coated excipients mask the salt’s inherent odor in tablets. Regionally, North America contributed 40.23% of 2025 revenue due to U.S. bakery chain demand and long-standing FDA GRAS status, whereas Asia-Pacific is accelerating at 5.98% CAGR following China’s GB 2760-2024 standard that harmonizes allowable use levels and simplifies nationwide formulations. Supply-side consolidation by BASF-YPC and Perstorp, plus emerging bio-based propionic acid routes, is reshaping competitive strategies even as feedstock cost volatility continues to squeeze margins for smaller producers.
Key Report Takeaways
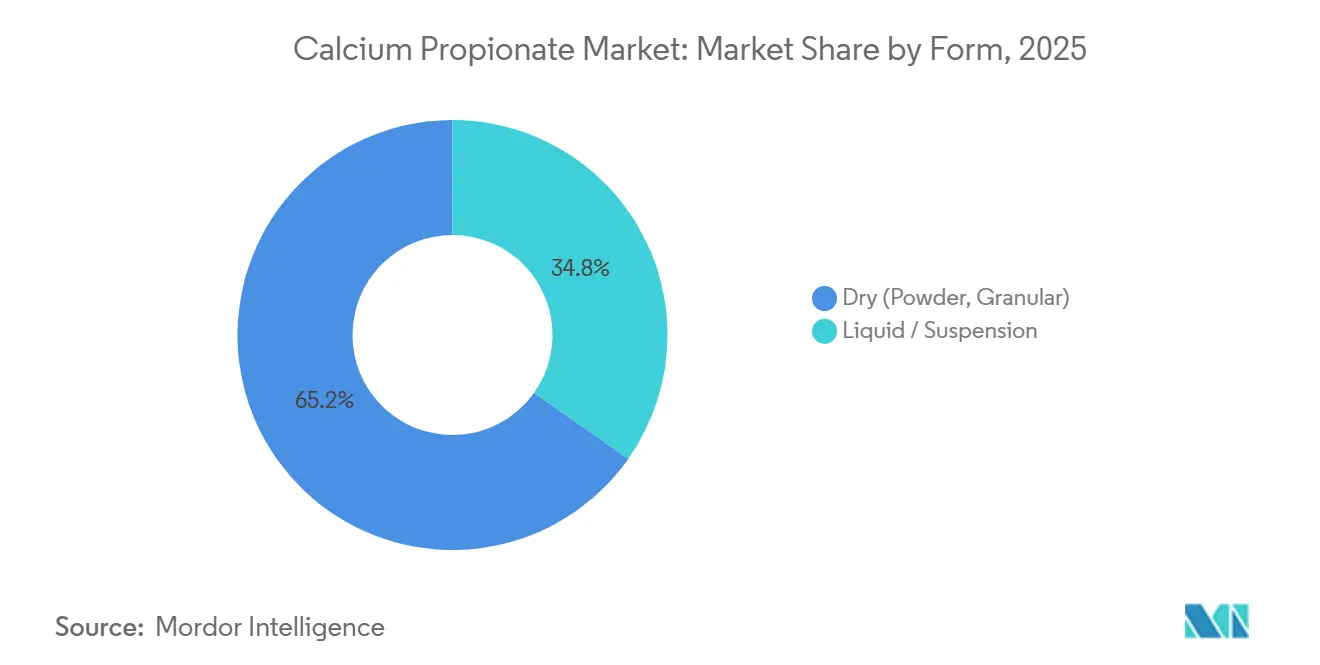
- By form, dry held 65.22% of calcium propionate market share in 2025, whereas liquid/suspension will grow fastest at a 5.68% CAGR to 2031.
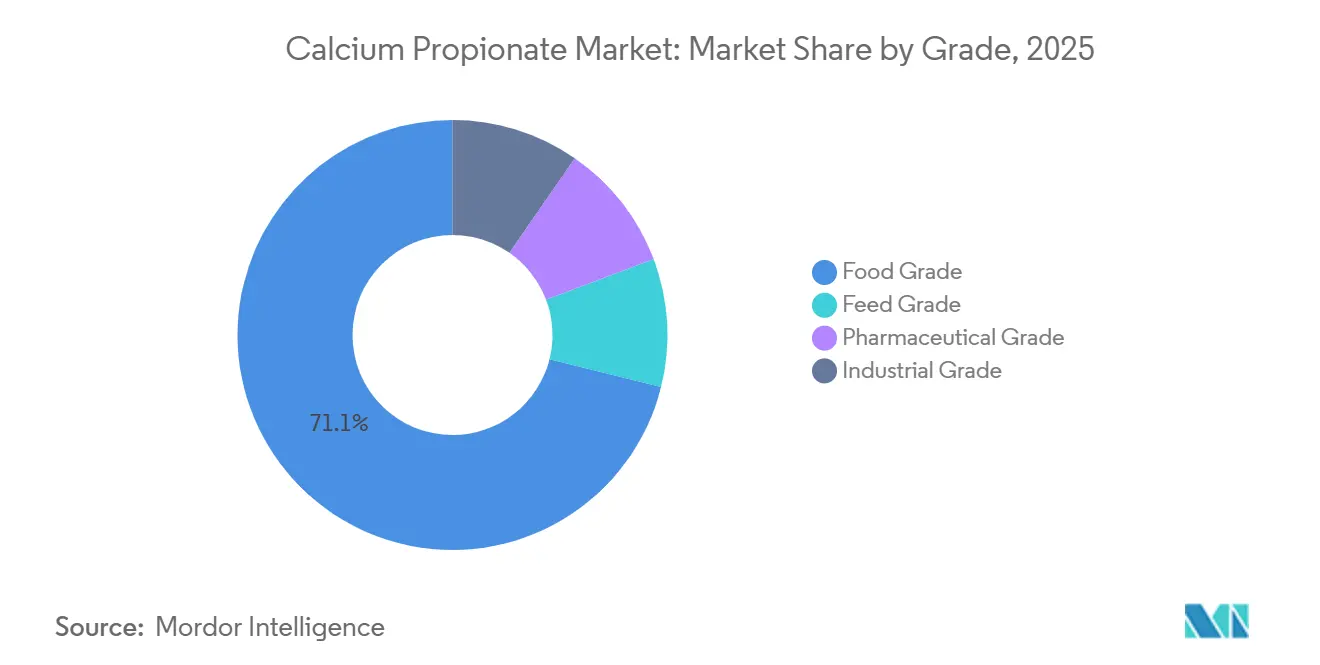
- By grade, food-grade captured 71.12% revenue share in 2025; pharmaceutical grade is on track to register a 6.24% CAGR through 2031.
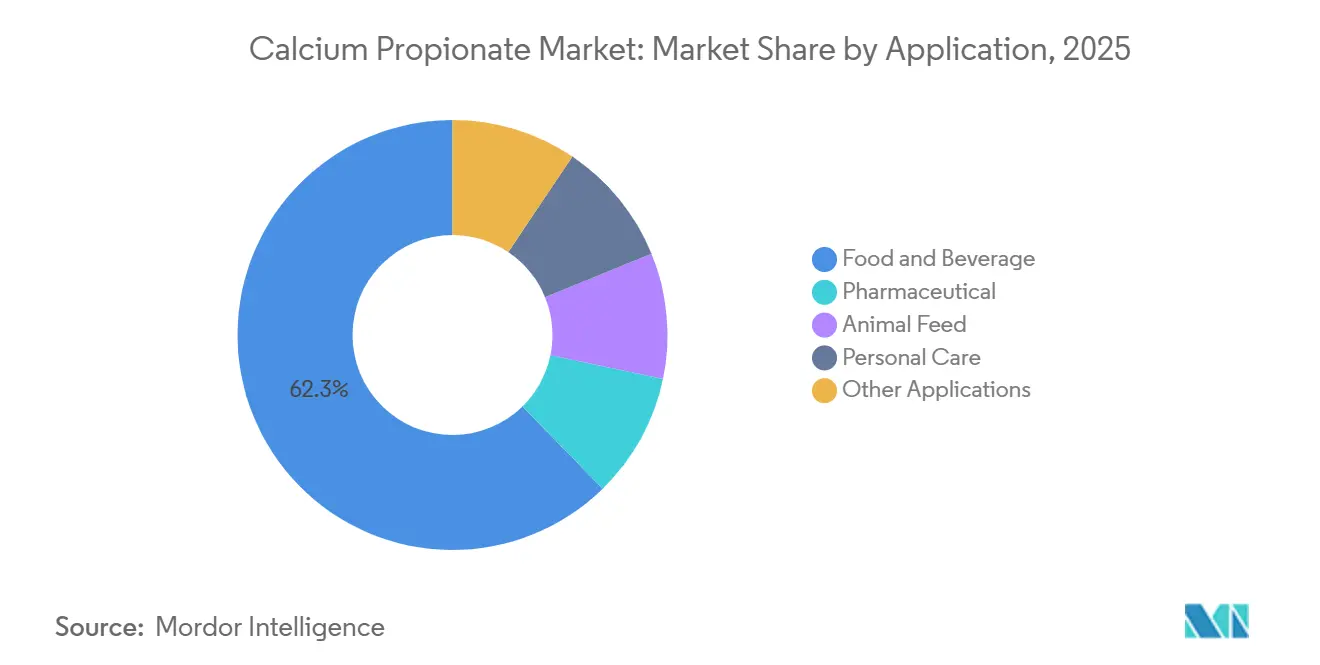
- By application, food and beverage led with 62.34% share in 2025, while animal feed is poised to expand at a 5.89% CAGR during 2026-2031.
- By geography, North America commanded 40.23% revenue in 2025; Asia-Pacific is the quickest regionally with a 5.98% CAGR set to 2031.
Note: Market size and forecast figures in this report are generated using Mordor Intelligence’s proprietary estimation framework, updated with the latest available data and insights as of January 2026.
Global Calcium Propionate Market Trends and Insights
Drivers Impact Analysis*
| Driver | (~) % Impact on CAGR Forecast | Geographic Relevance | Impact Timeline |
|---|---|---|---|
| Industrial-Scale Asia-Pacific Bakeries Raising Mold-Inhibitor Uptake | +1.4% | China, India, ASEAN core, spill-over to South Korea and Japan | Medium term (2-4 years) |
| European Union Approval in Aquaculture Diets Widens Feed Demand | +0.9% | Europe (primary), North America (secondary adoption) | Long term (≥ 4 years) |
| GCC Convenience-Food Retail Boom Requiring Longer Shelf Life | +0.7% | Saudi Arabia, UAE, Qatar, Kuwait, Bahrain, Oman | Short term (≤ 2 years) |
| Electro-Synthetic Bio-Based Propionic Acid Routes Lowering Scope-3 Emissions | +1.1% | Global, with early adoption in EU and North America | Long term (≥ 4 years) |
| Micro-Encapsulated Calcium Propionate Enabling pH-neutral "No-Off-Taste" Dairy | +0.8% | North America, Europe, premium dairy segments in Asia-Pacific | Medium term (2-4 years) |
| Source: Mordor Intelligence | |||
Industrial-Scale Asia-Pacific Bakeries Raising Mold-Inhibitor Uptake
China’s GB 2760-2024 permits up to 2.5 g/kg calcium propionate in bread and pastries, eliminating regional inconsistencies and enabling national bakeries to aggregate volume and cut preservative costs by about 15%. BASF-YPC’s 69,000-tonne-per-year Nanjing facility underpins robust local supply for both food and feed uses. India’s Food Safety and Standards Authority maintains allowances under the Prevention of Food Adulteration Act, yet periodic reviews encourage multinational producers to diversify formulations. Within ASEAN, Indonesia and Vietnam align with Codex guidelines, whereas Thailand’s strict labeling has prompted premium bakeries to trial fermented replacements. The net outcome is heightened baseline demand in mainstream segments of the calcium propionate market even while boutique brands pivot to natural claims.
European Union Approval in Aquaculture Diets Widens Feed Demand
EFSA’s October 2024 renewal for propionic acid and its salts through 2034 reassures feed-mill investors, particularly in Norway, Scotland and Spain where automated liquid-dosing systems favor suspensions over powders[1]European Food Safety Authority, “Opinion on Propionic Acid in Feed,” efsa.europa.eu. Perstorp’s Castellanza expansion aligns capacity with anticipated aquafeed uptake. Water-solubility ensures uniform dispersion in shrimp and fish pellets stored in humid coastal climates, reducing aflatoxin risk. Long shelf life and proven safety support steady growth for feed-grade volumes inside the calcium propionate market. North American aquaculture players continue to monitor FDA guidance on residue limits, but European clarity already drives capital commitments.
GCC Convenience-Food Retail Boom Requiring Longer Shelf Life
Gulf Cooperation Council countries import over 85% of baked goods and routinely operate supply chains in 40 °C ambient temperatures, necessitating higher dosages of 0.3–0.4% calcium propionate to achieve 30-day shelf life. Codex-aligned regulations in Saudi Arabia and UAE ease use, whereas consumer focus remains on safety and freshness rather than natural credentials. Kerry’s ProBake range leverages crystalline and suspension variants tailored for high-heat stability and quick dissolution. Demand is price-inelastic because mold incidents carry greater reputational risk than additive perception. Growing tourism and convenience retail hubs transform the GCC into one of the more resilient demand pockets for the calcium propionate market.
Electro-Synthetic Bio-Based Propionic Acid Routes Lowering Scope-3 Emissions
Pilot-scale electrochemical conversion of biomass intermediates to propionic acid promises carbon-intensity reductions of 35-40% versus petrochemical oxidation routes, fitting well with Europe’s Carbon Border Adjustment Mechanism, which is due to start in 2026. BASF’s eco-efficiency studies positioned propionic acid preservation as less energy-intensive than grain drying, supporting broader corporate net-zero roadmaps. Corbion’s Thailand lactic acid complex and fermentation know-how set the stage for hybrid preservative blends that pair bio-based acids with calcium salts. Early adopters among multinational food brands are willing to pay 5-10% premiums for verified low-carbon material, elevating differentiation prospects in the calcium propionate market.
Restraints Impact Analysis*
| Restraint | (~) % Impact on CAGR Forecast | Geographic Relevance | Impact Timeline |
|---|---|---|---|
| Rising Demand for Preservative-Free Foods | -1.2% | North America, Europe, premium segments in Asia-Pacific | Short term (≤ 2 years) |
| Feedstock (Propylene/Acid) Price Volatility Squeezing Margins | -0.8% | Global, with acute impact in Asia-Pacific and Europe | Medium term (2-4 years) |
| Surge in Fermented Mold-Inhibitors Cannibalising Synthetics in Asia-Pacific | -1.0% | China, Japan, South Korea, ASEAN premium bakery channels | Medium term (2-4 years) |
| Source: Mordor Intelligence | |||
Rising Demand for Preservative-Free Foods
Clean-label positioning has migrated from niche to mainstream, pressuring synthetic additives in fresh bakery and dairy aisles. Cultured dextrose, wheat and buffered vinegar systems from Corbion offer dosage parity at modest price premiums and now compete head-to-head in premium loaf bread and artisan buns. Sunson Biotechnology’s NaturalGARD line carries propionic acid levels above 40% and achieves 2:1 replacement efficiency compared with synthetic calcium propionate, improving taste perception in up-market patisserie. European and North American retailers increasingly request “no artificial preservatives” panels, diverting a share of value toward fermented alternatives even as conventional brands protect volume through price and broad distribution.
Feedstock Price Volatility Squeezing Margins
Propionic acid derives largely from propylene oxidation, tying costs to petrochemical swings. BASF enacted price hikes across regions in late 2020 when propylene rallied, exposing how thin EBITDA margins can erode for non-integrated formulators. New carbon costs in the EU-ETS and future CBAM duties raise delivered expenses for fossil-based chemicals, giving integrated players such as BASF-YPC and Perstorp a cushion while regional toll manufacturers face compression. Forward integration into propionic acid or diversification into fermentation routes is thus becoming critical to strategic resilience in the calcium propionate market.
*Our forecasts treat driver/restraint impacts as directional, not additive. The impact forecasts reflect baseline growth, mix effects, and variable interactions.
Segment Analysis
By Form: Liquid Suspensions Build Momentum in Automated Facilities
Liquid/suspension will outpace the overall calcium propionate market at 5.68% CAGR between 2026 and 2031, propelled by industrial bakeries that run high-speed dough mixers and value automated pipe-fed dosing over manual bag tipping. Dry (powder, granular) still captured 65.22% of 2025 revenue because they travel well, suit batch mixing and offer long shelf life without refrigeration. Yet as bakery complexes scale past 10,000 loaves per hour, uniform preservative dispersion becomes mission-critical: liquids cut localized mold recalls and shave 20–30% off labor, justifying investment in corrosion-resistant tanks.
Dry powders will keep hold in small and mid-size bakeries and feed mills that cannot justify extra capex. Granular variants also remain relevant for tablet-coating and feed-pellet lines where controlled flowability determines dosing accuracy. The rising popularity of encapsulated powders that hide off-tastes in dairy illustrates how form diversification supports niche gains.


By Grade: Pharmaceutical Purity Spurs High-Value Growth
Food-grade accounted for 71.12% of 2025 revenue, underpinned by global GRAS and Codex approvals that enable broad application in bread, cheese and processed meat. In contrast, pharmaceutical grade calcium propionate will expand at 6.24% CAGR owing to higher purity (more than 99%) and stringent heavy-metal limits that support film-coated tablets distributed in humid climates. Feed-grade enjoys EFSA renewal through 2034 for silage and aquafeed uses and will track broader livestock expansion, especially in Asia-Pacific.
Industrial-grade remains a niche consumed in construction admixtures and water-based coatings. Nonetheless, rising net-zero commitments place emphasis on lower-carbon precursors, elevating bio-based pharmaceutical and food grades within the wider calcium propionate market. Pricing disparities—USD 4–6/kg for pharma versus USD 2–3/kg for food grade—create ample margin room that supports dedicated production lines even at smaller volumes.

By Application: Feed Gains Traction as Food Faces Clean-Label Shifts
Food and beverage led with 62.34% revenue share in 2025 as sliced bread, sweet pastries and processed cheese rely on proven mold inhibition at modest dose levels. Yet animal feed is forecast to outgrow food at a 5.89% CAGR, powered by aquaculture in Europe and expanding pork and poultry sectors in China and India. Granular or liquid calcium propionate provides an easy-to-dose, water-soluble means to prevent mycotoxins in grain and silage, reinforcing safety throughout the feed chain.
Pharmaceutical uses, while smaller in tonnage, draw premium pricing and immunity from consumer ingredient backlash. Personal care remains emergent but illustrates diversification potential. Taken together, the calcium propionate market size for feed is expected to grow, closing the gap with food even as bakery formulators test fermented alternatives.
Geography Analysis
North America retained 40.23% revenue in 2025 on the strength of long-shelf-life sliced bread and buns, all protected by FDA-affirmed GRAS status under 21 CFR 184.1221[2]U.S. Food and Drug Administration, “21 CFR 184.1221 Calcium Propionate,” fda.gov . The U.S. market shows early signs of clean-label drift, pressing some premium bakeries toward cultured vinegar; yet price-sensitive mainstream brands hold to synthetic salts, protecting tonnage. Canada’s boutique bakers accelerate natural transitions, whereas Mexico’s tortilla sector favors calcium propionate for cost and hot-climate distribution stability.
Asia-Pacific will post the fastest regional growth at 5.98% CAGR. China’s GB 2760-2024 aligned maximum-use levels nationwide in February 2025, eliminating compliance uncertainty and enabling chain bakeries to standardize recipes. BASF-YPC’s integrated 69,000-tonne facility and expanding feedgrain preservation have consolidated supply. India’s regulatory reviews inject some caution, but rising urban bread consumption keeps demand robust. Japan and South Korea maintain strict purity codes, ensuring a fait-accompli for certified multinationals. ASEAN dynamics are mixed: Vietnam and Indonesia are receptive, whereas Thailand’s labeling steers premium bakers toward fermented options.
Europe balances robust regulatory support for feed with consumer pressure in food. EFSA’s 2024 feed approval creates a stable runway for animal nutrition in Norway, Scotland and Spain. Meanwhile, northern retailers push for “no artificial” labels, generating openings for Corbion’s fermented blends. Southern Europe keeps calcium propionate entrenched in cured meats and traditional loaves. South America and the Middle-East and Africa contribute smaller shares, with Brazil’s growing bakery chains and GCC shelf-life challenges offering reliable though modest upside for the calcium propionate market.

Competitive Landscape
Global supply is moderately concentrated. Integrated majors such as BASF, Dow, Eastman and Perstorp collectively control close to half of global propionic acid capacity, translating to cost leadership downstream. BASF-YPC’s Verbund in Nanjing anchors Asia-Pacific logistics, while Perstorp’s Castellanza upgrade in early 2024 boosts European redundancy. Formulators like Kerry Group differentiate through application-specific crystals, powders and suspensions that fit customer processing constraints.
Fermentation specialists—Corbion in particular—are reshaping premium channels with cultured dextrose, wheat and buffered vinegar systems that can halve synthetic dosages without taste penalties. Sunson Biotechnology targets Asia-Pacific patisserie with high-potency NaturalGARD lines exceeding 40% propionic acid, strengthening clean-label credibility. Patents from Takeda (US8846101B2) reveal micro-encapsulation techniques that secure dairy adoption by removing off-odors.
Distribution agreements enhance reach: Azelis widened ties with Perstorp in 2024 for animal nutrition, underscoring the importance of technical sales support in regulatory-heavy applications. Overall, the calcium propionate market tilts toward incumbents for bulk bakery and feed volumes, while innovators siphon value in high-margin, brand-conscious niches.
Calcium Propionate Industry Leaders
Perstorp
Macco
ADDCON GmbH
Kerry Group plc
Impextraco NV
- *Disclaimer: Major Players sorted in no particular order

Recent Industry Developments
- July 2024: BioVeritas, LLC announced a 1:1 clean label alternative to calcium propionate. The product was developed by upcycling surplus biomass through a fermentation process that replicated natural processes.
- June 2024: Creative Enzymes introduced fermented calcium propionate to enhance food preservation methods. Fermented calcium propionate was notable for its effectiveness in extending the shelf life of various food products by preventing mold growth while maintaining freshness and taste.


Research Methodology Framework and Report Scope
Market Definitions and Key Coverage
Our study defines the calcium propionate market as the total manufacturer-level revenue generated from food, feed, pharmaceutical, and industrial grades of calcium propionate sold in dry (powder or granular) and liquid forms to bakery, dairy, meat, animal nutrition, personal care, and allied processors worldwide.
In our analysis, we track only fresh product shipments; derivative blends or other propionate salts are excluded.
Segmentation Overview
- By Form
- Dry (Powder, Granular)
- Liquid/Suspension
- By Grade
- Food Grade
- Feed Grade
- Pharmaceutical Grade
- Industrial Grade
- By Application
- Food and Beverage
- Pharmaceutical
- Animal Feed
- Personal Care
- Other Applications
- By Geography
- Asia-Pacific
- China
- India
- Japan
- South Korea
- ASEAN Countries
- Rest of Asia-Pacific
- North America
- United States
- Canada
- Mexico
- Europe
- Germany
- United Kingdom
- France
- Italy
- Spain
- NORDIC Countries
- Rest of Europe
- South America
- Brazil
- Argentina
- Rest of South America
- Middle-East and Africa
- Saudi Arabia
- South Africa
- Rest of Middle-East and Africa
- Asia-Pacific
Detailed Research Methodology and Data Validation
Primary Research
Structured interviews and short surveys with procurement managers at bakery groups, premix formulators, regional food safety regulators, and large feed mills across North America, Europe, Asia Pacific, and Latin America validate demand drivers, price corridors, and substitution trends, filling data gaps left by secondary sources and guiding assumption fine tuning.
Desk Research
Mordor analysts first map the universe of supply and demand through trusted, non-paywalled sources such as UN Comtrade shipment codes, FAO livestock statistics, USDA bakery outlooks, Eurostat food additive approvals, and EFSA/FDA GRAS dossiers. Industry associations, including the International Dairy Federation and the World Grain Council, supply baseline production and consumption metrics that anchor regional splits.
Company 10-Ks, investor decks, and regulatory filings then reveal average selling prices, plant capacities, and capital expenditure signals, which are cross-checked in D&B Hoovers and Dow Jones Factiva for financial consistency. Additional pattern checks draw on patent counts from Questel and tender volumes from Tenders Info, ensuring emerging applications are not overlooked. This source list is illustrative, not exhaustive; many other publications underpin our desk research.
Market-Sizing & Forecasting
Mordor's model begins with a top-down reconstruction of global demand. Apparent consumption is derived from propionic acid output, calcium hydroxide input, and trade balances, which are then filtered through usage coefficients for each end market. Select bottom-up roll-ups, sampled supplier revenues and channel checks, provide a reasonableness test before totals are locked. Key variables include packaged bread production, regional feed tonnage, pharmaceutical excipient output, propionic acid price spreads, and regulatory uptake of mold inhibitor maximum levels.
A multivariate regression with ARIMA overlays forecasts these drivers to 2030; scenario analysis captures upside from clean label reformulations and downside from natural preservative substitution. Where distributor mark-ups or captive consumption obscure volumes, proxy indicators such as bakery SKU launches and feed premix penetration rates bridge the gap.
Data Validation & Update Cycle
Outputs pass three layers of review: automated variance flags, peer analyst cross-checks, and a senior analyst sign-off. Anomalies trigger re-contacts with primary respondents. Reports refresh annually, with interim updates if raw material shocks or regulatory changes shift the outlook.
Why Our Calcium Propionate Baseline Commands Reliability
Published estimates often diverge because firms choose different grade mixes, price bases, and refresh cadences.
Key gap drivers include narrower product scopes, single source price assumptions, or static regional shares that ignore rapid Asia Pacific bakery growth. External studies peg the 2024 global market anywhere between USD 291 million and USD 403 million, while our 2025 baseline stands at USD 407.17 million.
Benchmark comparison
| Market Size | Anonymized source | Primary gap driver |
|---|---|---|
| USD 407.17 mn (2025) | Mordor Intelligence | - |
| USD 291.36 mn (2024) | Global Consultancy A | Excludes pharma grade; relies mainly on historical trade data |
| USD 402.53 mn (2024) | Industry Journal B | Uses higher ASPs and assumes uniform feed demand across regions |
In short, Mordor's disciplined scope, multi-source data lattice, and annual refresh give decision makers a balanced, transparent baseline they can confidently plug into strategic models.


Key Questions Answered in the Report
How big is the calcium propionate market today?
The calcium propionate market size reached USD 408.24 million in 2026 and is on course to hit USD 526.76 million by 2031 at a 5.23% CAGR.
Which application will grow fastest over the next five years?
Animal feed is projected to expand at 5.89% CAGR, outpacing food and beverage due to EU aquaculture approvals and Asia-Pacific livestock demand.
What regulatory changes are most important for market growth?
EFSA’s 2024 feed renewal and China’s GB 2760-2024 harmonization both remove compliance uncertainty, unlocking long-term volume commitments.
How does bio-based propionic acid influence purchasing decisions?
Electro-synthetic and fermentation routes lower carbon footprints by up to 40%, enabling food brands with net-zero targets to pay sustainability premiums.
Page last updated on:


