Cable Conduit Market Size and Share
Market Overview
| Study Period | 2020 - 2031 |
|---|---|
| Market Size (2026) | USD 8.7 Billion |
| Market Size (2031) | USD 13.62 Billion |
| Growth Rate (2026 - 2031) | 9.35% CAGR |
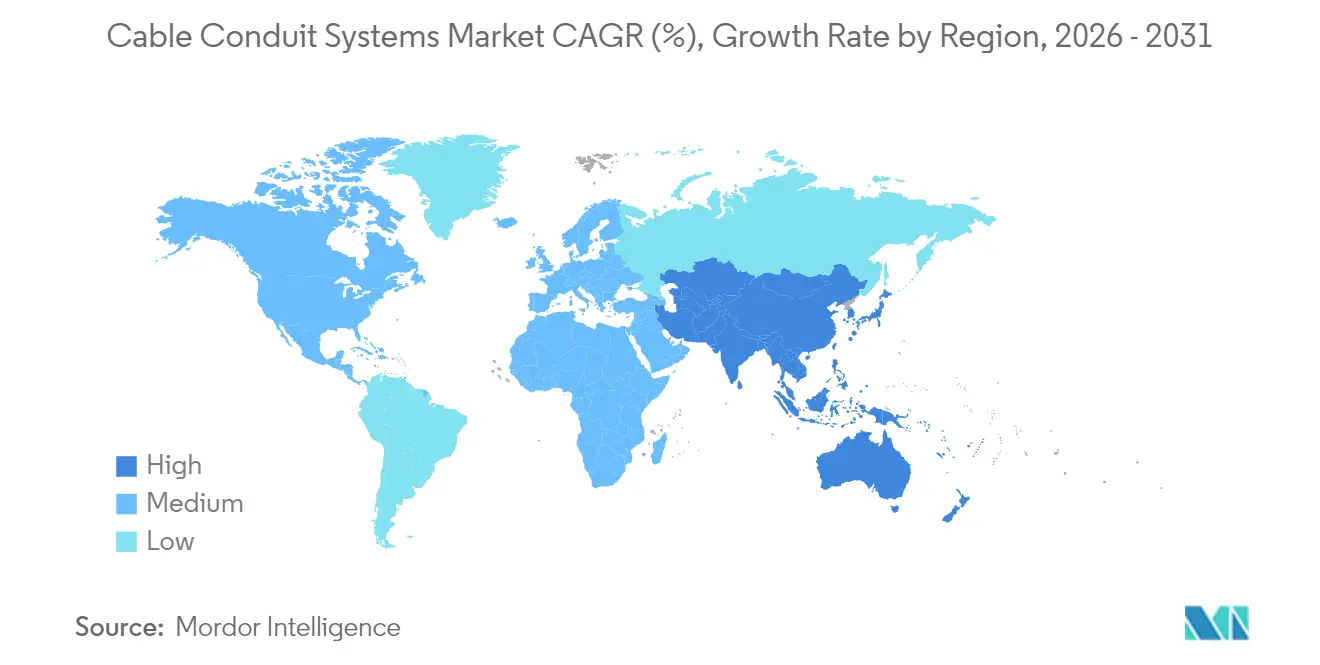
| Fastest Growing Market | Asia Pacific |
| Largest Market | North America |
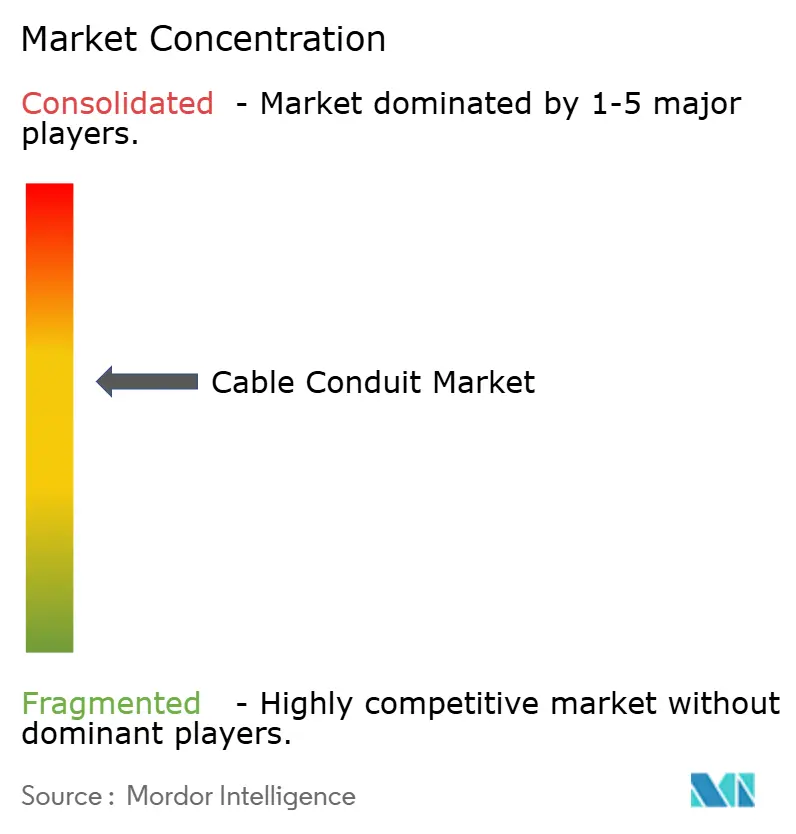
| Market Concentration | Medium |
Major Players *Disclaimer: Major Players sorted in no particular order Image © Mordor Intelligence. Reuse requires attribution under CC BY 4.0. | |
Cable Conduit Market Analysis by Mordor Intelligence
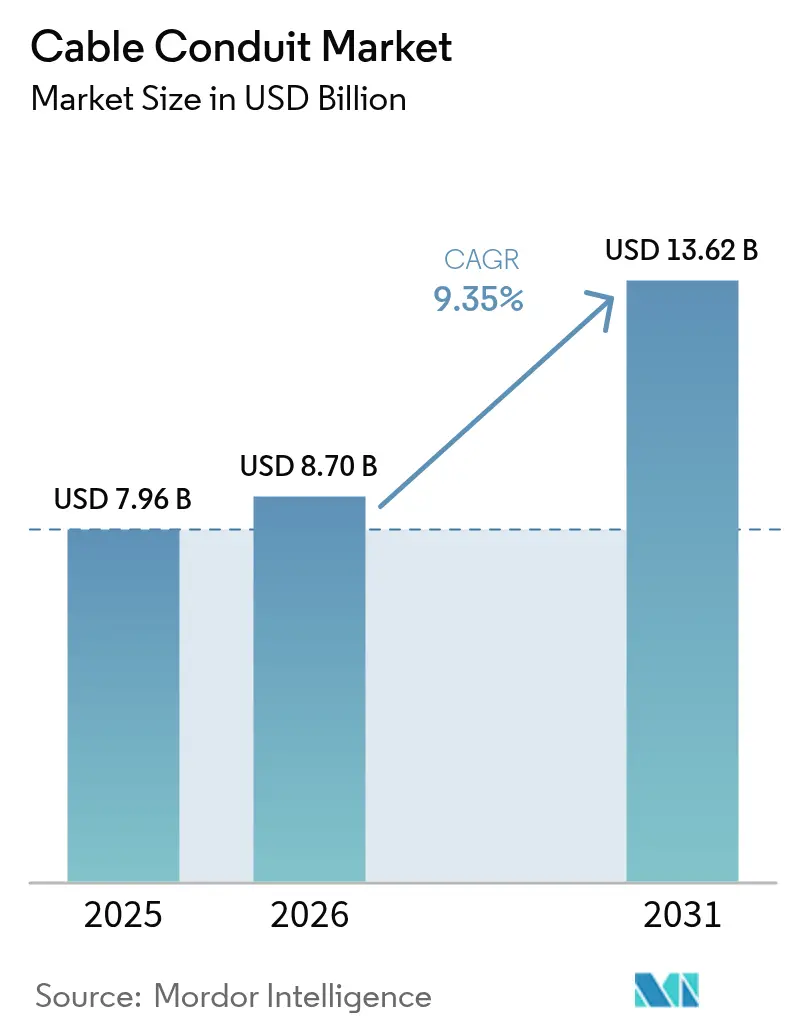
The cable conduit market size is expected to grow from USD 7.96 billion in 2025 to USD 8.70 billion in 2026 and is forecast to reach USD 13.62 billion by 2031 at 9.35% CAGR over 2026-2031. The uptick is powered by surging AI-ready data-center construction, utility-scale renewable roll-outs, and city-wide grid-hardening programs that require reliable raceways for complex wiring. Flexible, corrosion-resistant non-metallic raceways are helping contractors trim labor and lifecycle costs even as steel tariffs inflate metallic prices. Growing cyber-physical security mandates, stronger surge-protection rules, and environmental product declarations now guide purchase decisions, lifting premium demand in the cable conduit market. Emerging smart-city mega-projects across Asia and the Middle East, paired with North American grid investments, cement a long-term expansion runway for the cable conduit market.[1]Kevin Yao, “China Plans to Invest 4 Trillion Yuan in ‘Hidden Infrastructure’,” South China Morning Post, scmp.com
Key Report Takeaways
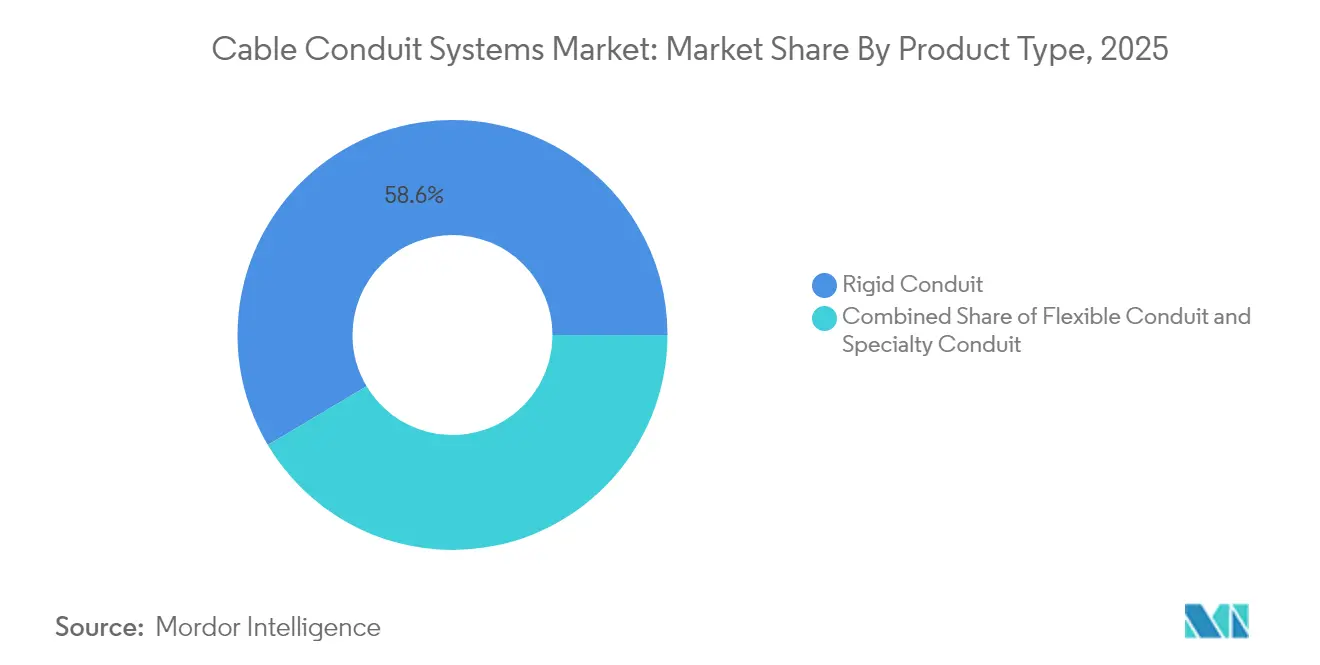
- By product type, rigid systems led with 58.55% cable conduit market share in 2025, while flexible solutions are set to grow at a 9.45% CAGR to 2031.
- By material, non-metallic variants captured 48.20% of the cable conduit market size in 2025 and remain the fastest-growing at 9.25% CAGR.
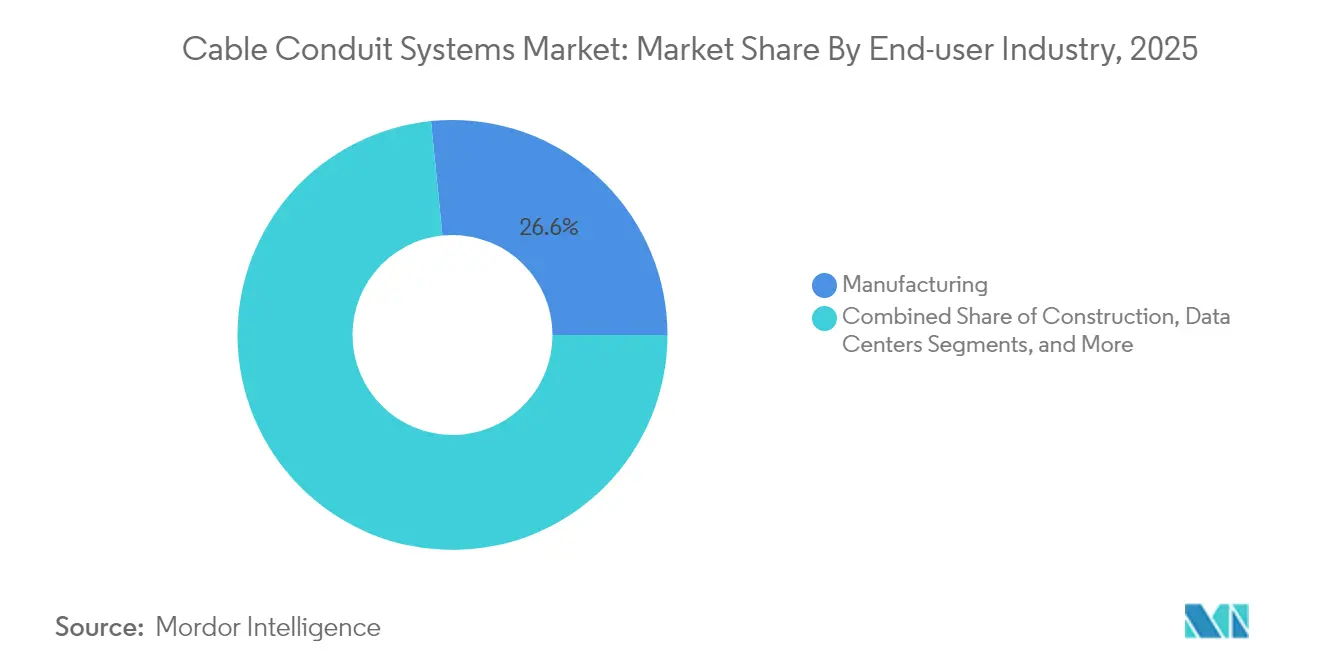
- By end-user, manufacturing held 26.60% revenue in 2025; data centers carry the highest 11.95% CAGR through 2031.
- By region, North America commanded 31.00% cable conduit market share in 2025; Asia-Pacific records the quickest 9.55% CAGR to 2031.
- By installation environment, indoor runs accounted for 41.30% of the cable conduit market size in 2025, whereas underground lines will post a 9.90% CAGR to 2031.
Note: Market size and forecast figures in this report are generated using Mordor Intelligence’s proprietary estimation framework, updated with the latest available data and insights as of 2026.
Global Cable Conduit Market Trends and Insights
Drivers Impact Analysis*
| Driver | (~) % Impact on CAGR Forecast | Geographic Relevance | Impact Timeline |
|---|---|---|---|
| Demand for highly secure and safe wiring systems | +1.8% | North America, EU | Medium term (2–4 years) |
| Rapid growth in commercial construction projects | +2.1% | APAC, North America | Short term (≤ 2 years) |
| Rise in data-center build-outs worldwide | +2.3% | Global | Short term (≤ 2 years) |
| Urban-infrastructure and smart-city investments | +1.5% | APAC, MEA, Latin America | Long term (≥ 4 years) |
| Utility-scale solar and EV-charging roll-outs | +1.4% | North America, EU, China | Medium term (2–4 years) |
| Cyber-physical security codes mandating EMI-shielded raceways | +0.9% | North America, EU | Long term (≥ 4 years) |
| Source: Mordor Intelligence | |||
Demand for Highly Secure and Safe Wiring Systems
Digitally integrated plants now rely on PLCs and variable-frequency drives that are highly sensitive to electromagnetic noise. Upcoming 2026 National Electrical Code revisions aggregate limited-energy provisions into Chapter 7, elevating scrutiny on conduit shielding for safety-related circuits.[2]ANSI/TIA, “TIA-942-C Telecommunications Infrastructure Standard for Data Centers,” Belden, belden.com Surveys show 26% of facilities experienced safety-system failures tied to unmitigated surges, fuelling premium for EMI-shielded steel conduit. Automotive lines illustrate the effect, where retrofit projects replace legacy plastic raceways with flexible metal options that maintain production uptime during high-speed quality checks. Heightened cybersecurity norms reinforce this preference, linking conduit selection directly to operational resilience across the cable conduit market.
Rapid Growth in Commercial Construction Projects
Commercial floor-space additions hit a six-year high in 2024, with data-center spend climbing to USD 31.5 billion.[3]“2025 Electrical Marketing Construction Outlook,” Electrical Marketing, electricalmarketing.com. Hyperscale campuses in Georgia and Louisiana dedicate nearly one-quarter of their electrical budgets to cable containment. Simultaneously, U.S. hospital expansions specify fire-rated antimicrobial conduits to satisfy Joint Commission audits, driving specialty demand within the cable conduit market. The updated ANSI/TIA-942-C standard separates pathways for copper, fiber, and power cabling, which lengthens total raceway footage for every new data hall. Contractors, therefore, favor flexible non-metallic lines that bend quickly and pass inspection with fewer fittings, shaving days off compressed build schedules.
Rise in Data-Center Build-Outs Worldwide
Electric-load forecasts show data centers rising from 2% to 4% of U.S. grid demand by 2030. AI clusters run hotter and pull heavier amperage, requiring larger trade-size conduit and advanced inner-duct to hold dense fiber bundles. Fabric inner-duct can cut required conduit quantity by 30% while doubling spare capacity, as proven in an Atlanta airport build where 30,000 feet of fabric replaced 10,000 feet of rigid PVC. Copper above USD 5/lb inflates cable cost, yet owners still lock in purchase orders early, sustaining record bid volume in the cable conduit market.
Urban-Infrastructure and Smart-City Investments
China’s USD 551 billion “hidden-infrastructure” mission funds extensive underground tunnels for power, water, and telecom services. Singapore’s 40 km Power Mega Transmission Cable Project reduced ground settlement by 90% with HDPE-lined deep tunnels. Shared utility corridors in Malaysia’s Putrajaya show municipalities splitting costs while standardising conduit specs, a model now spreading to Gulf cities. Non-metallic raceways dominate such long-life assets because they resist corrosion, accelerating Asia-Pacific growth inside the cable conduit market.
Restraints Impact Analysis*
| Restraint | (~) % Impact on CAGR Forecast | Geographic Relevance | Impact Timeline |
|---|---|---|---|
| Volatility in steel, aluminum and PVC resin prices | −1.2% | Global, North America focus | Short term (≤ 2 years) |
| Substitution risk from cable-tray and modular raceway systems | −0.8% | North America, EU | Medium term (2–4 years) |
| Embodied-carbon targets discouraging heavy steel conduit | −0.6% | North America, EU, APAC | Long term (≥ 4 years) |
| PA-12 supply tightness after geopolitical disruptions | −0.4% | Global auto and industrial | Medium term (2–4 years) |
| Source: Mordor Intelligence | |||
Volatility in Steel, Aluminum and PVC Resin Prices
New 25% import tariffs have inflated steel and aluminum conduit quotes by 14–22%, squeezing contractor margins. Atkore’s Q1 2025 electrical revenue fell 21.6% as average selling price declined and volumes weakened, with a USD 162 million HDPE impairment tied to broadband-funding delays. Resin costs climbed after Gulf-Coast outages, lifting PVC conduit pricing 9%. Contractors insert escalation clauses and pivot toward non-metallic lines where code permits, yet supply chain swings persist, tempering short-term outlook for the cable conduit market.
Substitution Risk from Cable-Tray and Modular Raceway Systems
Cable-tray systems shave labor by 45% compared to conduit in certain interiors. A Midwest plant upgrade swapped 60% of EMT runs for ladder tray, cutting timeline by five weeks and materials cost by 35%. Tray’s accessibility appeals where future moves-adds-changes are common. However, haz-loc zones, outdoor feeders, and EMI-sensitive lines still mandate conduit, preserving specification-driven demand within the cable conduit market despite the substitution headwind.
*Our forecasts treat driver/restraint impacts as directional, not additive. The impact forecasts reflect baseline growth, mix effects, and variable interactions.
Segment Analysis
By Product Type: Flexible Systems Gain Installation Edge
Rigid metallic conduit still owns 58.55% of 2025 revenue, reflecting regulatory mandates in hazardous and structural circuits. Flexible options, advancing at a 9.45% CAGR, help electricians navigate congested ceilings and prefabricated pods with fewer elbows and couplings. Liquid-tight flexible metallic conduit meets UL 360 ingress protection, rivaling rigid in harsh zones. Field trials show one trade-size-1 run with ten 90-degree elbows takes 58 minutes in rigid but only 23 minutes using LFMC, a 60% labor saving. Hybrid product lines that bundle transition fittings, speed inspections, and support cross-trade prefabrication. The cable conduit market size for flexible products is on track to reach USD 4.47 billion by 2031, equal to roughly one-third of total sales.
A Texas refinery expansion illustrates dual sourcing: 15,000 feet of rigid stainless conduit secured classified areas, while 8,000 feet of LFMC handled vibration-prone pump skids, underlining application-specific selection rather than blanket cost-cutting across the cable conduit market.


By Material: Non-Metallic Dominance Reflects Cost and Performance Advantages
Non-metallic raceways, led by PVC and HDPE, commanded 48.20% revenue in 2025 and will outpace overall cable conduit market growth at 9.25% CAGR. PVC’s flame-retardant and low-smoke properties make it a default in commercial interiors, while HDPE’s tensile resilience dominates long-pull duct banks. Specialty PA-12/Nylon retains niches in EV-battery lines despite supply bottlenecks. Atkore’s Environmental Product Declarations allow architects to quantify embodied-carbon savings when specifying recycled-content PVC blends.
Metallic alternatives remain essential for EMI shielding and grounding. Stainless types cost twice PVC yet slash wash-down maintenance in food plants, recouping premium within five years. The cable conduit market size for non-metallic variants is projected to exceed USD 6.45 billion by 2031, cementing their leading role in greenfield and retrofit programs.
By End-User Industry: Data Centers Drive Premium Demand
Manufacturing still contributes 26.60% revenue, covering automotive, chemical, and pulp sectors that rely on ruggedized wiring for continuous operation. Hyperscale and colocation operators, however, underpin a 11.95% CAGR, the fastest across the cable conduit industry. An Atlanta campus allocated USD 52 million for cable containment, up 18% versus the prior phase due to AI racks drawing 400 W/ft². NEC Article 645 limits combustible material in data halls, driving low-smoke, halogen-free conduit specs. Healthcare and education demand antimicrobial, fire-rated options, but volume trails data centers by a wide margin. OT-IT convergence in smart factories is merging requirements, letting suppliers bundle data-center-grade raceways into industrial bids, a trend expanding wallet share in the cable conduit market.
By Installation Environment: Underground Applications Accelerate
Indoor runs retained a 41.30% share in 2025, yet underground feeders will grow 9.90% CAGR as utilities bury lines for climate resilience. ComEd’s Chicago duct bank placed nine 6-inch PVC pipes in concrete over 6 miles. HDPE’s fused joints and flexibility cut splice counts in deep-bore pulls. Outdoor EV-charger circuits require UV-stabilized PVC, while offshore-wind exports mandate double-jacketed stainless steel rated to 300 bar. The cable conduit market size for underground uses is projected to reach USD 3.1 billion by 2031.
Smart-city charters now value aesthetics alongside resilience, prompting municipalities to push even low-voltage fiber into joint service tunnels. Modular multi-cell conduit lets operators add capacity without fresh excavation, a selling point energizing the cable conduit market.
Geography Analysis
North America leads with 31.00% revenue in 2025, driven by relentless data-center expansion and USD 8 billion grid-hardening following winter storm Uri. Tariff-driven metal inflation channels some projects toward PVC and HDPE, yet EMI-critical defense bases still single-source steel, sustaining a premium segment in the cable conduit market. Domestic mills ramp galvanized output to compress lead times from 12 to 7 weeks.
Asia-Pacific shows the quickest 9.55% CAGR thanks to China’s vast underground “hidden-infrastructure” tunnels and India’s Rs 960 billion transmission upgrade targeting 73,245 MW renewable capacity by 2030. China and India absorb 74% of the world's copper, mirroring their infrastructure appetite. Local converters add PVC extrusion lines to meet demand, while PA-12 imports remain vulnerable to trade disruptions.
Europe maintains steady growth on retrofit rebates and offshore-wind grids but faces energy-cost headwinds. Embodied-carbon caps incentivize recyclable aluminum conduit and EPD-certified PVC. Middle East and Africa climb on airport hubs, EV-charging corridors, and Gulf utility corridors mandating self-extinguishing plastic raceways. Latin America is mixed; Brazil’s offshore pre-salt fields require stainless sub-seabed conduit, creating smaller yet profitable pools in the cable conduit market.

Competitive Landscape
Roughly 62% of global sales sit with the top five vendors, signalling moderate concentration. Integrated players control steel strip mills, resin compounding, and accessory foundries, buttressing margins against raw-material volatility. Capacity adds—such as ABB’s Alabama flexible-conduit upgrade—aim to shorten lead times and lock in distributor loyalty. Legrand’s 2024 acquisition of Australian Plastic Profiles adds USD 107 million to Asia-Pacific turnover.
Environmental disclosures now differentiate suppliers; EPD-labelled conduits give architects quantifiable CO₂ savings, influencing spec lists. Patent filings gravitate toward low-friction HDPE liners and halogen-free PVC compounds. Distributor consolidation compresses shelf space for niche brands, rewarding firms able to ship full BOM kits. White-space opportunities in EV-charging plazas, micro-grids, and offshore-wind exports favor vendors pairing design support with pre-fabricated duct banks, fortifying their stance in the cable conduit market.
Cable Conduit Industry Leaders
Hubbell Incorporated
Schneider Electric SE
ABB Group
Legrand
Aliaxis Group
- *Disclaimer: Major Players sorted in no particular order

Recent Industry Developments
- March 2025: TS Conductor confirmed a USD 134 million South Carolina plant for carbon-core conductors, opening Q4 2025.
- February 2025: Stanley Black & Decker unveiled DEWALT TOUGHWIRE™ hangers, shipping spring 2025.
- January 2025: ComEd filed for the Kishwaukee Area Reliability Extension featuring a 345 kV line slated 2026–2027.
- November 2024: Legrand closed the APP acquisition, adding EUR 100 million cable-management sales.
- October 2024: NFPA published first-draft NFPA 70 2026, reorganising limited-energy rules.


Research Methodology Framework and Report Scope
Market Definitions and Key Coverage
According to Mordor Intelligence, our study values the cable conduit market as the annual revenue from newly manufactured rigid, flexible, metallic, and non-metallic conduits that protect and route power or data cables across residential, commercial, industrial, and utility settings. Figures are recorded at factory-gate prices before distributor mark-ups and taxes.
Scope exclusion: retrofit repair sleeves, cable trays, and innerduct inserted into existing conduit are not included.
Segmentation Overview
- By Product Type
- Rigid Conduit
- Metallic
- Non-metallic
- Flexible Conduit
- Metallic
- Non-metallic
- Specialty Conduit
- Liquid-tight
- Fire-resistant
- Submersible
- Rigid Conduit
- By Material
- Metallic
- Steel
- Stainless Steel
- Aluminum
- Non-metallic
- PVC
- HDPE
- PA-12 / Nylon
- Metallic
- By End-user Industry
- Construction
- Commercial Buildings
- Residential Buildings
- Industrial Buildings
- IT and Telecommunications
- Data Centers
- Energy and Utilities
- Power Generation
- Renewable Energy (Solar / Wind)
- Oil and Gas
- Manufacturing
- Healthcare Facilities
- Others
- Construction
- By Installation Environment
- Indoor
- Outdoor
- Underground
- Submerged
- By Geography
- North America
- United States
- Canada
- Mexico
- South America
- Brazil
- Argentina
- Rest of South America
- Europe
- Germany
- United Kingdom
- France
- Italy
- Spain
- Rest of Europe
- Asia-Pacific
- China
- Japan
- India
- South Korea
- Australia
- Rest of APAC
- Middle East
- Saudi Arabia
- United Arab Emirates
- Turkey
- Rest of Middle East
- Africa
- South Africa
- Nigeria
- Egypt
- Rest of Africa
- North America
Detailed Research Methodology and Data Validation
Primary Research
Mordor analysts engaged electrical inspectors, project engineers, distributors, and installation contractors across North America, Europe, Asia-Pacific, and the Gulf. Their insights confirmed average selling prices, metal-to-plastic substitution rates, and construction lead times that secondary data could not fully capture.
Desk Research
We mapped demand drivers from public datasets such as U.S. Census construction spending tables, Eurostat building permits, India's Central Electricity Authority project lists, and global customs codes HS 7306/3917. Standards bodies (IEC, UL) and the National Electrical Manufacturers Association supply shipment and safety code updates, while company 10-Ks, patent families via Questel, and Dow Jones Factiva news reveal pricing pivots and plant capacities. The sources named are illustrative; numerous other secondary references underpin the dataset.
Market-Sizing & Forecasting
A top-down build starts with new floor space completions and power generation or data center capex; conduit intensity ratios (meters per m2 or per MW) derived from interviews convert these drivers into volume. Supplier roll-ups and sampled ASP x unit checks provide bottom-up sense tests. Key variables include steel and PVC spot prices, grid modernization budgets, data center rack additions, code revisions, and seasonal construction patterns. Multivariate regression, blended with scenario analysis, projects 2025-2030 outcomes; missing distributor data are bridged using material mix heuristics validated with experts.
Data Validation & Update Cycle
Model outputs pass variance screens, cross-checks against adjacent cable management spend, and two-step analyst peer review before sign-off. We refresh numbers every twelve months, with mid-cycle updates triggered by raw material price spikes or major infrastructure bills.
Why Mordor's Cable Conduit Baseline Commands Reliability
Published estimates often diverge because studies choose different product baskets, pricing points, and update rhythms. Some broaden scope to trays and fittings or lock currency conversions to a single month, while others forecast with linear price declines. Mordor isolates pure conduit revenues, applies quarterly FX adjustments, and grounds ASP trends in live quotes, giving decision makers a steadier baseline.
Benchmark comparison
| Market Size | Anonymized source | Primary gap driver |
|---|---|---|
| USD 7.96 bn (2025) | Mordor Intelligence | - |
| USD 8.45 bn (2025) | Global Consultancy A | bundles cable trays and smooths prices over three years |
| USD 7.23 bn (2024) | Industry Research B | covers fewer regions and relies solely on customs volumes |
Takeaway: by anchoring on clearly defined products, live price checks, and annual refreshes, our baseline remains transparent, reproducible, and ready for confident use in strategic planning.


Key Questions Answered in the Report
What is the projected growth rate for the cable conduit market?
The cable conduit market is forecast to expand at a 9.35% CAGR from 2026 to 2031.
Which segment grows fastest within the cable conduit market?
Flexible conduit systems post the quickest 9.45% CAGR due to easier routing and lower labor.
How big is the cable conduit market size for non-metallic conduits?
Non-metallic variants drive 48.20% of 2025 revenue and are projected to surpass USD 6.45 billion by 2031.
Why are data centers important to conduit suppliers?
Data centers lead demand with a 11.95% CAGR as AI workloads require fire-resistant, EMI-shielded raceways.
What regional market shows the highest growth?
Asia-Pacific records the fastest 9.55% CAGR, spurred by China’s underground “hidden-infrastructure” spending and India’s renewable grid build-out.
How do material tariffs affect the cable conduit market?
Recent 25% import duties on steel and aluminum raised conduit quotes up to 22%, driving some buyers toward PVC and HDPE alternatives.
Page last updated on:


