Market Overview
| Study Period | 2021 - 2031 |
|---|---|
| Forecast Data Period | 2026 - 2031 |
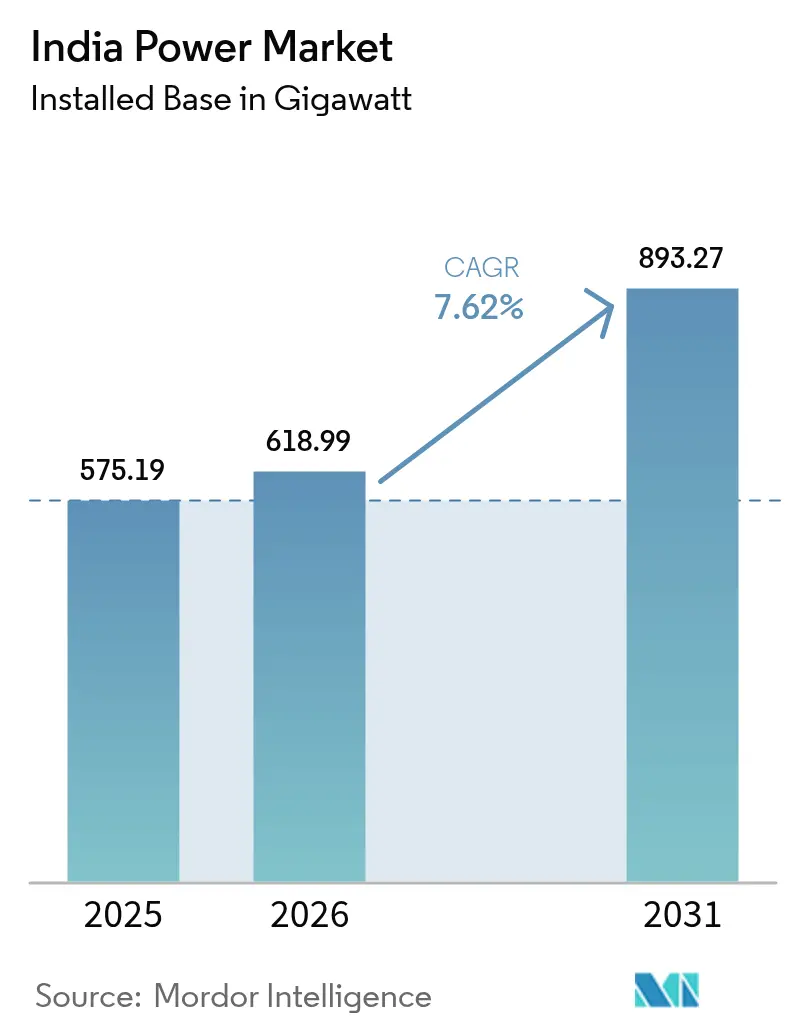
| Base Year Market Size (2025) | 575.19 gigawatt |
| Market Volume (2026) | 618.99 gigawatt |
| Market Volume (2031) | 893.27 gigawatt |
| Growth Rate (2026 - 2031) | 7.62% CAGR |
| Market Concentration | Medium |
Major Players *Disclaimer: Major Players sorted in no particular order Image © Mordor Intelligence. Reuse requires attribution under CC BY 4.0. | |
India Power Market Analysis by Mordor Intelligence
India Power Market size in 2026 is estimated at 618.99 gigawatt, growing from 2025 value of 575.19 gigawatt with 2031 projections showing 893.27 gigawatt, growing at 7.62% CAGR over 2026-2031.
Industrial revival, accelerating urbanization, and an assertive policy pivot toward renewables are reshaping the generation mix and placing the India power market on a structurally higher growth path than most peer economies. Thermal assets still dominate today, yet falling solar and wind tariffs, a 15.2% annual nuclear build-out, and battery cost declines are eroding coal’s share even before many units reach mid-life. Peak-demand spikes are widening as cooling loads in tier-2 cities meet electrified transport, forcing grid planners to approve both flexible gas peakers and four-hour lithium-ion arrays. At the same time, distribution-sector solvency and real-time balancing shortcomings remain the principal speed bumps that could derail headline expansion if left unresolved.
Key Report Takeaways
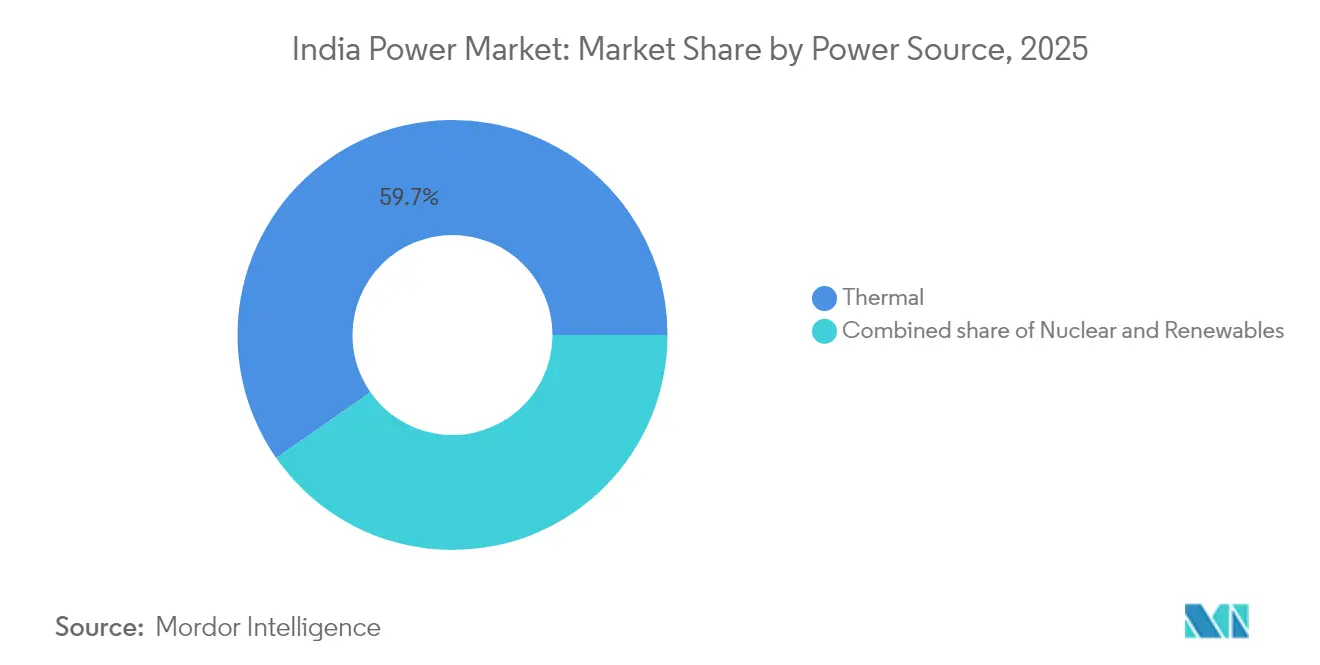
- By power source, thermal generation held 59.70% of India's power market share in 2025, while nuclear capacity is advancing at a 14.38% CAGR through 2031.
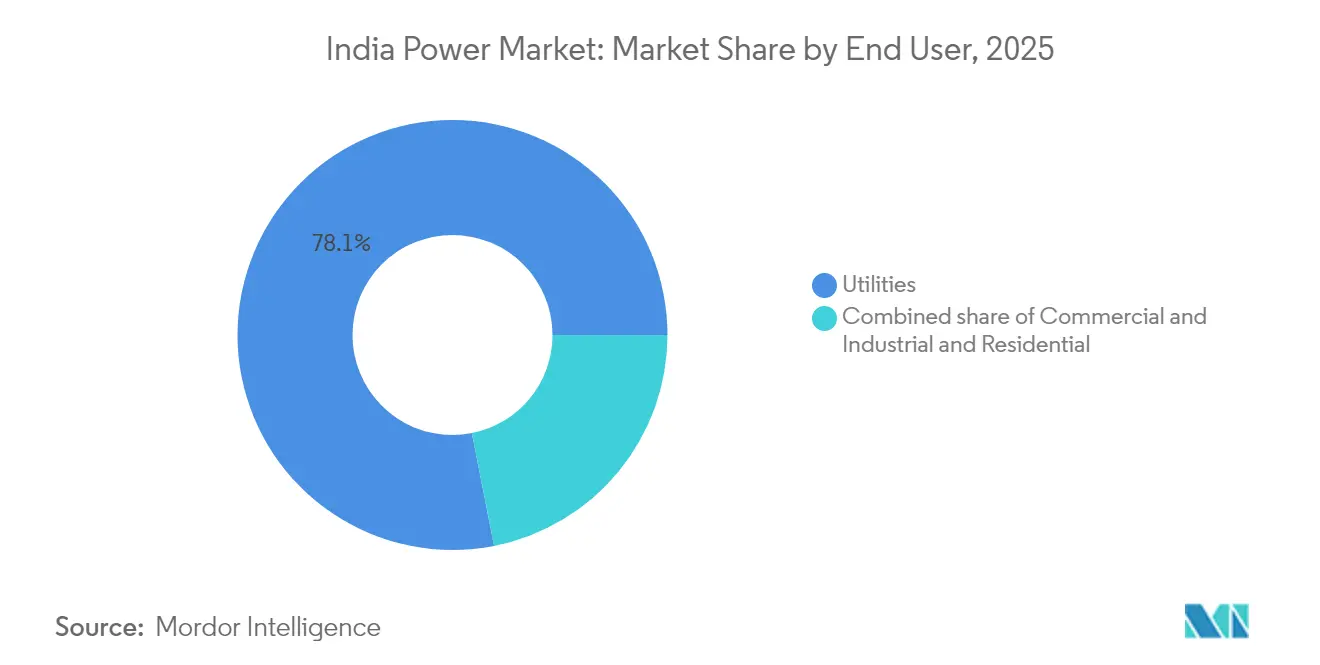
- By end user, utilities commanded 78.10% of the India power market size in 2025, and commercial and industrial demand is expanding at an 11.12% CAGR to 2031.
Note: Market size and forecast figures in this report are generated using Mordor Intelligence’s proprietary estimation framework, updated with the latest available data and insights as of 2026.
India Power Market Trends and Insights
Drivers Impact Analysis*
| Driver | (~) % Impact on CAGR Forecast | Geographic Relevance | Impact Timeline |
|---|---|---|---|
| Growing electricity demand | +2.1% | National, with peak intensity in Maharashtra, Gujarat, Tamil Nadu, Uttar Pradesh | Medium term (2–4 years) |
| Government policy push & reforms | +1.8% | National, accelerated rollout in Rajasthan, Karnataka, Andhra Pradesh for renewables | Short term (≤ 2 years) |
| Rapid renewable capacity additions | +2.3% | National, concentrated in Gujarat, Rajasthan, Tamil Nadu for solar and wind | Medium term (2–4 years) |
| Electrification of transport & cooking | +1.0% | National, urban concentration for EV charging, rural focus for cooking electrification | Long term (≥ 4 years) |
| Grid digitalisation & automation wave | +1.2% | National, early adoption in Delhi, Maharashtra, Haryana smart-meter zones | Long term (≥ 4 years) |
| Green-hydrogen pilot programmes driving load | +0.5% | National, pilot concentration in Gujarat, Rajasthan, Andhra Pradesh industrial corridors | Long term (≥ 4 years) |
| Source: Mordor Intelligence | |||


Growing Electricity Demand
Manufacturing output rebounded in 2024, with steel, cement, and chemicals increasing combined grid draw 7.2% year on year as new furnaces, kilns, and crackers restarted or expanded capacity.[1]Ministry of Power, “Electricity Demand Projections,” powermin.gov.in Hyperscale cloud providers simultaneously announced 1.5 GW of captive data-center plants across Mumbai, Hyderabad, and Chennai to support AI workloads that require near-continuous power. Household cooling demand is also climbing, as air-conditioner penetration in tier-2 and tier-3 cities doubled from low single-digit baselines once average feeder reliability exceeded 90% up-time. The Central Electricity Authority projects national peak demand will reach 260 GW by 2027, compressing reserve margins below 7% in several states unless new flexible resources enter the stack.[2]Central Electricity Authority, “Monthly Installed Capacity Report,” cea.nic.in These dynamics position the India power market as a volume-driven expansion story where fresh capacity approvals outpace pure GDP trends.
Government Policy Push & Reforms
The Production Linked Incentive scheme disbursed INR 240 billion in 2024 to back 50 GW of integrated solar manufacturing, cutting Chinese import reliance to a projected 40% by 2026. The PM-KUSUM farm-solar program scaled subsidies to 3.5 million pumps, adding 10 GW of daytime generation that frees transmission headroom for evening peaks.[3]Press Information Bureau, “PM-KUSUM Progress Update,” pib.gov.in Time-of-day tariffs mandated under the Electricity (Rights of Consumers) Rules 2020 now nudge industrial operators to shift non-critical loads into the mid-day solar belly, flattening the duck curve in states such as Gujarat. While implementation remains uneven, Uttar Pradesh and Bihar lag by roughly two years; early movers already record 5-10 % intraday volatility reductions. Collectively, these levers intensify competitive procurement and accelerate cost discovery, reinforcing confidence in the India power market as a policy-supported transition arena.
Rapid Renewable Capacity Additions
Solar and wind auctions cleared 28 GW in 2024 at INR 2.50 /kWh, 30% below new-build coal and competitive with depreciated subcritical units. Multinational manufacturers operating in India executed 6 GW of corporate PPAs to lock in long-term green electricity, a structural shift that bypasses financially stressed distribution companies. Rooftop solar reached 12 GW on net-metered commercial roofs, encouraged by peak retail tariffs above INR 10 /kWh in Maharashtra. Offshore wind gained traction when Gujarat awarded 5 GW of seabed leases for floating platforms capable of 50% capacity factors, twice onshore averages. These milestones collectively push the India power market closer to a tipping point where low-carbon additions exceed 70% of yearly capacity, squeezing thermal utilization below cost-recovery thresholds.
Grid Digitalization & Automation Wave
Energy Efficiency Services Limited had rolled out 50 million smart meters by December 2024, giving utilities granular data to curb theft and pilot dynamic pricing. Supervisory control and data-acquisition platforms integrating weather forecasts, storage dispatch, and demand-response signals cut balancing costs by 12% in Delhi and Haryana pilots. PowerGrid’s sensor networks now predict transformer failures 48 hours in advance, lowering unplanned outage hours by one-fifth along congested north-south corridors. However, nationwide coverage requires INR 900 billion of fresh capital, and concessional lending from multilaterals is increasingly tied to verifiable loss-reduction milestones. Digital upgrades, therefore, remain the linchpin for reliable renewable integration within the India power market over the long haul.
Restraints Impact Analysis*
| Restraint | (~) % Impact on CAGR Forecast | Geographic Relevance | Impact Timeline |
|---|---|---|---|
| DISCOM financial-health issues | -1.4% | National, acute in Uttar Pradesh, Rajasthan, Tamil Nadu, Telangana | Short term (≤ 2 years) |
| Land & environmental-clearance hurdles | -0.9% | National, pronounced in forest-dense states including Chhattisgarh, Odisha, Maharashtra | Medium term (2–4 years) |
| Grid-stability challenges from variable RE | -0.8% | National, pronounced in Southern and Western grids with high solar penetration | Medium term (2–4 years) |
| Capital crunch for smart-meter rollout | -0.6% | National, affecting tier-2 and tier-3 cities and rural distribution networks | Long term (≥ 4 years) |
| Source: Mordor Intelligence | |||
DISCOM Financial-Health Issues
Fifteen state utilities posted aggregate technical and commercial losses above 18% in fiscal 2024, delaying generator payments by an average of 120 days and inflating working-capital costs across the India power market. Subsidy transfers from state treasuries often arrive late, forcing companies to bridge gaps with short-term debt priced 200 basis points over sovereign yields, crowding out capex for transformers and feeders. UDAY debt swaps offered temporary relief between 2015 and 2019 but failed to enforce loss-reduction targets or politically sensitive tariff rationalization. Absent a credible escrow on subsidy flows, private developers prefer states with better discipline, deepening regional investment asymmetries. Unless payment backlogs shrink sharply, the India power market risks repeating the 2012 grid collapse episode, when financial distress cascaded into operational neglect.
Grid-Stability Challenges from Variable Renewable Energy
Variable renewable energy supplied 35% of new capacity in 2024, yet ancillary services remain thin, and fast-ramping assets total barely 3% of installed renewables. Southern-region frequency excursions outside the 49.90-50.05 Hz band triggered 14 load-shedding events in Q1-2024 alone, exposing industrial offtakers to unplanned stoppages. Battery projects under construction reach only 2.5 GW and cluster around a few gigawatt-scale parks, offering limited geographically dispersed voltage support. Pumped hydro remains stuck in permitting limbo; typical timelines stretch beyond seven years due to land and wildlife clearances. Until real-time prices reward flexible demand and storage economics improve, curtailment risks will persist and restrain the full decarbonization potential of the India power market.
*Our forecasts treat driver/restraint impacts as directional, not additive. The impact forecasts reflect baseline growth, mix effects, and variable interactions.
Segment Analysis
By Power Source: Nuclear Surges as Thermal Plateaus
Thermal assets accounted for 59.70% of installed capacity in 2025, anchoring the baseload foundation of the India power market. Compliance costs, notably flue-gas desulfurization retrofits, have forced 8 GW of aging units offline, signaling a plateau even before coal plants exhaust their technical life. Conversely, nuclear additions averaging 14.38% annually to 2031 position the segment as the fastest grower, propelled by Kudankulam Units 5 and 6 and ten indigenously designed PHWRs.
The India power market size for baseload nuclear is projected to expand by 11 GW this decade, lifting nuclear’s contribution to 4% of total capacity. Renewables continue to post the largest absolute additions, with solar alone slated for 15 GW per year and offshore wind emerging as a 5 GW pilot pipeline off the Gujarat coast. Pumped-storage hydro, nearly 10 GW in advanced stages, will provide eight-hour firming that can displace inefficient peaking diesel sets. As these technologies converge, coal’s share will slide below 50% even as absolute thermal gigawatts inch higher, underscoring the transitional character of the India power market.


By End User: Commercial and Industrial Buyers Accelerate Open Access
Utilities held 78.10% of the India power market share for offtake in 2025, reflecting long-standing universal-service mandates. Yet commercial-industrial demand, rising 11.12% per year, is exploiting open-access regulations to source renewables directly at tariffs 20% below grid parity.
The India power market size for open-access transactions surpassed 26.43 TWh in 2025 and could triple by 2031 as group-captive solar and wind parks proliferate. Multilaterally financed green corridors, 20,000 circuit-kilometers of 400-kV and 765-kV lines, are critical to evacuate Rajasthan and Gujarat renewables into Western industrial belts. Rooftop solar on malls, hospitals, and IT campuses crossed 7 GW, leveraging net-metering to shave peak charges. Residential offtake, growing 6.32% yearly, remains tethered to regulated tariffs but is beginning to respond to pilot time-of-day pricing. These shifts add competitive dynamism and diversify revenue channels across the India power market.
Geography Analysis
Regional imbalances define the India power market, with solar irradiance, wind corridors, and industrial load pockets rarely co-located. Gujarat and Rajasthan contributed 40% of 2025 solar additions due to 5.5 kWh/m²/day insolation and streamlined land leasing that cuts gestation to 18 months. Tamil Nadu leads in wind at 10 GW installed, leveraging monsoon-aligned patterns and real-time deviation settlement to curtail losses below 2%.
Maharashtra and Uttar Pradesh together consumed 186.8 TWh in 2025, yet each hosts financially stressed DISCOMs with dues topping INR 400 billion, limiting fresh PPAs and driving spot-market volatility. The Southern Grid integrates the highest renewable share, 32% capacity, thanks to demand-response programs that deferred 2 GW of peakers and saved INR 60 billion in capex. Northern corridors are in upgrade mode; PowerGrid is adding 3,000 circuit-kilometers of 765-kV lines to ferry 25 GW of Rajasthan desert solar to Delhi’s load centers.
Karnataka’s storage mandate, requiring new solar-wind parks above 250 MW to add two-hour batteries, sparked 1.5 GW of orders and cut evening coal ramps 18%. Delhi’s 5 million smart-meter rollout trimmed distribution losses by three percentage points and shifted 300 MW of residential load out of peak slots. Bihar and Jharkhand lag with AT&C losses above 25% and per-capita consumption under 600 kWh, illustrating the dual-speed reality inside the India power market
Competitive Landscape
The India power market features moderate concentration: the top five generators, NTPC, Adani Power, Tata Power, JSW Energy, and Reliance Power, controlled roughly 42% of installed capacity in 2024, with no player above 15%. NTPC is retiring 4 GW of subcritical coal while tendering 15 GW of renewables, exemplifying a hedge-and-grow model that preserves cash flows yet reduces carbon intensity. Adani and Tata are extending vertically into distribution to secure captive offtake and limit receivables risk, mirroring integrated utility patterns in developed markets but sparking regulatory scrutiny over private monopolies.
Renewable specialists, ReNew, Greenko, and Azure, leveraged a 22% year-on-year drop in module prices to underbid thermal incumbents in most 2024 auctions. Yet their heavy PPA exposure ties fortunes to DISCOM solvency, and curtailed output during grid stress can erode internal-rate-of-return assumptions. Storage, green hydrogen, and virtual power plants represent emerging battlegrounds: battery capacity may hit 15 GW by 2030, and the National Green Hydrogen Mission’s INR 197 billion subsidy pool aims for 5 million t/year production, drawing pilot investments from NTPC and Reliance. PowerGrid’s patents for AI-enabled line rating add a digital differentiation layer, increasing throughput 12% without new towers and highlighting the strategic value of data analytics in a capital-heavy sector.
Foreign capital remains keen: pension funds oversubscribed PowerGrid’s USD 500 million green bond, and global banks financed Greenko’s 1.2 GW pumped-storage project. Yet investors demand robust payment guarantees and sovereign-style protections, reminding policymakers that credible market reforms underpin the long-term attractiveness of the India power market.
India Power Industry Leaders
NTPC Ltd.
JSW Group
Adani Power Ltd.
Tata Power Co. Ltd.
NHPC Ltd.
- *Disclaimer: Major Players sorted in no particular order

Recent Industry Developments
- April 2025: Hexa Climate Solutions bought 100% of Fortum India, adding 206 MW operating and 600 MW ready-to-build renewables, and earmarked USD 500 million for future platforms.
- March 2025: Tata Power Renewable Energy and the Andhra Pradesh government signed an MoU for up to 7 GW renewable deployment costing Rs 49,000 crore.
- February 2025: The Union Budget launched a Nuclear Energy Mission for small modular reactors and widened FDI limits in power equipment manufacturing.
- February 2025: ONGC and NTPC created a JV to buy Ayana Renewable Power for Rs 19,500 crore, recording the sector’s second-largest M&A deal.
- October 2025: As of September 30, 2025, India has crossed the significant milestone of 500GW in installed electricity capacity, as announced by Pralhad Joshi, the country's energy minister. The nation reached a total capacity of 500.89GW, with over half stemming from renewable sources. This achievement is attributed to consistent policy backing, robust investments, and collaborative efforts within India's energy sector. Notably, out of India's total power capacity, 256.09GW comes from non-fossil fuel sources, accounting for over 51% of the total.


India Power Market Report Scope
The power industry, often referred to as the electricity sector, encompasses the entire value chain of electricity - from generation and transmission to distribution and sale. This sector integrates organizations, technologies, and infrastructure, ensuring that primary energy sources are efficiently and safely transformed into electrical energy for end users.
The India power market is segmented by power sources, end-users, and T&D voltage level (Qualitative analysis only). By power source, the market is segmented into thermal, nuclear, and renewable. End-users, including utilities, commercial and industrial entities, and residential, categorize it. Furthermore, the report delves into transmission and distribution (T&D) voltage levels, offering qualitative insights on high-voltage transmission, sub-transmission, medium-voltage distribution, and low-voltage distribution.
By Power Source
| Thermal (Coal, Natural Gas, Oil and Diesel) |
| Nuclear |
| Renewables (Solar, Wind, Hydro, Geothermal, Biomass & Waste, Tidal) |
By End User
| Utilities |
| Commercial and Industrial |
| Residential |
By T&D Voltage Level (Qualitative Analysis only)
| High-Voltage Transmission (Above 230 kV) |
| Sub-Transmission (69 to 161 kV) |
| Medium-Voltage Distribution (13.2 to 34.5 kV) |
| Low-Voltage Distribution (Up to 1 kV) |
| By Power Source | Thermal (Coal, Natural Gas, Oil and Diesel) |
| Nuclear | |
| Renewables (Solar, Wind, Hydro, Geothermal, Biomass & Waste, Tidal) | |
| By End User | Utilities |
| Commercial and Industrial | |
| Residential | |
| By T&D Voltage Level (Qualitative Analysis only) | High-Voltage Transmission (Above 230 kV) |
| Sub-Transmission (69 to 161 kV) | |
| Medium-Voltage Distribution (13.2 to 34.5 kV) | |
| Low-Voltage Distribution (Up to 1 kV) |


Key Questions Answered in the Report
How large is India’s installed power capacity in 2026?
The India power market size stands at 618.99 GW of installed capacity in 2026 and is on track for 7.62% CAGR growth toward 2031.
Which segment is expanding fastest?
Nuclear generation is scaling at a 14.38% CAGR thanks to new Kudankulam reactors and indigenous PHWR projects.
Why are commercial and industrial buyers shifting to open access?
Open-access rules let large users lock in renewable PPAs at tariffs about 20% below grid rates, cutting costs and meeting sustainability targets.
What is the main risk to continued capacity growth?
Financial stress at state DISCOMs, which owe generators over INR 1.2 trillion, threatens timely payments and new project financing.
How is storage evolving?
Battery installations totaled 2.5 GW in 2024 but could rise to 14.4 GW by 2031 as costs fall below USD 100 /kWh and ancillary-service revenue streams mature.
Which regions lead renewable deployment?
Gujarat and Rajasthan dominate solar additions, while Tamil Nadu leads in wind capacity and grid-balancing innovations.
Page last updated on:


