
Busbar Market Size and Share
Market Overview
| Study Period | 2021 - 2031 |
|---|---|
| Market Size (2026) | USD 19.22 Billion |
| Market Size (2031) | USD 25.89 Billion |
| Growth Rate (2026 - 2031) | 6.14 % |
| Fastest Growing Market | Asia-Pacific |
| Largest Market | Asia-Pacific |
| Market Concentration | Medium |
Major Players *Disclaimer: Major Players sorted in no particular order Image © Mordor Intelligence. Reuse requires attribution under CC BY 4.0. | |
Busbar Market Analysis by Mordor Intelligence
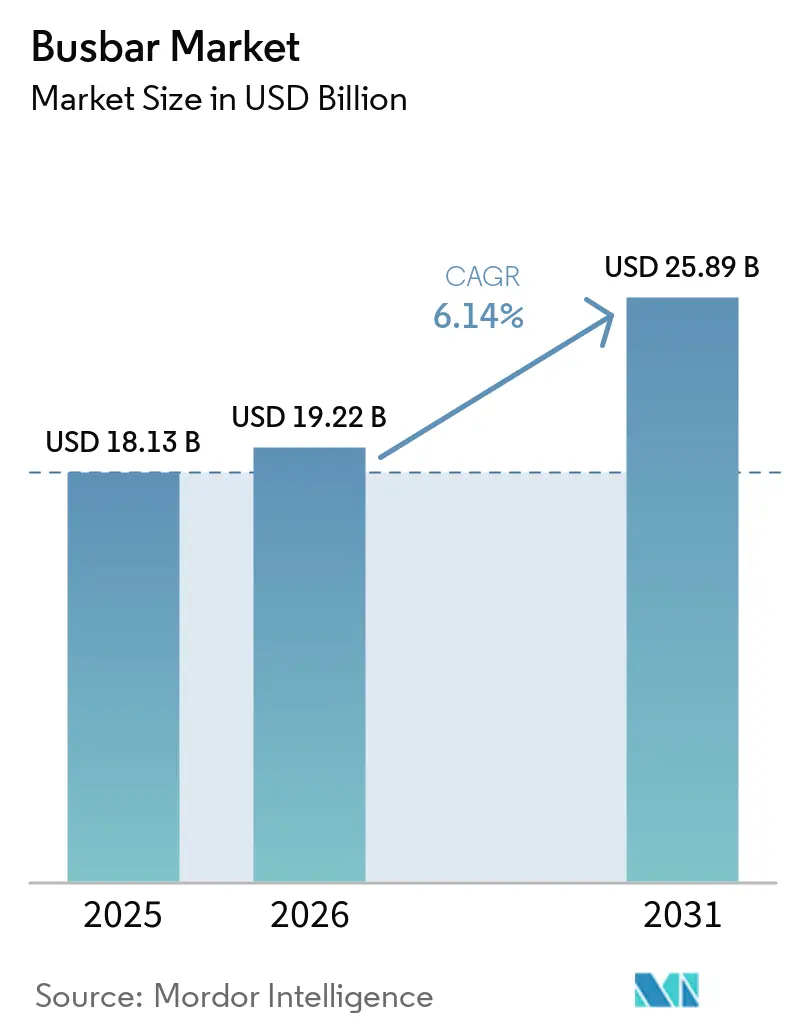
The Busbar Market size is expected to grow from USD 18.13 billion in 2025 to USD 19.22 billion in 2026 and is forecast to reach USD 25.89 billion by 2031 at 6.14% CAGR over 2026-2031. The busbar market is being supported by higher power requirements in data centers, renewable energy facilities, and automated industrial sites. New AI computing installations require denser power distribution, which favors busbar trunking systems over conventional cable layouts. Renewable projects and grid upgrades are also raising demand for reliable high-current equipment. Suppliers are responding through capacity investment, acquisitions, and product development for digital power systems. Higher copper costs and limited availability of qualified installers may delay some projects, especially where budgets and technical capabilities are constrained.
Key Report Takeaways
- By type, rigid busbars held 36.2% of the busbar market share in 2025, while laminated busbars are forecast to grow at a 7.5% CAGR through 2031.
- By material, copper accounted for 65.3% of the busbar market share in 2025, while aluminum is projected to expand at a 6.6% CAGR through 2031.
- By power rating, low power systems held 30.4% of the busbar market share in 2025, while high power systems are forecast to grow at a 7.1% CAGR through 2031.
- By end user, industrial applications held 31.3% of the busbar market share in 2025, while commercial applications are forecast to grow at a 6.8% CAGR through 2031.
- By geography, Asia-Pacific held 34.5% of the busbar market share in 2025 and is projected to expand at a 6.6% CAGR through 2031.
Note: Market size and forecast figures in this report are generated using Mordor Intelligence’s proprietary estimation framework, updated with the latest available data and insights as of January 2026.
Global Busbar Market Trends and Insights
Drivers Impact Analysis*
| Driver | (~) % Impact on CAGR Forecast | Geographic Relevance | Impact Timeline |
|---|---|---|---|
| Electrification of Data Centers, AI Infrastructure and Digital Buildings | +2.00% | Global, led by North America and APAC | Short-term (≤ 2 years) |
| Renewable-Energy and Grid-Modernization Buildout | +1.40% | Global, concentrated in APAC and Europe | Medium-term (2–4 years) |
| Industrial Electrification and Automation | +1.00% | APAC core, spill-over to Europe and North America | Medium-term (2–4 years) |
| EV Fast-Charging and High-Voltage Power Architecture | +0.80% | APAC core, North America and EU | Short-term (≤ 2 years) |
| Prefabricated Microgrids for Resilient Power Restoration | +0.30% | North America, Australia, South Asia | Medium-term (2–4 years) |
| Fire-Performance Requirements in High-Rise Construction | +0.20% | APAC high-rise markets, Europe, Middle East | Long-term (≥ 4 years) |
| Source: Mordor Intelligence | |||
Electrification of Data Centers, AI Infrastructure, and Digital Buildings
Hyperscale and AI data center construction is a major demand driver for the busbar market. Microsoft committed more than USD 80 billion to data center investment for fiscal year 2026, while Google committed USD 75 billion[1]. Large campuses need distribution equipment from transformer rooms to server halls, including the main distribution routes that serve separate computing halls and their local power equipment. Higher rack power densities have made compact and scalable distribution more important in new facilities because distribution layouts must accommodate larger electrical loads within limited floor space. Custom high-ampacity assemblies have lead times of 10 to 16 weeks, which encourages buyers to select qualified integrators with available inventory. Siemens reported EUR 1.9 billion in Smart Infrastructure data center orders in the second quarter of 2026, an increase of more than 45% from the previous year.
Data center operators also value equipment that can be installed quickly and adapted as computing loads change. This favors modular trunking systems over layouts that need extensive cable rework. The busbar market, therefore, benefits from both new construction and upgrades to existing digital facilities. The need for tested systems is especially important where downtime could affect critical computing operations. Manufacturers with certified products and established delivery channels can respond more readily to these requirements. This demand has encouraged suppliers to expand capacity in the United States and Europe.
Renewable Energy and Grid Modernization
Renewable deployment is broadening the use of busbars beyond conventional substations. Solar inverters, battery energy storage systems, and renewable collection systems require dependable high-capacity connections that can be specified for different site layouts and operating conditions. These projects also depend on equipment that can be tested and integrated with wider substation infrastructure. India reported a 35% increase in solar photovoltaic installations in 2025. The increase supports demand for busbar equipment linked to inverter strings and substation infrastructure. China issued GB/T 33346-2025 for compact insulated busways in wind-power applications, and the standard became effective in February 2026[2]. The specification indicates the growing importance of purpose-built equipment in renewable installations.
Variable solar and wind output can create harmonic loading conditions that are difficult for older installations. Asset owners may need replacement or upgraded systems when existing equipment does not meet operating requirements. The busbar market can therefore gain from both greenfield projects and renewal work in mature grids. Battery storage adds another layer of design requirements because the equipment must manage high current in a compact space. Grid modernization programs also place greater emphasis on reliability and verified performance. These factors support demand for suppliers with application engineering and compliance capabilities. They also make product selection more closely tied to a facility's operating profile, rather than to the cost of conductors alone.
Industrial Electrification and Automation
Industrial electrification supports demand for medium-power busbar systems across factories, processing sites, and semiconductor facilities. Automotive, chemical, and machinery operations need dependable distribution for motor control centers and automated production lines. Germany remains an important European demand center because of its automotive, machinery, and semiconductor base. Siemens introduced its Electrification X Asset Management system in September 2025 to use temperature and partial-discharge sensor data for predictive maintenance. The system is intended to reduce unplanned downtime in production-critical settings. Connected monitoring makes busbar systems more relevant to operators seeking better visibility of power assets.
European electrification requirements can also make upgrades part of compliance planning for heavy industry. This can shorten decision cycles compared with projects that depend only on routine capital spending. The busbar industry benefits when customers seek integrated equipment, monitoring, and energy-management support. Established integrators have an advantage because they can provide certified systems across several facilities. Industrial customers remain focused on reliability, safety, and service availability. Those priorities support demand for proven equipment even when lower-cost options are available.
EV Fast Charging and High-Voltage Power Architecture
Electric vehicle platforms are moving from 400 V to 800 V architectures, which supports demand for laminated busbars. These assemblies are used in traction inverters, battery systems, and charging equipment. High-switching power electronics need low-inductance conductor arrangements to limit voltage spikes. The supplied IEEE conference material notes that parasitic inductance must remain below 5 nanohenries in high-switching-density inverter designs. This requirement favors multilayer copper assemblies in compact traction applications. It also limits the scope for aluminum substitution where packaging and high-frequency performance are critical.
Mersen signed a multi-million-euro contract with Vulcan Energy in April 2026 for the Lionheart Project in Frankfurt. Eaton also formed a collaboration with Munich Electrification around a switchable 400 V and 800 V battery configuration system. These moves show that power distribution hardware is being developed alongside broader battery and switching systems. The busbar market is supported when vehicle and charging designs require more integrated electrical architectures. Suppliers that meet thermal, switching, and packaging requirements can address these higher-value uses.
Restraints Impact Analysis*
| Restraint | (~) % Impact on CAGR Forecast | Geographic Relevance | Impact Timeline |
|---|---|---|---|
| Copper and Aluminum Price Volatility | -1.40% | Global | Short-term (≤ 2 years) |
| High Upfront Engineering and Retrofit Cost | -0.90% | Emerging markets, MEA, South America | Medium-term (2–4 years) |
| Thermal-Runaway Exposure Under Harmonic-Rich Loads | -0.40% | Industrial APAC, data center North America | Long-term (≥ 4 years) |
| Shortage of Certified Busbar Installers in Emerging Markets | -0.40% | MEA, Southeast Asia, South America | Long-term (≥ 4 years) |
| Source: Mordor Intelligence | |||
Copper and Aluminum Price Volatility
Copper prices exceeded USD 12,000 per metric ton in early 2026, increasing cost pressure for busbar fabricators. Supply disruptions, labor issues, and stockpiling were identified as contributors to the supplied material. The International Copper Study Group estimated a refined copper deficit of 150,000 metric tons for 2026. Higher costs have shortened fixed-price quote periods to 24 to 48 hours for some fabricators. This makes procurement more difficult for projects that need long approval cycles. It also places greater pressure on smaller firms that rely on spot purchases.
Aluminum is receiving more attention in utility-grade and large-scale busway applications where more space is available. The source material cited a copper-to-aluminum price ratio of 4.3:1 in 2026, which changes the comparison that buyers make between material cost, space, and electrical performance. Aluminum can require 1.6 times the cross-section of comparable copper conductors, so its use depends on whether the installation can accommodate a larger conductor. It is less suitable for compact traction and high-frequency power-electronic applications. Larger suppliers can secure rolling smelter capacity further in advance. This difference can protect larger suppliers while reducing margins for smaller fabricators in the busbar market.
High Upfront Engineering and Retrofit Cost
Busbar trunking systems can cost more to install than conventional cable systems at the outset. Engineering, fabrication, delivery logistics, and commissioning all contribute to this cost. Brownfield projects can be especially difficult because existing structures and conduit routes add labor and design work. Emerging-market projects may face strict payback requirements from financing institutions. Under these conditions, buyers may select cable systems even when busbars have lower lifecycle costs. This limits adoption in mid-tier commercial and institutional projects.
The lengthy qualification process also adds to entry and project costs. New suppliers may need 12 months or more for prototype testing and buyer validation before receiving orders. The process reinforces the position of established suppliers in technically demanding applications. In the Middle East, Africa, and South America, specification maturity can vary across projects. Large substations, industrial sites, and hyperscale data centers can justify the upfront cost more easily. The busbar market may expand more slowly where customers lack engineering resources or established installation partners.
*Our forecasts treat driver/restraint impacts as directional, not additive. The impact forecasts reflect baseline growth, mix effects, and variable interactions.
Segment Analysis
By Type: Rigid Systems Lead While Laminated Busbars Grow Faster
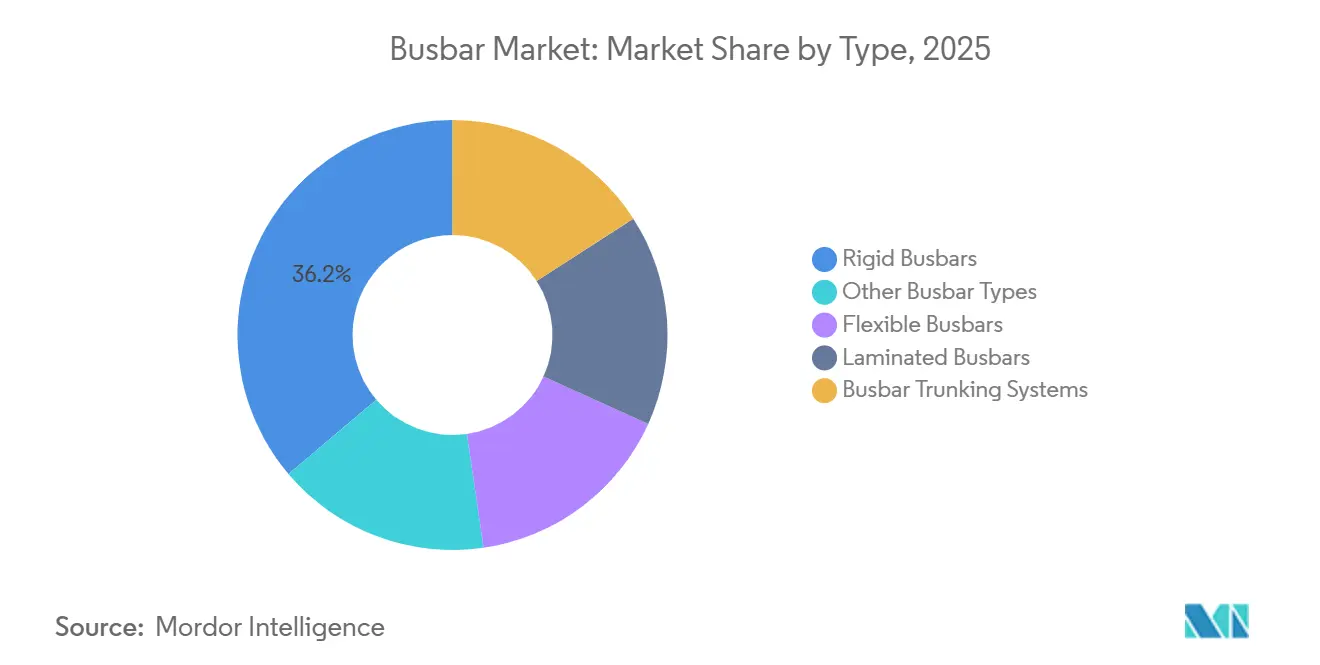
Rigid busbars held 36.2% of the busbar market share in 2025. They remain common in utility substations, industrial switchgear, and fixed commercial distribution systems. Their dimensional stability and high current capacity support their established use. These systems also offer predictable costs in applications with well-defined power requirements. Replacement cycles help sustain demand for rigid formats. Their position reflects the continued importance of standardized, high-volume installations.
Laminated busbars are forecast to expand at a 7.5% CAGR through 2031. This is the fastest growth rate among type categories in the supplied data. The busbar market size for laminated systems is supported by 800 V vehicle inverters, battery energy storage equipment, and solar inverter platforms. These applications require multilayer conductors with low inductance. Busbar trunking systems also benefit from data center and large-building construction. Flexible busbars remain important for connection-level uses in switchgear and transformer terminals. The type mix combines high-volume established products with faster-growing engineered formats.

By Material: Copper Holds the Largest Position and Aluminum Gains Use
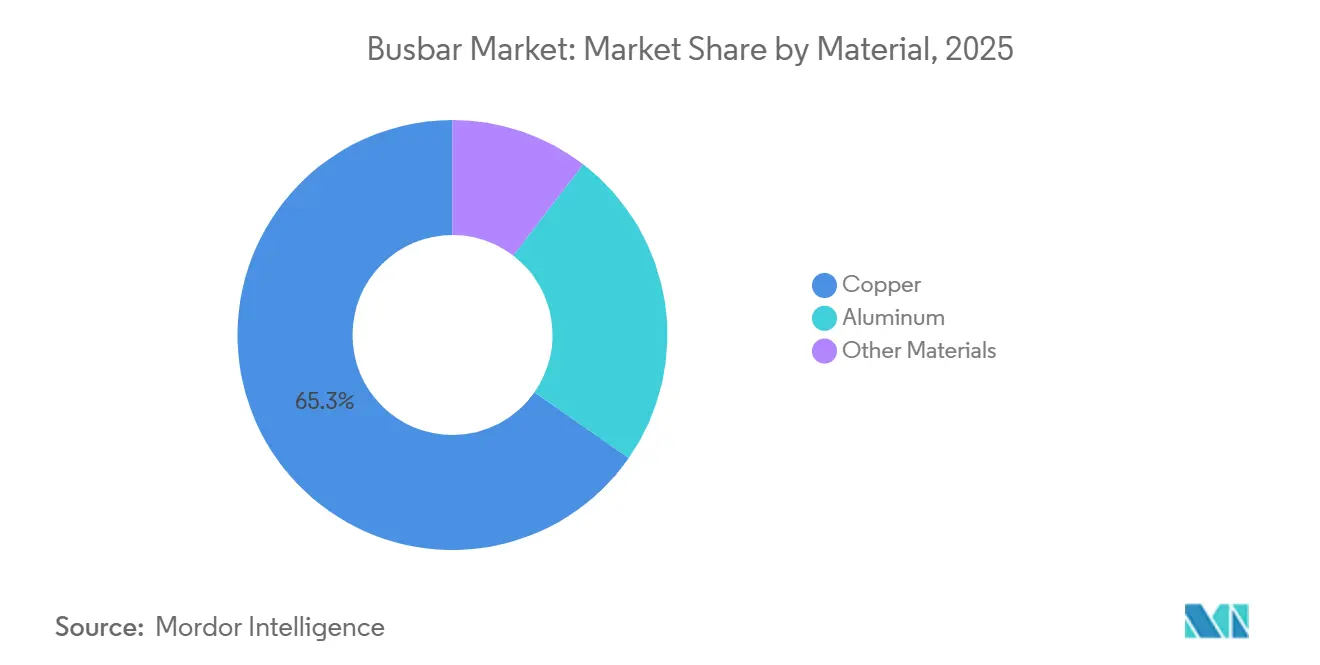
Copper held 65.3% of the material segment by value in 2025. Its conductivity was identified as 100% IACS in the supplied material. Copper also provides a compact cross-section for high-power-density installations. Data center busways and traction systems rely on these performance characteristics. Joint integrity is another important factor in high-current applications. Copper, therefore, remains the primary material for demanding installations.
Aluminum is forecast to grow at a 6.6% CAGR through 2031. The busbar market size for aluminum benefits where a larger conductor cross-section is acceptable. Utility distribution, renewable collection buses, and long commercial busway runs are suitable applications. Its cost position becomes more attractive when copper prices rise. Automotive electrification has also helped normalize aluminum wiring technologies for engineering teams. Copper-graphene composite laminations were described in US Patent 12646808 as exceeding 120% IACS conductivity. Other materials remain small in commercial terms but may influence future specifications.
By Power Rating: Low Power Has the Largest Base and High Power Grows Faster
Low power systems below 125 A held 30.4% of the busbar market share in 2025. Lighting distribution, final distribution boards, and small-panel uses create a broad installed base. These applications support recurring volume across commercial and residential settings. Low power products serve many routine electrical distribution requirements. Their demand is less dependent on a single project class. This breadth explains the segment's leading 2025 position.
High power systems above 800 A are projected to grow at a 7.1% CAGR through 2031. Data center main feeders, industrial motor control centers, renewable substations, and fast-charging hubs support this demand. The source material described applications with ratings up to 6,300 A. Certified high-current systems can command a premium where power reliability is essential. Improvements in aluminum extrusion and sandwich insulation can help high-power trunking fit dense buildings. Medium-power systems from 125 A to 800 A continue to serve HVAC starters, commercial boards, and production lines. These developments can strengthen busbar adoption across different load requirements.
By End User: Industrial Applications Lead and Commercial Uses Accelerate
Industrial applications held 31.3% of the busbar market share in 2025. Heavy machinery, oil refining, chemicals, and workshop operations form the core demand base. Busbars are widely used where facilities need reliable high-current distribution. New installations increasingly include monitoring and predictive maintenance capabilities. These features can raise the value of industrial systems. Industrial demand remains important even as other end-user categories grow more quickly.
Commercial applications are forecast to grow at a 6.8% CAGR through 2031. Data centers, airports, large retail sites, and smart office buildings are key settings. Operators in these facilities need flexible power distribution and high uptime. Utility projects remain specialized because reliability and asset life drive purchasing decisions. Battery storage integration adds to the technical requirements for utility systems. Godrej & Boyce reported an INR 2,600 crore project pipeline for fiscal year 2026, equal to USD 313 million, spanning transmission infrastructure and railway electrification. Residential demand remains a smaller contributor and is linked mainly to large multifamily projects.
Geography Analysis
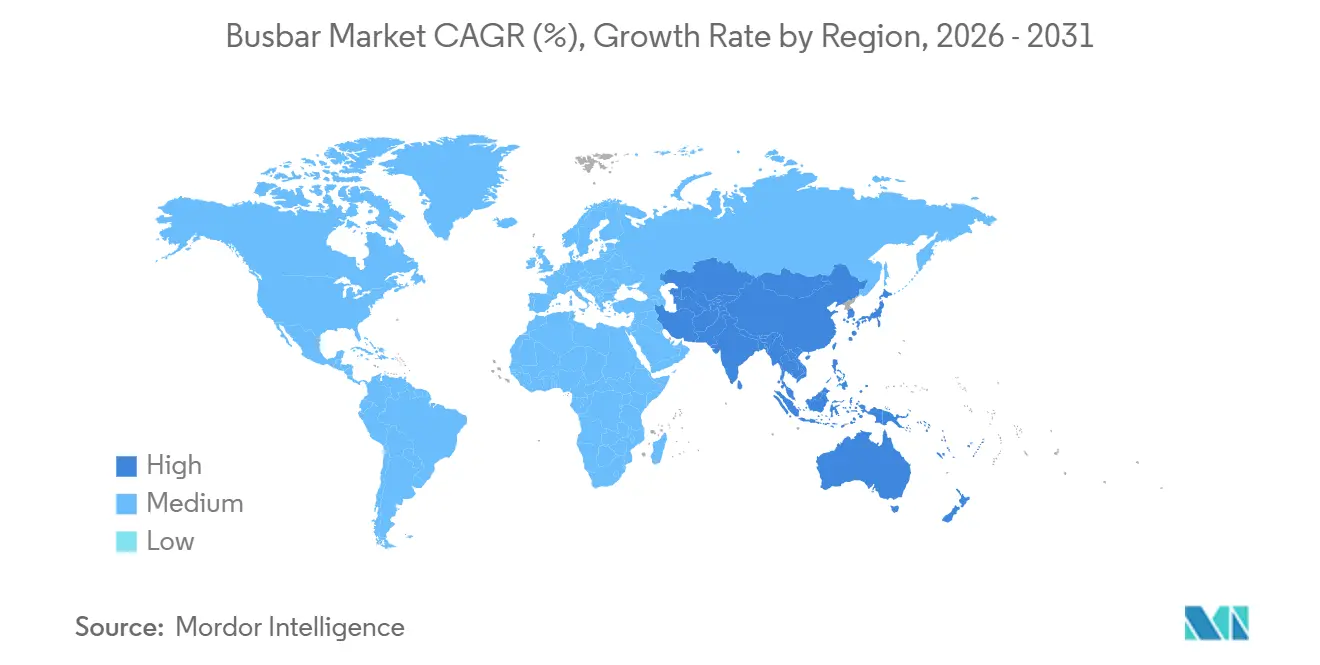
Asia-Pacific held 34.5% of the busbar market share in 2025 and is forecast to grow at a 6.6% CAGR through 2031. China supports regional demand through its industrial base, renewable installations, and electric vehicle fleet. The supplied data placed China at 30% to 35% of Asia-Pacific demand by value. India adds demand through solar expansion and manufacturing investment. Manufacturing foreign direct investment exceeded USD 25 billion in recent years. Vietnam, Thailand, and Indonesia are also supported by electronics, semiconductor, and industrial investment. The busbar market in the region is shaped by both local production growth and expanding infrastructure requirements.
North America is mature but continues to grow through data center construction, grid upgrades, and charging infrastructure. Microsoft and Google investment plans are creating concentrated demand in major U.S. data center corridors. Siemens announced more than USD 200 million for facilities in Georgia and Texas in September 2026[3]. Schneider Electric announced more than USD 700 million in U.S. manufacturing investment through 2027. Capacity limits rather than weak demand are the key constraint in the region. Canada and Mexico add industrial demand through mining electrification and near-shoring activity.
Europe is supported by industrial competitiveness and energy-transition requirements. Germany is the largest European demand center in the supplied material because of automotive, machinery, and semiconductor production. Schneider Electric announced a EUR 150 million investment in France in September 2026 to consolidate production in Dijon and open a new facility in Evreux. Middle East and Africa are projected to grow at 6% to 8%, led by Saudi infrastructure projects, UAE data centers, and South African grid rehabilitation. South America is growing at a measured pace, with Brazil and Chile providing demand through data center investment and mining electrification. Regional differences in installation skills and project financing continue to influence adoption across the busbar market.
Competitive Landscape
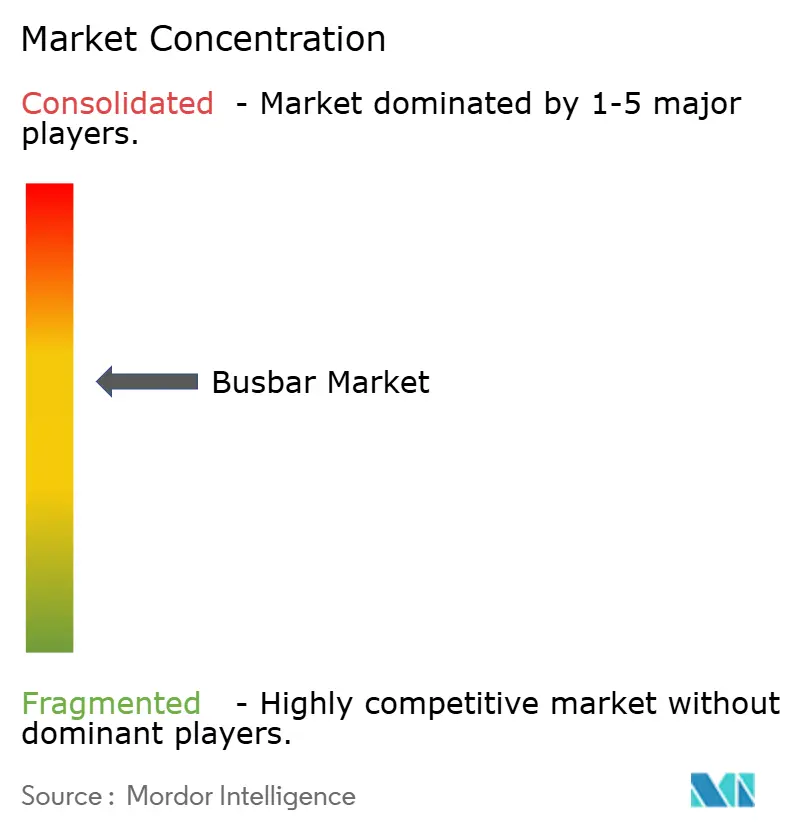
The busbar market is moderately consolidated, with Schneider Electric, Siemens, ABB, Eaton, and Legrand holding a major share of global shipments in 2026. Their portfolios span applications from 25 A lighting trunking to 6,300 A feeder systems, enabling them to serve routine distribution as well as high-current facilities. Their ability to support several product categories can also matter to buyers seeking a common supplier across a large project. IEC qualification requirements create a meaningful entry barrier for new suppliers. Prototype testing and buyer validation can take more than 12 months. This supports incumbent positions in data centers and other mission-critical facilities. Competition is based on certified product range, delivery capacity, engineering support, and service capability.
Siemens is expanding capacity through organic investment. It announced EUR 300 million for electrical manufacturing capacity in Germany in July 2026. It also announced more than USD 200 million for U.S. manufacturing facilities in September 2026. Legrand has taken an acquisition-led approach, acquiring Power Bus Way in 2024, Linkk Busway Systems in 2025, and Kratos Industries in 2026[4]. These acquisitions added data center capabilities across North America, Asia-Pacific, and Europe.
Regional companies in India, Turkey, and South Korea compete through local engineering support and price. C&S Electric, Larsen & Toubro, and Godrej & Boyce are active in Indian projects. The middle market in South and Southeast Asia offers scope for pre-engineered trunking packages with commissioning services. Siemens' digital asset management offering also reflects the role of monitoring in supplier differentiation. Advanced materials remain another competitive area, as shown by TE Connectivity's copper-graphene busbar patent. The busbar market continues to favor suppliers that combine product certification, manufacturing reach, and application-specific design support. These capabilities help suppliers address the distinct requirements of utility, industrial, commercial, transport, and digital infrastructure projects across many installation environments and operating conditions.
Busbar Industry Leaders
-
Schneider Electric SE
-
Eaton Corporation plc
-
ABB Ltd.
-
Siemens AG
-
Legrand SA
- *Disclaimer: Major Players sorted in no particular order
Recent Industry Developments
- September 2026: Siemens announced more than USD 200 million in two new U.S. manufacturing facilities in Pendergrass, Georgia, and Grand Prairie, Texas, adding more than 1,500 jobs for low-voltage electrical infrastructure products used in AI data centers and critical power distribution.
- September 2026: Schneider Electric announced a EUR 150 million investment in France, equal to USD 175 million, consolidating manufacturing at Dijon and opening a facility in Evreux.
- July 2026: Siemens announced a EUR 300 million investment in expanded electrical manufacturing in Germany, with 700 new jobs targeted by 2030.
- July 2026: nVent leased an additional 160,000 square foot facility in Blaine, Minnesota, for data center liquid cooling capacity.
Global Busbar Market Report Scope
A busbar is a rigid or flexible electrical conductor, typically made of copper or aluminum, used to collect, distribute, and transmit electrical power within electrical systems. Busbars are commonly installed in switchboards, switchgear, distribution panels, substations, data centers, industrial facilities, and power distribution systems. They provide a low-resistance path for carrying high electrical currents and can replace multiple cables, simplifying electrical distribution, improving space utilization, and enhancing system reliability.
The Global Busbar Market is segmented by type, material, power rating, end user, and geography. By type, the market is segmented into rigid busbars, flexible busbars, laminated busbars, busbar trunking systems, and other busbar types. By material, the market is segmented into copper, aluminum, and other materials. By power rating, the market is segmented into below 125 A, 125–800 A, and above 800 A. By end user, the market is segmented into utilities, industrial, commercial, residential, transportation, and other end users. The report also covers the market size and forecasts for the global busbar market across 26 countries in key regions. For each segment, the market sizing and forecasts have been provided on the basis of value (USD).
| Rigid Busbars |
| Flexible Busbars |
| Laminated Busbars |
| Busbar Trunking Systems |
| Other Busbar Types |
| Copper |
| Aluminum |
| Other Materials |
| Low Power – Below 125 A |
| Medium Power – 125–800 A |
| High Power – Above 800 A |
| Utilities |
| Industrial |
| Commercial |
| Residential |
| Transportation |
| Other End Users |
| North America | United States |
| Canada | |
| Mexico | |
| Europe | Germany |
| France | |
| Italy | |
| Spain | |
| United Kingdom | |
| Poland | |
| Russia | |
| Rest of Europe | |
| Asia-Pacific | China |
| India | |
| Japan | |
| South Korea | |
| Australia | |
| Indonesia | |
| Vietnam | |
| Thailand | |
| Rest of Asia-Pacific | |
| South America | Brazil |
| Argentina | |
| Chile | |
| Rest of South America | |
| Middle East and Africa | Saudi Arabia |
| United Arab Emirates | |
| Egypt | |
| South Africa | |
| Morocco | |
| Rest of Middle East and Africa |
| By Type | Rigid Busbars | |
| Flexible Busbars | ||
| Laminated Busbars | ||
| Busbar Trunking Systems | ||
| Other Busbar Types | ||
| By Material | Copper | |
| Aluminum | ||
| Other Materials | ||
| By Power Rating | Low Power – Below 125 A | |
| Medium Power – 125–800 A | ||
| High Power – Above 800 A | ||
| By End User | Utilities | |
| Industrial | ||
| Commercial | ||
| Residential | ||
| Transportation | ||
| Other End Users | ||
| By Geography | North America | United States |
| Canada | ||
| Mexico | ||
| Europe | Germany | |
| France | ||
| Italy | ||
| Spain | ||
| United Kingdom | ||
| Poland | ||
| Russia | ||
| Rest of Europe | ||
| Asia-Pacific | China | |
| India | ||
| Japan | ||
| South Korea | ||
| Australia | ||
| Indonesia | ||
| Vietnam | ||
| Thailand | ||
| Rest of Asia-Pacific | ||
| South America | Brazil | |
| Argentina | ||
| Chile | ||
| Rest of South America | ||
| Middle East and Africa | Saudi Arabia | |
| United Arab Emirates | ||
| Egypt | ||
| South Africa | ||
| Morocco | ||
| Rest of Middle East and Africa | ||
Key Questions Answered in the Report
What is driving demand for busbar systems?
Data center construction, renewable energy installations, industrial electrification, and EV power architecture support demand for busbar systems.
How large is the busbar market in 2026?
The busbar market size is USD 19.22 billion in 2026 and is forecast to reach USD 25.89 billion by 2031 at a 6.14% CAGR.
Which busbar type is growing the fastest?
Laminated busbars are forecast to grow at a 7.5% CAGR through 2031, supported by EV, storage, and solar inverter applications.
Why does copper remain important in busbar manufacturing?
Copper held 65.3% of material value in 2025 because high-power-density applications require its conductivity and compact cross-section.
Which region leads busbar demand?
Asia-Pacific held 34.5% in 2025 and is forecast to grow at a 6.6% CAGR through 2031.
What limits adoption of busbar trunking systems?
Higher upfront engineering and retrofit costs, metal-price volatility, installation skill gaps, and harmonic-load risks can slow adoption.