Market Overview
| Study Period | 2021 - 2031 |
|---|---|
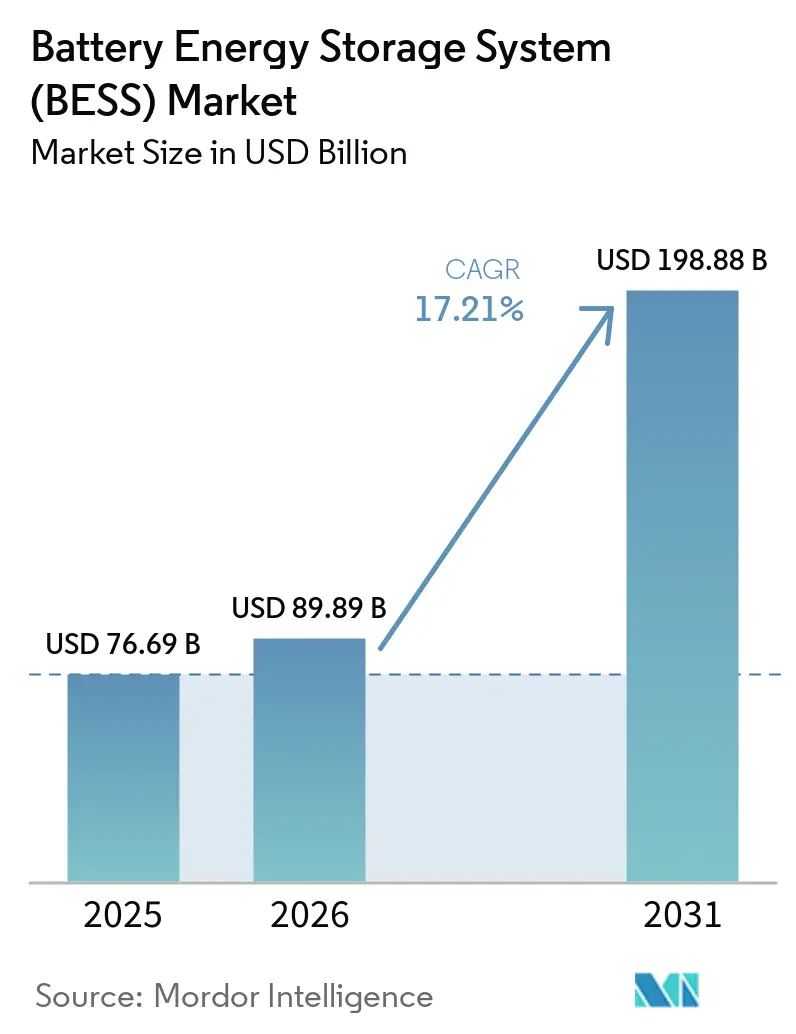
| Market Size (2026) | USD 89.89 Billion |
| Market Size (2031) | USD 198.88 Billion |
| Growth Rate (2026 - 2031) | 17.21% CAGR |
| Fastest Growing Market | Middle East and Africa |
| Largest Market | Asia Pacific |
| Market Concentration | Medium |
Major Players *Disclaimer: Major Players sorted in no particular order Image © Mordor Intelligence. Reuse requires attribution under CC BY 4.0. | |
Battery Energy Storage System (BESS) Market Analysis by Mordor Intelligence
The Battery Energy Storage System market size is expected to grow from USD 76.69 billion in 2025 to USD 89.89 billion in 2026 and is forecast to reach USD 198.88 billion by 2031 at 17.21% CAGR over 2026-2031.
Rapid cost declines in lithium-ion cells, supportive procurement mandates, and rising grid-modernization spending are turning large-scale storage from a niche reliability tool into mainstream infrastructure. Policy tailwinds such as the Inflation Reduction Act in the United States and the Net-Zero Industry Act in the European Union have anchored multi-gigawatt project pipelines, while grid-forming inverter requirements are expanding revenue streams beyond energy arbitrage. Simultaneously, price parity for solar-plus-storage power purchase agreements (PPAs) in Australia and Chile proves that four-hour batteries can offer firm, evening-peak supply at competitive rates. Growing data-center electricity demand and politically driven supply-chain reshoring further reinforce the sector’s momentum.
Key Report Takeaways
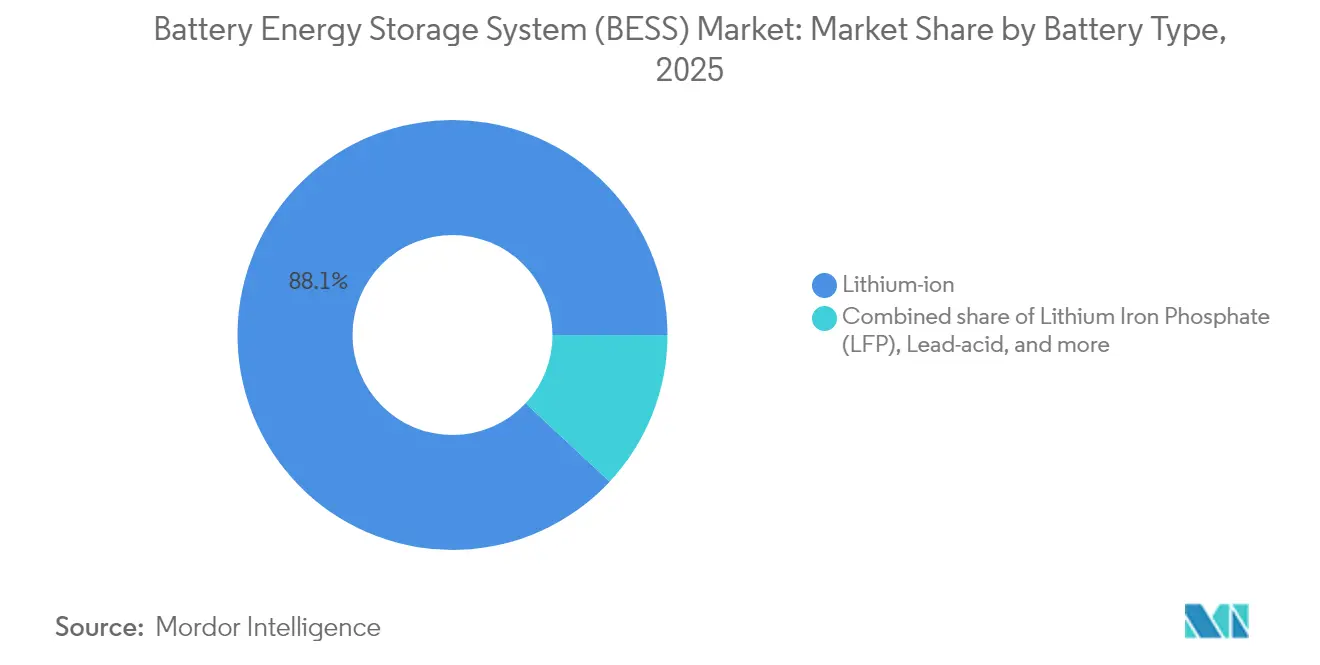
- By battery type, lithium-ion commanded 88.05% of the battery energy storage system market share in 2025, while Lithium Iron Phosphate (LFP) is projected to expand at a 18.62% CAGR through 2031.
- By connection type, on-grid installations held a 77.35% share of the battery energy storage system market in 2025; off-grid applications are the fastest-growing segment at 18.04% CAGR.
- By component, battery packs, and racks represented 62.25% revenue share in 2025; energy-management software is advancing the fastest, at 19.41% CAGR.
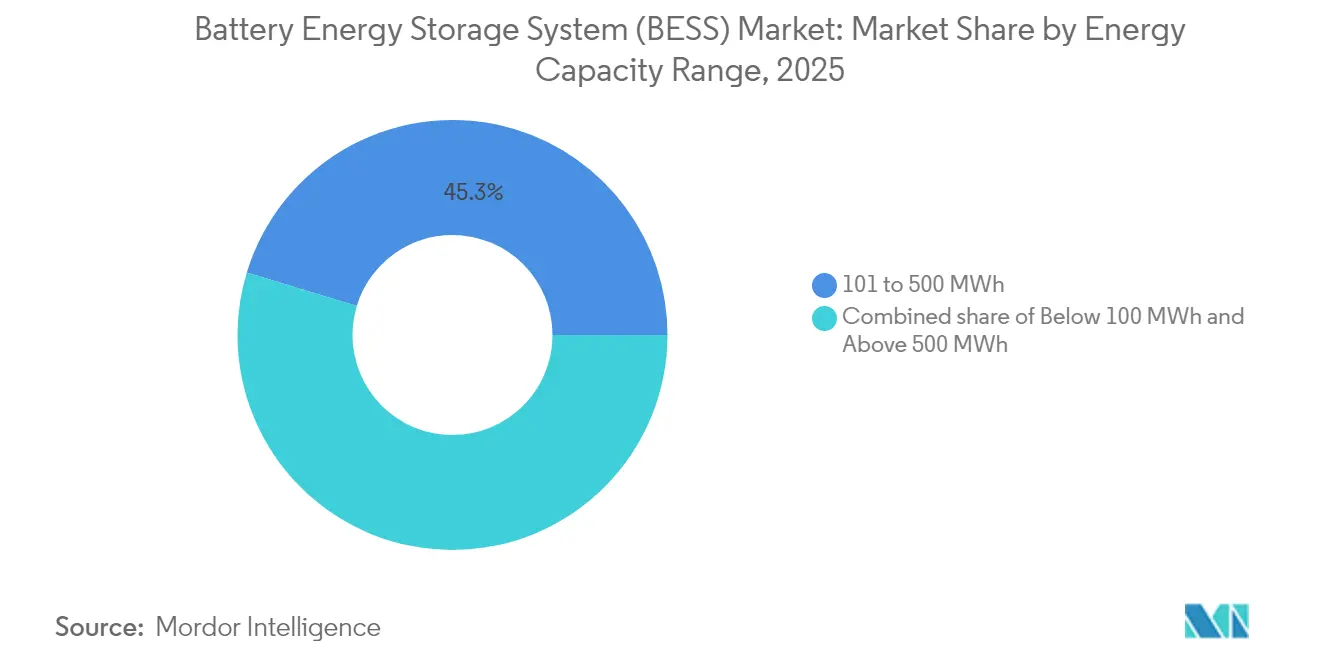
- By energy-capacity range, projects sized 101–500 MWh captured 45.30% of the battery energy storage system market size in 2025, yet installations above 500 MWh are forecast to lead growth at an 17.84% CAGR.
- By end-user application, utility-scale systems accounted for 56.30% of the battery energy storage system market size in 2025, whereas residential deployments are expected to grow at 18.97% CAGR to 2031.
- By region, Asia-Pacific held 49.85% of the battery energy storage system market share in 2025, while the Middle East and Africa region is projected to expand at a 19.07% CAGR through 2031.
Note: Market size and forecast figures in this report are generated using Mordor Intelligence’s proprietary estimation framework, updated with the latest available data and insights as of 2026.
Global Battery Energy Storage System (BESS) Market Trends and Insights
Drivers Impact Analysis*
| Driver | (~) % Impact on CAGR Forecast | Geographic Relevance | Impact Timeline |
|---|---|---|---|
| Utility-Scale Procurement Mandates in U.S., China & EU Accelerating Gigawatt-Scale Orders | +3.2% | North America, China, EU | Medium term (2-4 years) |
| Grid-Forming Inverter Requirements Unlocking Co-Location Value Stacks | +2.8% | Global, with early gains in Australia, Netherlands | Short term (≤ 2 years) |
| PV-Plus-Storage PPA Price Parity in Australia & Chile | +2.1% | Australia, Chile, spill-over to LATAM | Medium term (2-4 years) |
| EU & U.S. Battery Supply-Chain Acts Creating Domestic Manufacturing Pull-Through | +1.9% | North America & EU | Long term (≥ 4 years) |
| Data-Center & AI Load Growth Driving 4-Hr Storage Demand in North America | +1.7% | North America, expanding to APAC | Short term (≤ 2 years) |
| Second-Life EV Battery Availability Reducing CapEx in Asia | +1.4% | APAC core, spill-over to MEA | Medium term (2-4 years) |
| Source: Mordor Intelligence | |||


Utility-scale procurement mandates in the United States, China, and the European Union
Mandated procurements are reshaping the BESS market development landscape. California’s long-duration solicitation targets 2 GW, Power China tender seeks 16 GWh, and South Korea awarded 540 MW/3,240 MWh, giving developers visibility on revenue and bankability(1). In Europe, the Net-Zero Industry Act incentivizes domestic content, while recent Chinese reforms removed rigid allocation rules, letting market fundamentals guide economics. Such programs lower financing costs and channel volume to qualified integrators who meet grid-service performance guarantees.
Grid-forming inverter adoption unlocking co-location value
Moving from grid-following to grid-forming architectures lets batteries deliver synthetic inertia and voltage support, services that grid operators historically procured from synchronous generation. Transgrid’s study showing 4.8 GW of grid-forming needs and Fluence’s 300 MW Australian project highlight commercial viability. European operator TenneT foresees 5.2–12.7 GW storage by 2030, underscoring broad applicability. Added revenue from inertia products and strengthened interconnection terms improve project economics and favor hybrid solar-storage development, in the BESS market.
PV-plus-storage PPA price parity in Australia and Chile
Four-hour batteries paired with solar now hit evening-peak tariffs once dominated by gas peakers. Australia’s Capacity Investment Scheme guarantees floor prices for dispatchable renewables in the BESS market, while Chile’s capacity-payment reforms reward hybrid assets. In California, 98% of proposed solar is hybrid; the demonstration effect accelerates storage uptake in similar high-irradiance markets.
EU and US supply-chain acts catalyzing domestic manufacturing
The Inflation Reduction Act’s credits and the EU legislation are spurring USD 150 billion of announced North American battery factories and dozens of European gigafactory plans. Fluence’s Utah module plant and LG Energy Solution’s Ohio complex illustrate friend-shoring trends. While reshoring raises near-term component costs, it mitigates geopolitical risk linked to China’s 90% dominance in graphite processing.
Restraints Impact Analysis*
| Restraint | (~) % Impact on CAGR Forecast | Geographic Relevance | Impact Timeline |
|---|---|---|---|
| Lithium & Graphite Processing Bottlenecks in Indonesia and Africa | -2.3% | Global, concentrated in Indonesia, Africa | Medium term (2-4 years) |
| Fire-Safety Code Tightening (UL-9540A, NFPA-855) Inflating Balance-of-Plant Costs | -1.8% | North America, expanding globally | Short term (≤ 2 years) |
| Long Interconnection Queues in U.S. ISOs Delaying FTM Project Revenues | -1.5% | North America | Medium term (2-4 years) |
| High Interest-Rate Environment Compressing Merchant Revenue Stacks | -1.2% | Global | Short term (≤ 2 years) |
| Source: Mordor Intelligence | |||
Lithium and graphite processing bottlenecks
China processes 90% of global graphite, and Indonesia’s nickel export bans push domestic refining, introducing concentration risk(2). Material shortages threaten cell production just as multi-gigawatt auctions surge in the BESS market. Start-ups such as Group14 are piloting silicon-rich anodes, but commercial volumes remain years away. Recycling programs can ease primary demand, yet logistic hurdles limit immediate impact for utility-scale projects that require high-purity inputs.
Fire-safety code tightening under UL-9540A and NFPA-855
Following several high-profile incidents, U.S. jurisdictions require full-scale thermal-runaway testing, dedicated fire suppression, and wider separation distances. Compliance inflates balance-of-plant costs and lengthens permitting in space-constrained sites. Although added expenses may slow certain behind-the-meter rollouts, stricter codes bolster insurer confidence and pave the way for wider BESS market institutional adoption, mitigating long-term reputational risk.
*Our forecasts treat driver/restraint impacts as directional, not additive. The impact forecasts reflect baseline growth, mix effects, and variable interactions.
Segment Analysis
By Battery Type: Market pivots toward safer chemistries
Lithium-ion maintained 88.05% battery energy storage system market share in 2025. Yet LFP’s cost and thermal-stability advantages drive its 18.62% CAGR, exemplified by BYD’s 40 GWh 2024 installations. NMC chemistries remain relevant where energy density matters, while vanadium flow and sodium-ion technologies attract niche interest for long-duration or high-cycle use. Lithium-ion variants' battery energy storage system market size is projected to widen as scaling lowers per-kilowatt-hour costs. Diversification across chemistries reduces supply-chain risk and opens project financing to asset-specific hedging structures.
Implementation tactics vary by region. Chinese players offer ultra-low-priced LFP racks, European utilities test sodium-ion for cold-weather resilience, and U.S. grid operators pilot zinc-bromine flow batteries for eight-hour services. These parallel pathways illustrate how chemistry choice is increasingly optimized for duty cycle rather than a one-size-fits-all paradigm.


By Connection Type: Grid-tied dominance with microgrid acceleration
On-grid systems captured 77.35% of 2025 deployments, supported by standardized interconnection and robust merchant revenue opportunities. The off-grid segment, however, is accelerating at 18.04% CAGR owing to rural electrification and industrial resilience requirements. Pakistan’s import projection of 8.75 GWh by 2030 typifies emerging-market demand for microgrids that bypass weak national infrastructure.
Hybrid configurations that switch between grid and islanded mode are a rising subset in the BESS market, offering customers demand-charge reduction plus backup power. These flexible assets partake in wholesale markets through virtual-power-plant aggregation, a trend now codified in several U.S. independent system operators’ tariff updates.
By Component: Hardware scale, software value
Battery packs and racks accounted for 62.25% of 2025 revenue, reflecting raw-material intensity. Yet, energy-management software is the fastest-growing component at 19.41% CAGR as machine-learning algorithms unlock multi-service revenue stacking. The battery energy storage system market size allocated to EMS is forecast to expand as asset owners discover that dispatch optimization can raise net present value more than incremental hardware upgrades.
Integrators now bundle predictive maintenance, nodal-price forecasting, and state-of-health analytics, blurring the line between software and services. Vertical integration strategies—LG Energy Solution’s “cells-to-system” model or Tesla’s Autobidder platform—seek lifetime customer lock-in.
By Energy Capacity Range: Mid-scale sweet spot, gigawatt frontier
Installations sized 101–500 MWh held 45.30% of deployments in 2025. Utilities value this bracket for substation-level support and manageable construction timelines. Projects exceeding 500 MWh, though only 15.90% of 2025 capacity, are expanding at 17.84% CAGR based on procurement mandates and cost economies.
The battery energy storage system market share for the >500 MWh class is expected to accelerate as developers chase fewer, larger tenders to streamline permitting and financing. However, gigawatt-hour projects require sophisticated coordination with transmission operators and can strain local grid stability if control systems lag, reinforcing the importance of grid-forming functionality.
By End-User Application: Utility leadership amid residential surge
Utility-scale assets delivered 56.30% of 2025 revenue in the BESS market, but residential systems are set to grow at 18.97% CAGR through 2031, led by European markets where rooftop solar penetrations exceed 20%. Variability in feed-in tariffs and the quest for self-consumption drive household adoption. The battery energy storage system industry also sees commercial and industrial users leveraging storage for peak-shaving and power-quality assurance.
Incentive structures differ: Germany grants investment subsidies, Japan offers capacity-market payments, and several U.S. states allow demand-response enrollment. Product design likewise diverges, with stackable 5–15 kWh modules for homes and containerized 2–4 MWh units for distribution-level utility customers.
Geography Analysis
Utility-scale assets delivered 56.30% of 2025 revenue in the BESS market, but residential systems are set to grow at 18.97% CAGR through 2031, led by European markets where rooftop solar penetrations exceed 20%. Variability in feed-in tariffs and the quest for self-consumption drive household adoption. The battery energy storage system industry also sees commercial and industrial users leveraging storage for peak-shaving and power-quality assurance.
The Middle East and Africa are the fastest-growing regions in the BESS market at 19.07% CAGR. Saudi Arabia’s 7.8 GW partnership with Sungrow and Egypt’s 200 MWh AfDB-financed project illustrate large-scale commitments. South Africa’s 1 GW awards highlight how storage addresses chronic grid instability. Moreover, the United Arab Emirates integrates 19 GWh with a 5.2 GW solar plant, pioneering baseload renewables in desert climates.
North America and Europe continue to post high absolute volumes in the battery energy storage system market. The United States hosts USD 100 billion in announced investments but suffers four-year interconnection queues for 2,600 GW of projects. Europe’s Net-Zero Industry Act seeks to localize supply chains, yet over half of announced gigafactories face financing delays. Regional policy diversity—capacity markets in the United Kingdom, fleet mandates in Italy, and production credits in Canada—produces a mosaic of revenue models that sophisticated developers arbitrage.


Competitive Landscape
The market is moderately fragmented in the battery energy storage system market. Fluence posted a USD 5.1 billion backlog in 2025, leveraging project execution credentials and proprietary bidding software. BYD’s cost-focused strategy floods Asian tenders with low-priced LFP racks, challenging Western integrators. Chinese state-owned conglomerates such as Power China submit multi-gigawatt bids that redefine global price floors.
Vertical integration is rising in the battery energy storage system market. LG Energy Solution bundles cells, racks, and software under long-term service agreements. Tesla scales megapack capacity via its Shanghai facility, locking in off-take through corporate power-purchase contracts. New entrants target differentiated niches: Natron Energy backs sodium-ion for data centers, while ESS Inc. commercializes iron-flow chemistry for eight-hour applications.
Software is becoming the key battleground for BESS companies in the global market. Suppliers market AI-driven dispatch platforms that predict nodal congestion, regulate frequency within milliseconds, and prolong battery life via adaptive cycling. Integrators lacking proprietary code risk margin erosion as hardware commoditizes. Strategic alliances-Fluence with Amazon Web Services or Sungrow with Huawei Digital Power-underline the convergence of energy and cloud computing.
Battery Energy Storage System (BESS) Industry Leaders
Contemporary Amperex Technology Co. Ltd. (CATL)
BYD Company Limited
Tesla Inc.
LG Energy Solution Ltd.
Samsung SDI Co. Ltd.
- *Disclaimer: Major Players sorted in no particular order

Recent Industry Developments
- June 2025: Sungrow received orders from Toshiba Energy Systems for a 100 MW/351 MWh system at SGET Sapporo, one of Japan’s largest storage projects.
- May 2025: Samsung C&T filed plans for a 320 MWh BESS in New South Wales under Australia’s EPBC Act.
- April 2025: LG Energy Solution won a 1 trillion-won contract with Omron for over 2 GWh LFP batteries bound for Japan.
- March 2025: Gentari chose Fluence’s AI platform for a 172 MW/408 MWh hybrid project in Australia


Research Methodology Framework and Report Scope
Market Definitions and Key Coverage
Our study defines the battery energy storage system (BESS) market as all grid-connected or behind-the-meter installations that use rechargeable battery packs, integrated power-conversion equipment, and energy-management software to store electricity and release it on demand.
Scope exclusion: Mechanical storage (pumped hydro, flywheel, compressed-air) and capacitor-based devices are not counted in this revenue pool.
Segmentation Overview
- By Battery Type
- Lithium-ion
- Lithium Iron Phosphate (LFP)
- Nickel-Manganese-Cobalt (NMC)
- Lead-acid
- Others [Flow Batteries (Vanadium, Zinc-Br), Sodium-based (NaS, Na-ion)]
- By Connection Type
- On-Grid (Utility Interconnected)
- Off-Grid (Micro-Grid, Hybrid)
- By Component
- Battery Pack and Racks
- Power Conversion System (PCS)
- Energy Management Software (EMS)
- Balance-of-Plant and Services
- By Energy Capacity Range
- Below 100 MWh
- 101 to 500 MWh
- Above 500 MWh
- By End-user Application
- Residential
- Commercial and Industrial
- Utility
- By Geography
- North America
- United States
- Canada
- Mexico
- Europe
- United Kingdom
- Germany
- France
- Spain
- Nordic Countries
- Russia
- Rest of Europe
- Asia-Pacific
- China
- India
- Japan
- South Korea
- Malaysia
- Thailand
- Indonesia
- Vietnam
- Australia
- Rest of Asia-Pacific
- South America
- Brazil
- Argentina
- Colombia
- Rest of South America
- Middle East and Africa
- United Arab Emirates
- Saudi Arabia
- South Africa
- Egypt
- Rest of Middle East and Africa
- North America
Detailed Research Methodology and Data Validation
Primary Research
Mordor analysts interviewed utilities, project developers, residential installer networks, and battery integrators across North America, Europe, and Asia Pacific. Discussions clarified typical system prices, expected procurement pipelines, chemistry preferences, and regulatory pain points, allowing us to reconcile desk findings and close data gaps.
Desk Research
We begin with structured pulls from tier-1 public sources such as the International Energy Agency, the U.S. Energy Information Administration, International Renewable Energy Agency, Eurostat, and national regulators that publish battery project registries. Trade associations (Battery Storage Association, SolarPower Europe), customs data, peer-reviewed journals, and company filings supply shipment, cost, and policy insights. For corporate intelligence, we rely on D&B Hoovers, Dow Jones Factiva, and Questel patent analytics to gauge competitive intensity. These references anchor baseline volume, price, and policy variables; many additional publicly available documents were also consulted for corroboration.
Market-Sizing & Forecasting
A top-down model converts country-level cumulative and annual additions (MWh) into revenue using region-specific average system prices, which are then stress-tested with selective bottom-up checks such as supplier roll-ups and channel ASP × shipment snapshots. Key inputs include lithium price indices, installed solar and wind capacity, incentive structures like the U.S. 30% ITC, learning-rate driven cost decline curves, and capacity utilization factors. Multivariate regression captures how these drivers influence demand, while scenario analysis frames upside or downside cases. Where bottom-up evidence lags, for example, in nascent flow-battery projects, gap fillers use analog markets and validated primary insights.
Data Validation & Update Cycle
Outputs pass variance screening against independent datasets, peer review by a senior analyst panel, and anomaly resolution before sign-off. Reports refresh every twelve months, and we trigger interim updates after material policy, price, or project-pipeline shifts so clients receive the freshest view.
Why Mordor's Battery Energy Storage System Baseline Commands Reliability
Published BESS values rarely align because firms choose different chemistries, project size thresholds, and pricing assumptions. We disclose scope choices up front and update models the moment policy or cost curves move, which is why decision-makers trust our baseline.
Key gap drivers include competitors limiting coverage to containerized systems only, using historical average selling prices without forward-learning adjustments, or freezing exchange rates for the whole forecast window. By contrast, Mordor Intelligence revises inputs quarterly, folds software and services revenue, and blends current-year spot and contract prices.
Benchmark comparison
| Market Size | Anonymized source | Primary gap driver |
|---|---|---|
| USD 76.69 Billion | Mordor Intelligence | - |
| USD 50.81 Billion | Global Consultancy A | Hardware-only scope; omits EMS and O&M revenue |
| USD 32.63 Billion | Trade Journal B | Counts projects above 1 MW and applies 2023 ASPs, excluding residential & C&I segments |
These comparisons show that scope breadth, price updates, and refresh cadence explain most disparities, and they underline why our disciplined, transparent approach delivers a balanced, reproducible baseline.


Key Questions Answered in the Report
What is the battery energy storage system market worth in 2026?
The market is valued at USD 89.89 billion in 2026.
How fast is the BESS Industry expected to grow?
It is projected to expand at a 17.21% CAGR, reaching USD 198.88 billion by 2031.
Which battery chemistry is growing the fastest?
Lithium Iron Phosphate (LFP) is the fastest-growing chemistry, advancing at a 18.62% CAGR through 2031.
Which region currently dominates the battery energy storage system market, and which is growing the quickest?
Asia-Pacific holds 49.85% of 2025 revenue, while the Middle East and Africa is forecast to grow the fastest at a 19.07% CAGR.
What policies are propelling expansion?
Key drivers include utility-scale procurement mandates, the U.S. Inflation Reduction Act, and the EU Net-Zero Industry Act, all of which underpin multi-gigawatt project pipelines.
What are the main barriers to deployment?
Supply-chain constraints in lithium and graphite processing and tighter fire-safety codes (UL-9540A, NFPA-855) are the leading restraints, adding cost and complexity to new projects.
Page last updated on:


