
Building Integrated Photovoltaic (BIPV) Market Size and Share
Market Overview
| Study Period | 2021 - 2031 |
|---|---|
| Market Size (2026) | USD 16.66 Billion |
| Market Size (2031) | USD 47.02 Billion |
| Growth Rate (2026 - 2031) | 23.06 % |
| Fastest Growing Market | Asia Pacific |
| Largest Market | Asia Pacific |
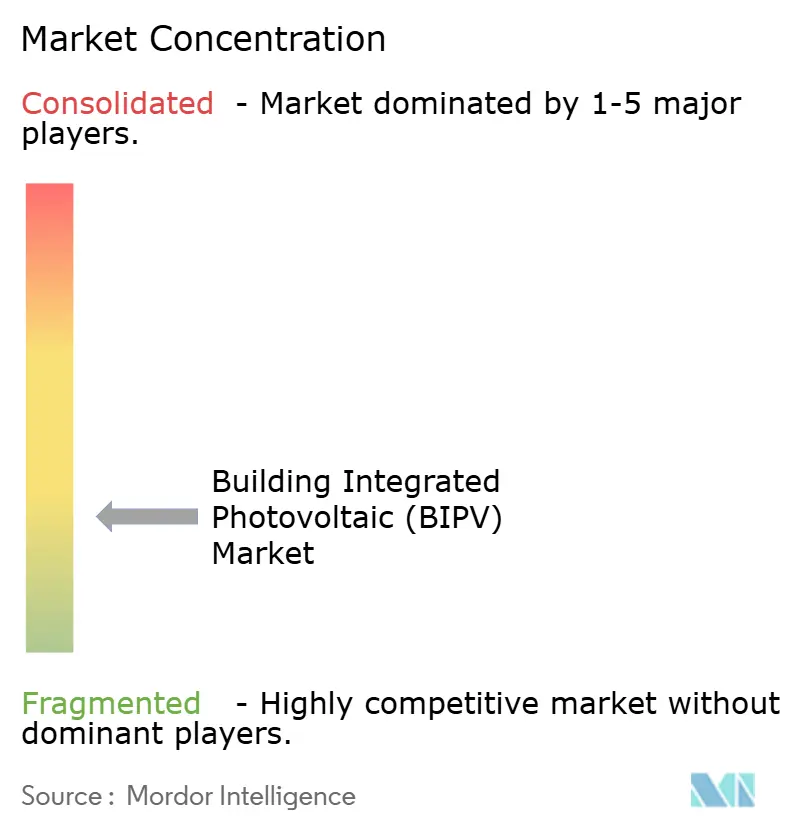
| Market Concentration | Low |
Major Players *Disclaimer: Major Players sorted in no particular order Image © Mordor Intelligence. Reuse requires attribution under CC BY 4.0. | |
Building Integrated Photovoltaic (BIPV) Market Analysis by Mordor Intelligence
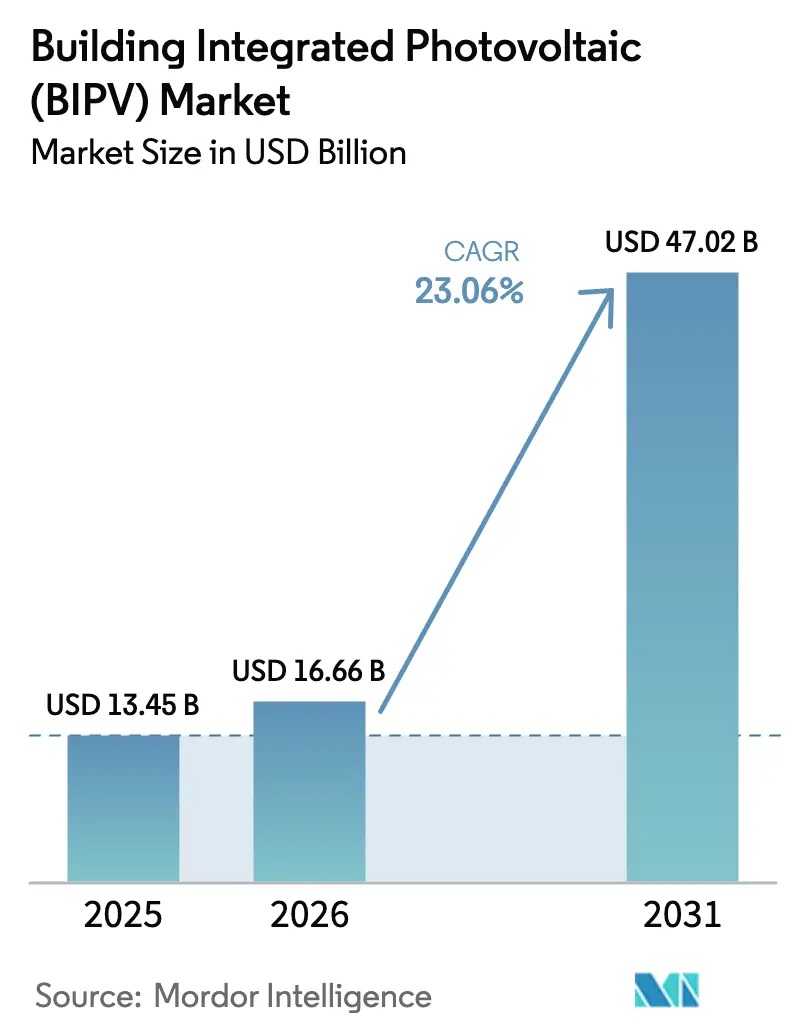
The Building Integrated Photovoltaic Market size is projected to be USD 13.45 billion in 2025, USD 16.66 billion in 2026, and reach USD 47.02 billion by 2031, growing at a CAGR of 23.06% from 2026 to 2031.
The growth trajectory is anchored in zero-carbon building codes, corporate net-zero pledges, and rapid progress in perovskite-silicon tandem cells that raise output without enlarging roof or façade footprints. Lower balance-of-system costs, faster permitting cycles in China and the EU, and insurer acceptance of UL 1703-compliant mounting kits are compressing payback periods to 7-9 years in high-irradiance markets. Developers now specify solar-ready curtain walls at the concept stage, viewing photovoltaic skins as load-bearing components rather than rooftop accessories. Competitive intensity remains moderate, giving architects latitude to choose between crystalline panels, thin-film laminates, or transparent glazing while securing multi-supplier bids that keep module prices on a downward slope.
Key Report Takeaways
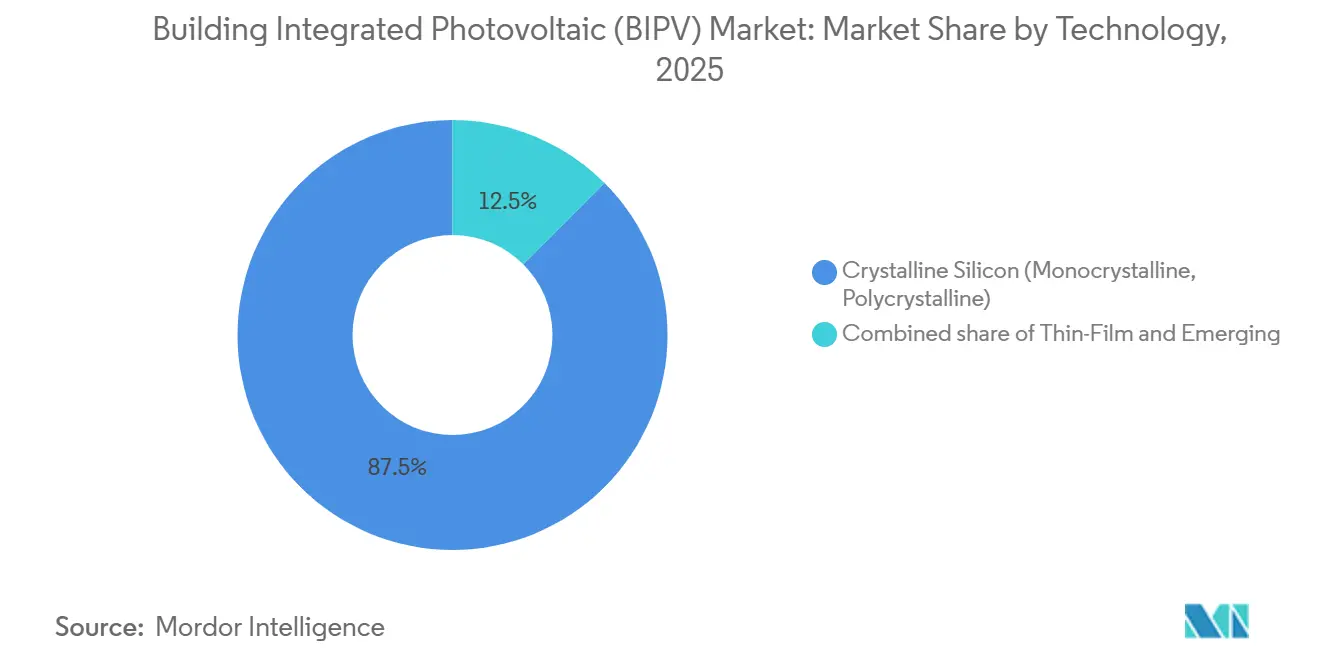
- By technology, crystalline silicon retained 87.5% of 2025 installations, while perovskite and tandem architectures are forecast to post a 27.5% CAGR to 2031, making them the fastest advancing segment.
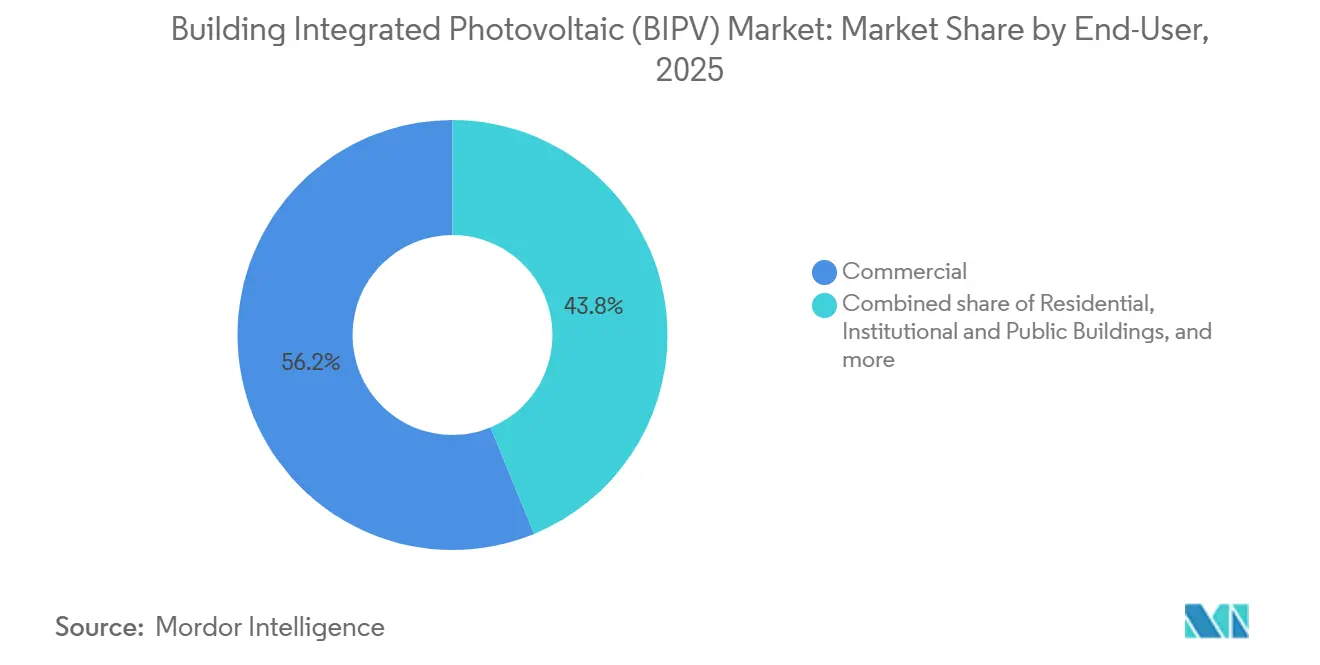
- By end-user, commercial buildings captured 56.2% revenue in 2025 and are poised to expand at a 24.6% CAGR through 2031, leading demand across all application groups.
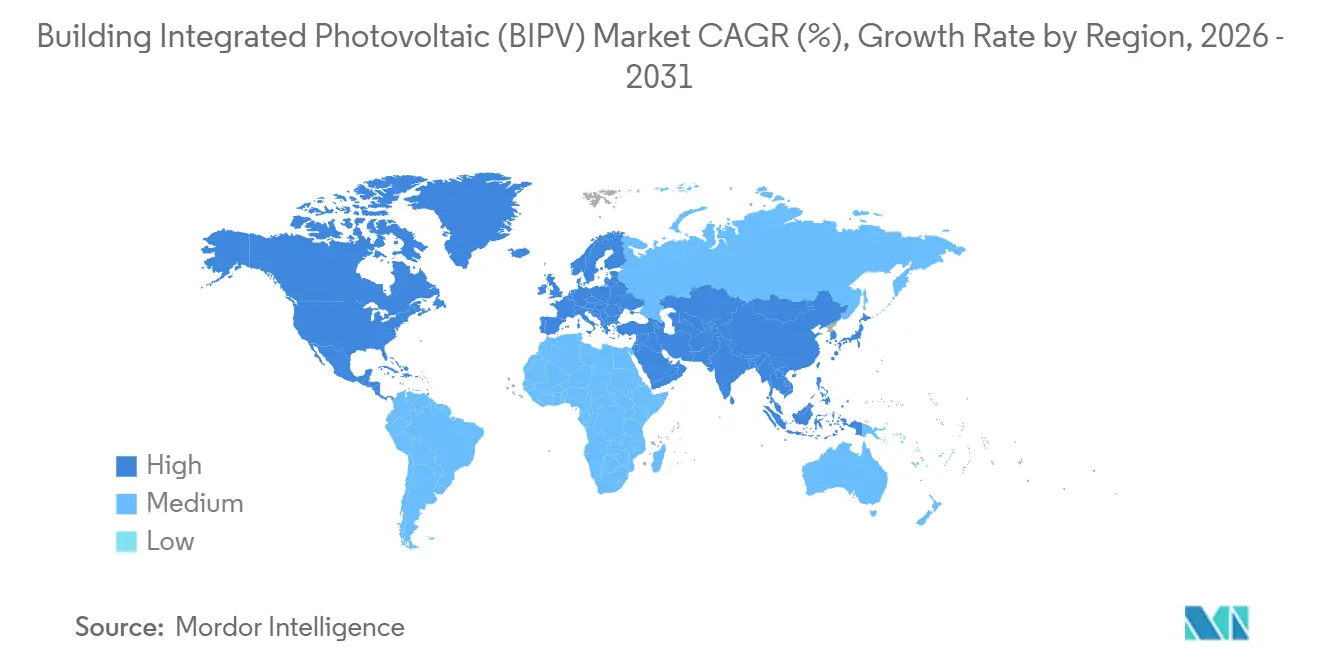
- By geography, Asia-Pacific captured 40.7% of the building-integrated photovoltaic (BIPV) market in 2025 and is set to grow at 23.8% annually up to 2031.
Note: Market size and forecast figures in this report are generated using Mordor Intelligence’s proprietary estimation framework, updated with the latest available data and insights as of January 2026.
Market Trends and Insights
Drivers Impact Analysis of Building Integrated Photovoltaic (BIPV) Market*
| Driver | (~) % Impact on CAGR Forecast | Geographic Relevance | Impact Timeline |
|---|---|---|---|
| Supportive policy incentives and zero-carbon building mandates | +6.2% | Europe, North America, China | Medium term (2-4 years) |
| Declining PV and balance-of-system costs | +5.8% | Global, early gains in Asia-Pacific and Middle East | Short term (≤ 2 years) |
| Rising demand for net-zero and smart-city developments | +4.5% | Urban centers across APAC, EU, North America | Medium term (2-4 years) |
| Growth of façade-integrated transparent PV glass | +3.1% | Europe, North America, premium commercial segments in APAC | Long term (≥ 4 years) |
| Corporate ESG and green-building certification pressures | +2.9% | Global, led by multinational headquarters in North America and Europe | Short term (≤ 2 years) |
| 5G-ready rooftop infrastructure synergy | +1.1% | Urban APAC, North America, select Middle-East smart cities | Medium term (2-4 years) |
| Source: Mordor Intelligence | |||
Supportive Policy Incentives & Zero-Carbon Building Mandates
Europe’s Energy Performance of Buildings Directive 2024/1275 requires solar-ready roofs on all new structures by 2030, and phased retrofits for public buildings above 250 square meters now begin in 2027.[1]European Commission, “Energy Performance of Buildings Directive 2024/1275,” ec.europa.eu Germany’s KfW 442 program earmarked EUR 500 million in 2025 to subsidize 10-30% of installed costs, while France extended MaPrimeRénov grants up to EUR 11,000 for integrated façades. China’s whole-county solar mandate, covering 676 counties by late 2025, obliges new industrial rooftops to host on-site generation or purchase renewable certificates, effectively guaranteeing a pipeline for the Building Integrated Photovoltaic (BIPV) market.[2]National Development and Reform Commission of China, “Whole-County Distributed Solar Initiative,” ndrc.gov.cn These rules shorten permitting cycles, train specialist installers, and shift BIPV from a discretionary upgrade to a code requirement. As more jurisdictions transpose similar directives, developers front-load solar envelopes into schematic designs to avoid costly redesigns later in the approval process.
Declining PV & Balance-of-System Costs
Monocrystalline PERC modules dropped to USD 0.12 per watt in mid-2025, and competitive pressure among inverter suppliers trimmed electronics pricing by 18% year-on-year. Standardized curtain-wall kits released by AGC and NSG/Pilkington cut on-site labor by 25% by integrating junction boxes and weather seals at the factory. Transparent PV glass still costs 20-40% more than low-E glazing, but high-rent developers recoup premiums by monetizing electricity and reducing mechanical-penthouse congestion. In the Gulf, the levelized cost of BIPV electricity fell below retail tariffs in 2025, enabling subsidy-free adoption where irradiance tops 2,200 kWh/m²/yr. As BOS manufacturers scale, the Building Integrated Photovoltaic (BIPV) market enjoys price elasticity that opens mid-tier commercial projects previously priced out of integrated solar façades.
Rising Demand for Net-Zero / Smart-City Developments
Multinational tenants now embed net-zero clauses in leasing contracts, pressuring landlords to integrate on-site renewables or lose premium occupants. Amazon targets 5 GW of self-generation by 2030, while Google pursues 24/7 carbon-free electricity across its campuses.[3]Amazon.com Inc., “Sustainability Report 2025,” sustainability.amazon.com Smart-city masterplans in NEOM, Masdar City, and Singapore’s Tengah district specify 100% renewable energy, with BIPV the de facto option when land for ground arrays is scarce. Rooftops hosting 5G micro-cells now generate rental income that lifts project IRRs 1.5-2.5 percentage points in dense cores. These converging forces create reliable demand signals that underpin long-term supply agreements between module makers and real-estate developers.
Growth of Façade-Integrated Transparent PV Glass
Semi-transparent perovskite cells reached 17.7% efficiency at 12% visible transmittance in 2025 laboratory tests. Onyx Solar delivered 300 façade projects across Europe by end-2025, showing that amorphous-silicon and CdTe laminates can meet thermal-insulation codes without external shading. Transparent BIPV blocks infrared radiation, cutting HVAC demand 15-20% in glass-heavy towers and offsetting its premium within 10-12 years. Heritage buildings embrace the solution to comply with renewable mandates without altering skylines, and tenant surveys report 8-10% higher comfort scores after installations. As tandem perovskite-silicon variants near 25-year warranty certification, the Building Integrated Photovoltaic (BIPV) market gains a technology that blends daylighting with megawatt-scale generation.
Restraints Impact Analysis of Building Integrated Photovoltaic (BIPV) Market*
| Restraint | (~) % Impact on CAGR Forecast | Geographic Relevance | Impact Timeline |
|---|---|---|---|
| High initial installation and design complexity | -3.7% | Global, acute in retrofit markets across North America and Europe | Short term (≤ 2 years) |
| Structural and fire-safety code barriers | -2.4% | North America, Europe, select APAC jurisdictions with stringent building codes | Medium term (2-4 years) |
| Limited skilled installers and façade-engineering know-how | -2.1% | Global, most severe in North America, emerging APAC markets, and South America | Medium term (2-4 years) |
| Supply-chain constraints for specialty BIPV glass | -1.8% | Global, with bottlenecks concentrated in Europe and North America for low-iron tempered glass | Short term (≤ 2 years) |
| Source: Mordor Intelligence | |||
High Initial Installation & Design Complexity
BIPV requires tight coordination among structural, electrical, and façade teams, yet few general contractors offer that integrated workflow. New York and California demand separate approvals for structural load, interconnection, and fire egress, pushing soft costs 12-18% above rooftop arrays and stretching timelines by up to six months.[4]New York City Department of Buildings, “Solar Permitting Guide 2025,” nyc.gov Custom curtain-wall integration can add EUR 550-850/m² to budgets, nudging cost-conscious developers toward cheaper carports. Insurers levy 5-15% premiums until inspectors confirm UL 1703 and IEC 61730 compliance, reflecting caution over water ingress and rapid-shutdown reliability. A talent bottleneck compounds risks: fewer than 2,000 certified installers operate in North America, leading developers to import European crews at USD 800/day, which erodes project margins until local training accelerates.
Structural / Fire-Safety Code Barriers
Retrofitting curtain walls with crystalline panels adds 15-25 kg/m², obliging costly structural assessments and occasional tenant relocations. German and French fire authorities stipulate 1.2-m clearance from egress windows and rapid-shutdown inverters de-energizing within 10 seconds, cutting usable façade area 10-15% and raising BOS spend. Japan’s seismic code demands wind-tunnel testing for façade loads above 20 kg/m², prolonging approval by 8-12 weeks. These localized requirements fragment the global product mix, preventing module makers from enjoying economy-of-scale production runs. Until standards bodies harmonize protocols, the Building Integrated Photovoltaic (BIPV) market must budget region-specific engineering, delaying the ultimate cost convergence with conventional glass façades.
*Our forecasts treat driver/restraint impacts as directional, not additive. The impact forecasts reflect baseline growth, mix effects, and variable interactions.
Building Integrated Photovoltaic (BIPV) Market Segment Analysis
By Technology:
Crystalline Dominance Faces Emerging DisruptionCrystalline silicon commanded 87.5% of 2025 volume, equating to the largest Building Integrated Photovoltaic (BIPV) market share, yet perovskite-silicon tandems are set to erode that lead with a 27.5% CAGR to 2031. LONGi’s Hi-MO 9 hit 24.92% efficiency, reinforcing silicon’s high-wattage advantage, while First Solar’s Series 7 CdTe maintained output in high-temperature warehouses. Still, laboratory tandem cells at 29.1% efficiency have spurred pilot façades across Europe, indicating looming parity. Early field data from Heliatek’s organic films suggest 25-year durability is attainable, undermining the perception that flexible modules are short-life novelties. The Building Integrated Photovoltaic (BIPV) market now offers architects a spectrum from rigid, high-density panels to light organic rolls, allowing project teams to match substrate, weight, and aesthetics. Supply-chain nuances matter: low-iron glass shortages can stall crystalline projects, whereas polymer-substrate tandems bypass that constraint. Once IEC 61215 certification reaches perovskite modules in 2027, financing barriers will fall, and crystalline players may confront accelerated share loss.
Second-generation thin films occupy a middle ground. CdTe, CIGS, and amorphous silicon demonstrate lower temperature coefficients, which protects yield in desert climates, yet their energy density still trails top-tier mono-PERC. As module prices slide, thin films pivot to niche value, curved skylights, heritage façades, and ultra-light tensile roofs, rather than head-to-head wattage battles. OEMs are investing in hybrid lines that laminate perovskite coatings onto crystalline wafers, chasing efficiency gains without radical factory retools. The outcome will decide whether silicon defends incumbency or concedes premium architectural projects to newer chemistries within the Building Integrated Photovoltaic (BIPV) market.



By End-User:
Commercial Leadership Driven by ESG MandatesCommercial real-estate owners generated 56.2% of 2025 demand and will grow at 24.6% through 2031, a pace that keeps them the Building Integrated Photovoltaic (BIPV) market size front-runner among user groups. LEED v5 now deducts points for high-carbon façades unless offset by on-site renewables, effectively making integrated solar a ticket to Platinum ratings. Developers tap sustainability-linked loans that trim interest rates 25-75 basis points when carbon thresholds are met, turning BIPV from a cost center to a financing lever. Class-A offices also monetize prestige; tenants pay 3-5% rent premiums for verified net-zero space, a margin that funds façade upgrades without extending payback.
Residential uptake lags despite strong French and German incentives, mainly due to fragmented ownership structures, longer municipal permitting, and homeowner unfamiliarity with maintenance. Tesla’s Solar Roof V3.5 tackles aesthetics but still targets affluent households. Industrial facilities occupy a pragmatic middle tier, locking in electricity costs for cold-storage depots and desert-based warehouses where peak-day tariffs bite margins. Public buildings trail but will accelerate as the EU and several U.S. states enforce net-zero procurement rules from 2027. Singapore’s SolarNova airport project showcased how anchor public contracts de-risk supply chains, encouraging private follow-on deals and expanding the overall Building Integrated Photovoltaic (BIPV) market.
By Building Element:
Rooftop Dominance with Façade InnovationRooftop systems continue to dominate because pitch and orientation deliver the highest energy-to-cost ratios, especially when integrated as weatherproof membranes. Façade solutions are the fastest riser, fuelled by transparent and coloured glass that meets aesthetic review boards while monetising otherwise passive surfaces. The AUE Basel project installed 167 kW across 1,141 m² of façades, meeting 45,000 kWh yearly demand without infringing heritage guidelines. Window and skylight products now secure low-U-value glazing while producing power, reducing HVAC loads, and lighting glare simultaneously. Dynamic shading devices like Solskin track the sun, cutting HVAC consumption up to 80% and adding generation capacity on balconies and louvres. Frankfurt Airport’s 17.4 MW vertical array shows that even non-optimal orientations are viable at scale when land is scarce.
Geography Analysis
APAC Building Integrated Photovoltaic (BIPV) Market
Asia-Pacific controlled 40.7% of global volume in 2025 and is forecast to grow 23.8% annually through 2031, protecting its leadership in the Building Integrated Photovoltaic (BIPV) market. China’s 676-county solar mandate guarantees continuous demand, while Japan’s feed-in tariff revision rewards self-consumption, lifting rooftop economics. Shenzhen obliges commercial buildings above 5,000 m² to install BIPV skins, funneling orders to domestic giants LONGi, Trina, and Risen. India sets 300 GW solar by 2030 with a carved-out BIPV target for government facilities, but heterogeneous state codes and a shortage of façade engineers slow roll-out. ASEAN pilots, led by Singapore’s Tengah district, mandate solar-ready roofs on 42,000 homes, showing scalability once policy clarity arrives.
Europe Building Integrated Photovoltaic (BIPV) Market
Europe ranks second, propelled by the Energy Performance of Buildings Directive. Germany, France, and Spain underwrite 30-50% of project costs, while Sweden’s carbon tax above EUR 100/tCO₂ steers lifecycle economics toward integrated solar. The United Kingdom’s Future Homes Standard pushes residential developers to adopt BIPV from 2025, though post-Brexit labor shortages inflated installer wages 12-15% after 2024. Nordic daylight fluctuations complicate annual yield but spur interest in high-efficiency tandem panels that offset seasonal lows. Altogether, supportive incentives anchor a predictable pipeline that multinationals use to trial cross-border procurement strategies within the Building Integrated Photovoltaic (BIPV) market.
North America and MEA Building Integrated Photovoltaic (BIPV) Market
North America’s expansion clusters in California, New York, and parts of Canada, where updated net-metering and 30% federal ITC compress payback to 8-10 years. California’s Title 24 extends solar mandates to commercial buildings over 10,000 ft², triggering façade retrofits on older stock. New York’s Climate Act compels municipal property managers to offset 70% of electricity with renewables by 2030, driving state contracts toward BIPV façades. The Middle East and Africa remain nascent yet promising, with NEOM and Masdar City embedding solar skins in master plans that target 100% renewable supply. High irradiance above 2,200 kWh/m²/yr offers sub-6-year payback even without subsidies, positioning the region as the next growth pole for the Building Integrated Photovoltaic (BIPV) market.

Regulatory Landscape
Building-integrated photovoltaics sits at the intersection of building codes and electrical standards. As a result, compliance is usually governed by a mix of construction-product rules and PV safety requirements. In the EU, the recast Energy Performance of Buildings Directive (EU) 2024/1275 creates solar obligations for buildings and sets a key policy milestone with the Member State transposition deadline on May 29, 2026. It tightens the link between building-permit pathways and solar integration for new public and non-residential buildings above 250 m2, where permit applications are submitted after December 31, 2026.
Globally, product and system conformity continues to center on BIPV-specific standards such as IEC 63092. In North America, compliance often relies on listing and labeling requirements for BIPV roofing products, with UL 7103 referenced through model building codes. This standards stack affects insurer acceptance, fire-safety review, and interconnection sign-off, and it increases the need for manufacturers to provide documentation that satisfies both the authority having jurisdiction (building officials) and electrical inspectors within the same project timeline.
Competitive Landscape
Top-five suppliers captured around 35% of 2025 revenue, leaving a long tail of regional specialists, glazing innovators, and façade engineering firms. Tier-one crystalline producers, Hanwha Q-Cells, Canadian Solar, LONGi, and Trina, adapt bifacial and half-cut cells for vertical orientation, but still sell mainly through EPCs rather than architects who influence early design. Onyx Solar and Ertex Solartechnik thrive in heritage retrofits where aesthetic clearance outweighs pure wattage, commanding premiums insulated from commodity price swings. Heliatek’s organic films, weighing under 500 g/m², unlock tensile roofs that crystalline modules cannot mount safely, broadening the Building Integrated Photovoltaic (BIPV) market to stadiums and membrane structures.
Strategic moves in 2025 underline an innovation race. Hanwha’s Q.ANTUM NEO platform at 22.8% efficiency pairs with pre-certified façade kits that cut labor by 20%. LONGi scaled Hi-MO 9 after Fraunhofer certification at 24.92% efficiency, aligning with China’s distributed solar program. Tesla bundled Solar Roof V3.5 with 71.67 kWh Powerwall 3 storage, enabling three-day off-grid autonomy for upscale residences. Canadian Solar’s TOPBiHiku7 achieved 740-W output, targeting low-light northern markets. Patent filings reveal AGC and Pilkington prototyping switchable-tint BIPV glazing that could command 40-50% premiums in WELL-certified offices, hinting at functional convergence of daylight control and power generation.
Barriers to entry persist. IEC 61730 and UL 1703 certification runs 12-18 months and costs millions, deterring start-ups. Supply-chain bottlenecks for low-iron glass constrain capacity expansions, while perovskite encapsulation technology remains proprietary and closely guarded. Yet ample whitespace remains in rapid-shutdown electronics, lightweight substrates, and modular plug-and-play façades. Overall, the Building Integrated Photovoltaic (BIPV) market balances incumbent scale with niche differentiation, creating a competitive equilibrium that rewards both volume efficiency and architectural customization.
Building Integrated Photovoltaic (BIPV) Industry Leaders
Onyx Solar Energy SL
AGC Inc.
Nippon Sheet Glass (Pilkington)
Solaria Corporation
Ertex Solartechnik GmbH
- *Disclaimer: Major Players sorted in no particular order
Building Integrated Photovoltaic (BIPV) Market Companies Covered in this Report
- Onyx Solar Energy SL
- AGC Inc.
- Nippon Sheet Glass (Pilkington)
- Ertex Solartechnik GmbH
- Solaria Corporation
- Sunovation GmbH
- Mitrex Inc.
- Changzhou Almaden Co. Ltd.
- NanoPV Solar Inc.
- Tesla Inc.
- First Solar Inc.
- Sharp Corporation
- Hanwha Q-Cells
- Canadian Solar Inc.
- LONGi Green Energy
- Trina Solar Ltd.
- Risen Energy Co. Ltd.
- Waaree Energies Ltd.
- Heliatek GmbH
- Ascent Solar Technologies
Read Analysis of Building Integrated Photovoltaic (BIPV) Companies

Market Opportunities and Future Outlook
Europe's compliance-driven demand creates whitespace for suppliers that can package BIPV as a construction-ready solution, including documentation, factory-integrated junction boxes, and façade-system compatibility that reduces on-site labor and supports faster permitting. EPBD 2024/1275 supports that shift by turning solar from a discretionary upgrade into a building-permit condition for key new-build segments, while the retrofit base remains large as structural and fire-safety constraints continue to favor lightweight glazing-based BIPV formats and post-installable solutions.
Commercial and public-building projects also suggest a scalable path through repeatable envelope systems and standardized procurement. Recent 2026 activity points to this: CapMan Real Estate completed a 7,500 m2 integrated solar roof at Stationsparken, Glostrup, generating 589,000 kWh annually, and ML System secured a BIPV module contract for the 108-metre Oslo Spektrum skyscraper with integration into WICONA unitized façade systems. In Asia-Pacific, partnerships focused on local certification and product qualification, including LONGi and SG Energy targeting Korean Standards certification, highlight opportunities for BIPV suppliers to industrialize compliance testing and provide region-specific certified bill-of-materials for façade and rooftop integration.
Recent Industry Developments in Building Integrated Photovoltaic (BIPV) Market
- June 2026: AGC joined a nearly ZEB retrofit demonstration project in Malaysia led by NEDO and SEDA, supplying Low-E and BIPV glass for an office-building retrofit. The project links BIPV glazing with regulated energy-performance targets, helping validate retrofit-ready solutions where roof space is limited and façade performance requirements are strict.
- July 2025: Eindhoven University of Technology (TU/e) secured EUR 1.5 million in funding for its UPSCALE project under the Clean Energy Transition Partnership (CETPartnership) to advance perovskite-based BIPV integration into buildings. The program supports pre-commercial development that targets durability and integration constraints that commonly slow adoption beyond pilot façades and rooftops.
- June 2024: The European Union adopted the recast Energy Performance of Buildings Directive (EU) 2024/1275, formalizing a policy route that ties building permits and renovation pathways to on-site solar uptake. By embedding solar provisions into building-energy regulation, the directive supports demand for BIPV systems that can operate as compliant building envelope components rather than add-on PV arrays.


Building Integrated Photovoltaic (BIPV) Market Report Scope and Research Methodology
Market Definition and Coverage
For this study, the market covers revenue earned from photovoltaic materials that are integrated into a building element and generate electricity, such as roof surfaces, facades, and glazing. The sizing reflects the value of these BIPV products sold into new-build and renovation activity.
Scope exclusions: Standalone rooftop PV systems mounted above an existing roof, utility-scale solar plants, and non-BIPV electrical balance-of-system items are excluded from the market value.
Segments Covered in This Report
- By Technology
- Crystalline Silicon (Monocrystalline, Polycrystalline)
- Thin-Film (CdTe, CIGS, a-Si)
- Emerging (Perovskite, Organic PV, Tandem)
- By End-User
- Residential
- Commercial
- Industrial
- Institutional and Public Buildings
- By Building Element (Qualitative Analysis)
- Roofs
- Facades/Curtain Walls
- Windows and Transparent Glazing
- Skylights and Atriums
- Shading Devices (Louvers, Balconies)
- By Geography
- North America
- United States
- Canada
- Mexico
- Europe
- Germany
- France
- United Kingdom
- Spain
- Italy
- NORDIC Countries
- Russia
- Rest of Europe
- Asia-Pacific
- China
- Japan
- India
- South Korea
- ASEAN Countries
- Australia and New Zealand
- Rest of Asia-Pacific
- South America
- Brazil
- Argentina
- Colombia
- Rest of South America
- Middle East and Africa
- Saudi Arabia
- United Arab Emirates
- South Africa
- Nigeria
- Egypt
- Rest of Middle East and Africa
- North America
Data Sources, Market Sizing, and Validation
Desk Research
Desk work starts with building and solar indicators that are available in the public domain, then we align them to what is actually installed as BIPV. Common references include sources such as the International Energy Agency for PV outlooks, the International Renewable Energy Agency for capacity and policy context, and the World Bank for macro and construction-linked indicators.
We also review customs and trade statistics where relevant, for example harmonized system trade data around PV modules and related glass, plus building and energy codes published by national agencies. To keep assumptions practical, we cross-check with company filings, investor presentations, and reputable construction and energy press for pricing direction, product mix shifts, and project timing. Patent databases are used selectively to confirm technology maturity trends that can affect adoption and pricing. These desk research sources are illustrative only, and many other public references were also used for data collection, validation, and clarification.
Primary Interviews and Surveys
Primary discussions were used to validate which building elements are most commonly specified as BIPV, how average selling prices move by application (roof, facade, glazing), and what share of demand comes from new construction versus retrofit. We spoke with stakeholders across the value chain, including material suppliers, module and glass processors, engineering and installation teams, and project decision-makers, then we rechecked assumptions across APAC, EMEA, and the Americas to reduce single-region bias.
Distribution of primary research fieldwork respondents
| Company type | Respondent position | Region |
|---|---|---|
| Top tier: 37% | CXOs: 12% | APAC: 46% |
| Mid tier: 49% | Functional/Unit leaders: 30% | EMEA: 33% |
| Smaller Players: 14% | Managers: 58% | Americas: 21% |
Market-Sizing & Forecasting
Sizing begins with a top-down build where construction activity and solar adoption signals are used to reconstruct a realistic BIPV demand pool, then value is derived using application-level pricing. Since the market is tied to buildings, inputs such as new floor area added, green-building and energy code uptake, roof and facade renovation cycles, and PV capacity additions are used as practical anchors before converting the market into revenue.
The result is tested using selective bottom-up approximations, such as sampled project quotes, typical watts installed per square meter for roof and facade use cases, and channel checks on shipment direction and ASP ranges. Where country-level detail is limited, proxy indicators such as construction spending growth and policy strength are used to split regional totals, and the output is sanity-checked with interview feedback.
For forecasting, scenario analysis is used so adoption can change with building code revisions, incentive intensity, and material cost direction. The final trajectory is then aligned to expert consensus on how quickly BIPV penetrates premium new-build and renovation projects. Price assumptions are refreshed by tracking module and specialty glass price movement, and by applying slower declines for architectural products where customization is common.
Data Validation & Update Cycle
Validation is done in layers so the final number is not driven by one dataset or a narrow interview set. Model outputs are compared against independent signals such as regional PV deployment momentum, construction starts, and publicly visible policy milestones, and any sharp jumps are reviewed until the underlying driver is clearly explained.
Before sign-off, a second analyst checks key assumptions, unit consistency, and currency conversions, then a final variance scan is completed at the region and application level. Reports are refreshed annually, with interim updates triggered by material policy changes, large project pipeline shifts, or clear price shocks. Right before delivery, a last pass is completed so clients receive the most current view available.
Mordor Intelligence's Building Integrated Photovoltaic Market Size Compared Against Other Published Estimates
Published market sizes for building-integrated photovoltaics can differ even when the topic label looks the same, because firms do not always count the same product set, building elements, and project timing. Differences also come from how prices are treated across roofs, facades, and glazing, and from whether the study leans on construction activity signals or broader PV totals.
Some external estimates include adjacent solar building products or wider system elements that sit outside true building-integrated materials, which pushes the total upward. In Mordor Intelligence, the number is limited to revenue from PV products that replace part of the building envelope, for example integrated roof surfaces, facades, and PV glazing, and it stays tied to observed adoption signals and refreshed ASP ranges to avoid double counting with conventional rooftop PV.
Benchmark comparison
| Source | Market Size | Gaps in Research Methodology |
|---|---|---|
| Mordor Intelligence | USD 13.45 B (2025) | |
| Global Consultancy A | USD 23.41 B (2025) | Often reflects a wider revenue pool that can fold in broader solar building products and system components, and it may apply higher blended ASPs across applications without rechecking against project-level procurement patterns. |
| Industry Association B | USD 15.10 B (2023) | Uses an earlier base year and may emphasize technology spend linked to announced deployments, which can differ from realized installations and can shift totals depending on how pre-development projects are treated. |
Taken together, the spread mainly comes from scope expansion and pricing treatment rather than from a single growth assumption. By keeping the value build traceable to construction-linked demand indicators, application mix, and checked ASP ranges, the study produces a practical number that can be repeated and stress-tested when assumptions change.


Key Questions Answered in the Report
What is the forecast value of the Building Integrated Photovoltaic (BIPV) market by 2031?
The market is projected to reach USD 47.02 billion by 2031, growing at a 23.06% CAGR over 2026-2031.
Which technology segment is expected to grow the fastest through 2031?
Perovskite and tandem architectures are forecast to post a 27.5% CAGR, outpacing other technologies.
Why are commercial buildings the largest adopters of BIPV?
They have large façade areas and access to sustainability-linked financing, enabling them to prioritize on-site generation and meet ESG targets.
How do policy mandates influence BIPV demand in Europe?
The Energy Performance of Buildings Directive requires solar-ready roofs on new structures by 2030, turning integrated photovoltaics into a compliance obligation.
What are the main barriers to residential deployment?
Fragmented ownership, longer permitting cycles, and higher upfront costs keep many homeowners from choosing building-integrated systems despite subsidies.
Page last updated on:


 Your data is secure and never sold or shared.


