
Bridge Construction Market Size and Share
Market Overview
| Study Period | 2020 - 2031 |
|---|---|
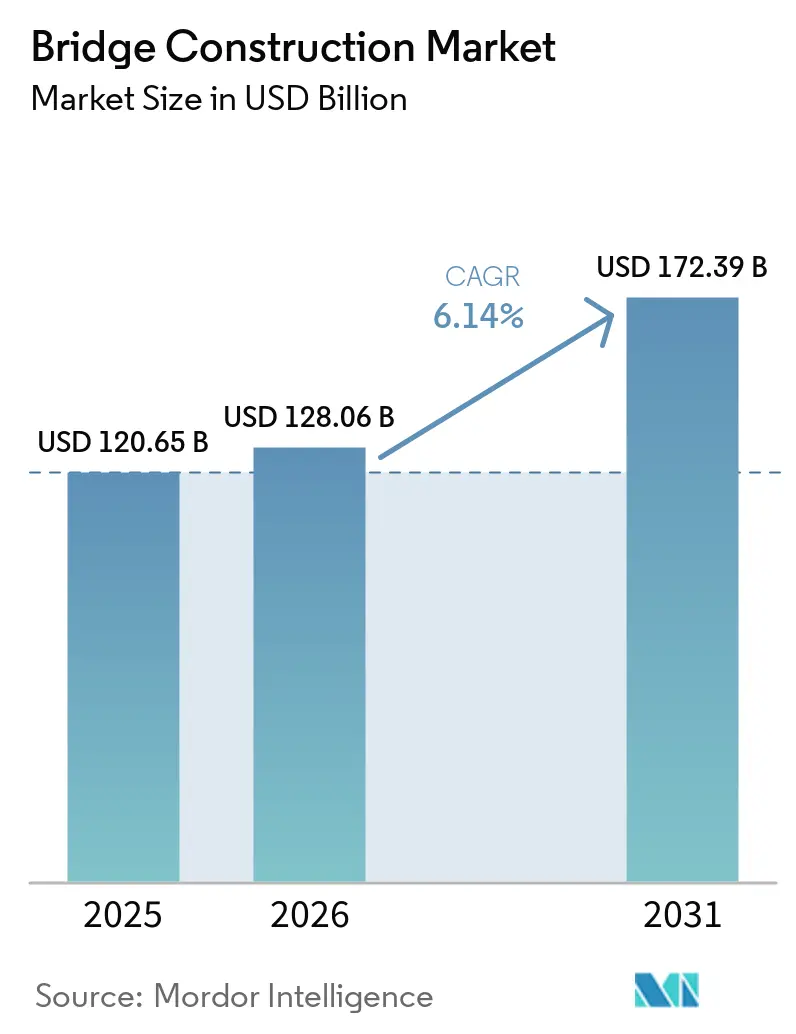
| Market Size (2026) | USD 128.06 Billion |
| Market Size (2031) | USD 172.39 Billion |
| Growth Rate (2026 - 2031) | 6.14 % |
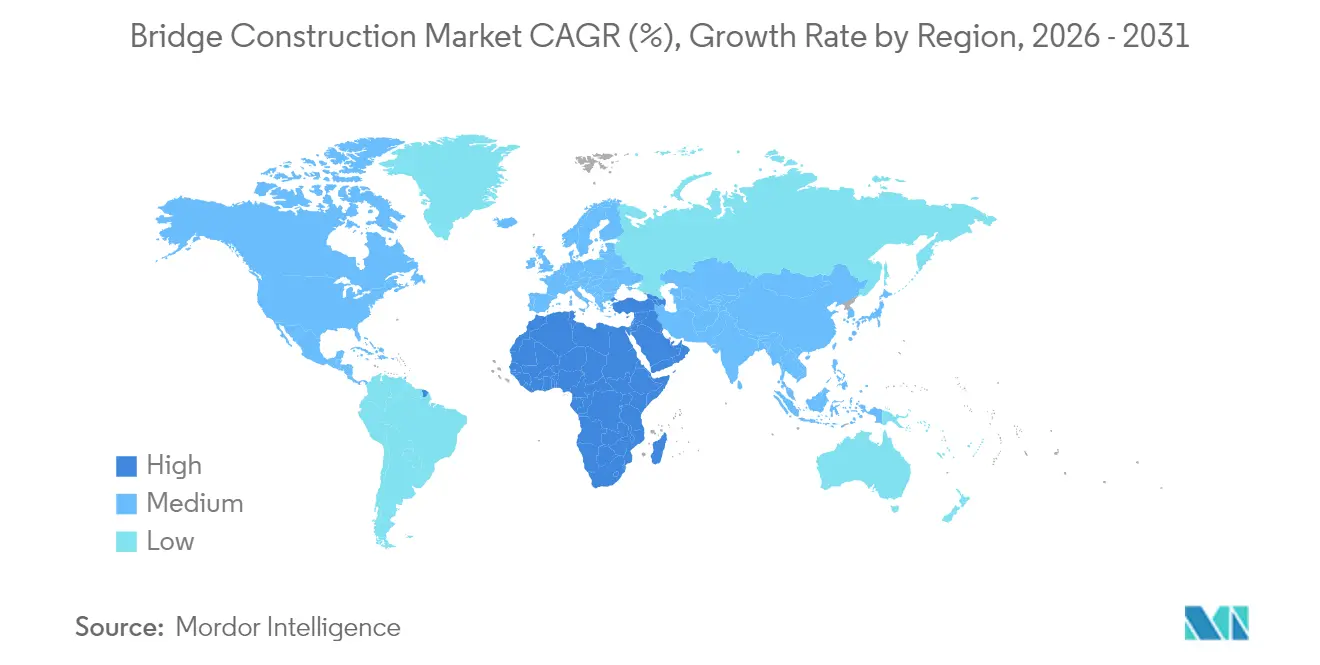
| Fastest Growing Market | Middle East and Africa |
| Largest Market | Asia Pacific |
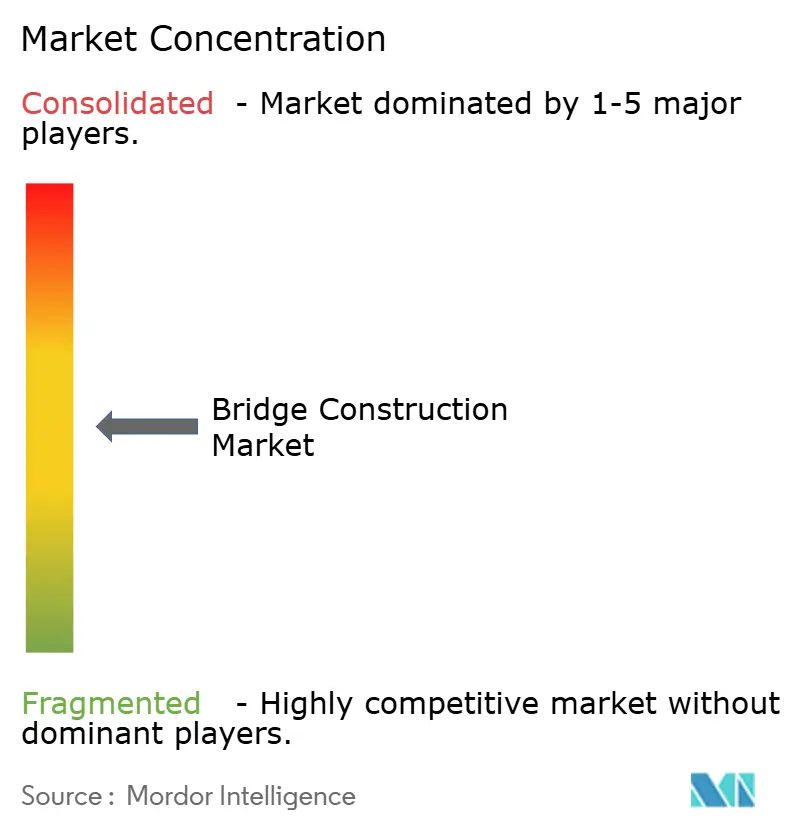
| Market Concentration | Medium |
Major Players *Disclaimer: Major Players sorted in no particular order Image © Mordor Intelligence. Reuse requires attribution under CC BY 4.0. | |
Bridge Construction Market Analysis by Mordor Intelligence
Bridge Construction market size in 2026 is estimated at USD 128.06 billion, growing from 2025 value of USD 120.65 billion with 2031 projections showing USD 172.39 billion, growing at 6.14% CAGR over 2026-2031. Accelerating infrastructure outlays, such as the United States Infrastructure Investment and Jobs Act (IIJA) and China’s Five-Year Plan, anchor multi-year demand visibility. Rapid uptake of prefabrication and modular assembly compresses delivery schedules by 20-40%, enabling contractors to bid more projects with tighter timelines. Contractors increasingly differentiate through technology, digital twins, AI-enabled logistics, and automated quality control, rather than lowest cost alone. Meanwhile, public agencies embed climate resilience and low-carbon specifications into procurement, nudging material choices toward ultra-high-performance concrete (UHPC) and fiber-reinforced polymers. Regional growth gaps widen: Asia-Pacific sustains the largest project pipeline, while the Middle East & Africa emerges as the fastest-expanding arena due to cross-border connectivity programs.
Key Report Takeaways
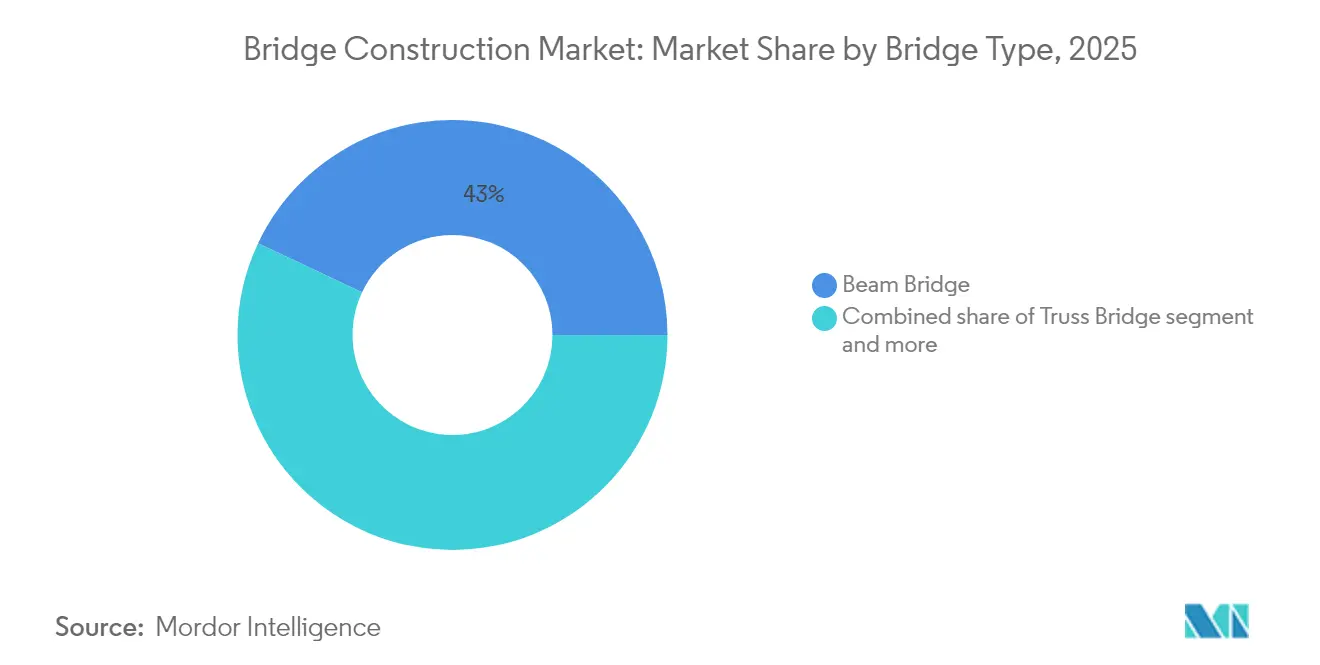
- By bridge type, beam bridges led with 42.98% of the bridge construction market share in 2025; cable-stayed designs are projected to advance at a 7.62% CAGR to 2031.
- By material, steel accounted for a 52.90% share of the bridge construction market size in 2025, while composites recorded the highest projected CAGR at 8.12% through 2031.
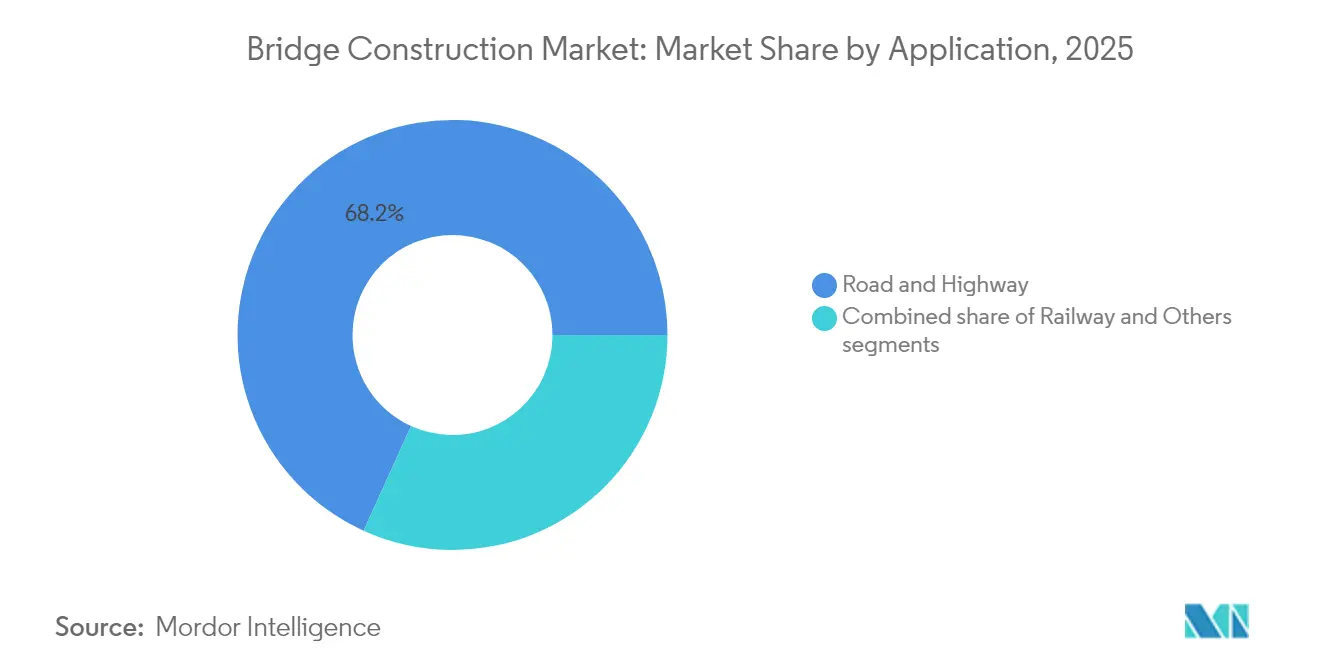
- By application, road and highway structures commanded 68.21% of the bridge construction market share in 2025, and railway bridges are set to grow at a 6.55% CAGR between 2026-2031.
- By geography, Asia-Pacific held 46.12% share of the bridge construction market in 2025; the Middle East & Africa is forecast to expand at a 7.63% CAGR through 2031.
Note: Market size and forecast figures in this report are generated using Mordor Intelligence’s proprietary estimation framework, updated with the latest available data and insights as of 2026.
Market Trends and Insights
Drivers Impact Analysis of Bridge Construction Market*
| Drivers | (~) % Impact on CAGR Forecast | Geographic Relevance | Impact Timeline |
|---|---|---|---|
| Mega-infrastructure spending plans (2025-2030) | +1.8% | North America, Asia-Pacific, Middle East & Africa | Medium term (2-4 years) |
| Preference for accelerated bridge construction (ABC) | +1.2% | North America, Europe, and spreading to Asia-Pacific | Short term (≤ 2 years) |
| Shift to low-carbon and recycled materials | +0.9% | Europe, North America, global roll-out | Long term (≥ 4 years) |
| Resilience upgrades for climate-exposed bridges | +0.7% | Global coastal and seismic regions | Medium term (2-4 years) |
| Smart-sensor structural-health-monitoring mandates | +0.6% | Advanced economies first | Long term (≥ 4 years) |
| Source: Mordor Intelligence | |||
Surge in Mega-Infrastructure Spending Plans (2025-2030)
Historic funding waves underpin the bridge construction market. The IIJA directs USD 110 billion to roads and bridges, including dedicated Bridge Investment and Formula programs. China’s public-works outlays follow its current Five-Year Plan, while Mexico’s National Infrastructure Program budgets USD 12.6 billion for 551 transport projects. Multi-region synchronicity lets contractors scale prefabrication factories and workforce training, locking in supply-chain efficiencies. Long-dated visibility also attracts private capital, evident in a 40% share of 2024 AEC M&A deals funded by private equity[1].
Growing Preference for Accelerated Bridge Construction (ABC) Methods
ABC shrinks on-site activity, curbs traffic disruption, and improves safety. FHWA pilot states report 20-50% faster completions and quality gains from factory-controlled modules. UHPC joints extend spans 30-40%, cutting lifecycle maintenance. Missouri’s I-70 Missouri River crossing finished ahead of schedule by staging prefabricated segments while live lanes stayed open. Contractors investing in digital twins and logistics simulation capture procurement preference as 47 state DOTs embed ABC scoring into tenders[2].
Resilience Upgrades for Climate-Change-Exposed Bridges
Seismic, flood, and temperature extremes reset design baselines. California’s Golden Gate Bridge retrofit deployed tuned-mass dampers and continuous monitoring to withstand magnitude-8.3 quakes at a USD 76 million budget. Australia’s policy now compels climate-risk assessments for all major crossings, spurring higher deck elevations and thermal allowances. Coastal nations elevate pile foundations to tackle sea-level rise, while arid regions specify heat-tolerant bearings. Specialized know-how commands premium margins, rewarding firms with proven extreme-environment portfolios.
Smart-Sensor-Enabled Structural-Health-Monitoring Mandates
IoT networks shift maintenance from reactive to predictive. Germany’s OpenLAB test bridge integrates 200+ multiparameter sensors, capturing load, tilt, and temperature every second with USD 4.18 million federal backing. Hamburg’s smartBRIDGE embeds 500 sensors and BIM data to forecast deterioration in real time. U.S. DOT encourages states to weave sensor suites into new builds, unlocking life-cycle savings that offset initial outlay within 7-10 years. Early adopters win O&M contracts that run decades, diversifying revenue beyond EPC scopes[3].
Restraints Impact Analysis of Bridge Construction Market*
| Restraints | (≈) % Impact on CAGR Forecast | Geographic Relevance | Impact Timeline |
|---|---|---|---|
| Skilled-labor shortages in advanced bridge engineering | -1.1% | North America, Europe, Australia | Medium term (2-4 years) |
| Inflation-driven spikes in steel & cement costs | -0.8% | Global, acute in emerging markets | Short term (≤ 2 years) |
| Lengthy environmental-impact permitting cycles | -0.6% | North America, Europe expanding | Medium term (2-4 years) |
| Rising insurance premiums in seismic zones | -0.4% | Pacific Rim, Mediterranean | Long term (≥ 4 years) |
| Source: Mordor Intelligence | |||
Skilled-Labor Shortages in Advanced Bridge Engineering
ABC counts 439,000 extra U.S. construction workers needed in 2025, rising to 499,000 in 2026. Australia’s pipeline needs 130,000 new hires, while the U.K. targets 500,000 across major projects. Wage premiums escalate 15-20% for segmental-bridge carpenters and UHPC specialists. Automation, robotic rebar tying, and 3-D printed formwork offset but cannot fully bridge the gap, prompting firms to establish training academies and global talent exchanges.
Inflation-Driven Spikes in Steel & Cement Input Costs
Elevated rebar at USD 47.70 per 20-ft length and RSMeans Index 296.3 squeeze project margins. Shipping bottlenecks lengthen lead times for high-spec steel and bearings. Contractors hedge with indexed contracts and multi-source procurement, yet some public owners defer bids until price clarity returns. Designers increasingly favor material-efficient layouts to keep budgets intact.
*Our forecasts treat driver/restraint impacts as directional, not additive. The impact forecasts reflect baseline growth, mix effects, and variable interactions.
Bridge Construction Market Segment Analysis
By Bridge Type:
Cable-Stayed Designs Lead InnovationCable-stayed structures post a 7.62% CAGR, the swiftest inside the bridge construction market, as governments prefer their span-to-cost efficiency and visual appeal. Beam bridges continued to dominate with 42.98% of 2025 revenue, reflecting their unmatched value for medium-length highway crossings and the well-established contractor base maintaining this format. The Pelješac Bridge’s 285-m main spans were erected through balanced cantilever, proving how stay-cables can speed construction while minimizing temporary falsework.
The segment’s outlook hinges on digital tools such as BIM Level 3, highlighted by Norway’s New Sotra Bridge, which modeled 1 million objects to optimize sequencing. Suspension alternatives still command niche demand for spans greater than 1,000-m, but higher insurance premiums in seismic belts tilt some owners toward cable-stays. Movable and arch formats continue to find specialized urban or maritime use when navigational clearance or heritage aesthetics are decisive.

By Material:
Composite Materials Surge Despite Steel DominanceSteel preserved 52.90% of the 2025 value, undergirding the bridge construction market size through mature fabrication hubs and predictable performance. Composite materials, however, accelerate at 8.12% CAGR as owners chase corrosion-free life cycles and lighter superstructures that cut foundation costs. FHWA pilot decks demonstrate UHPC joints enabling 100-plus-year lifespans, shifting whole-life economics in favor of advanced concretes.
Fiber-reinforced polymers trim dead load by up to 50%, letting designers stretch spans without deeper girders. SmartBRIDGE Hamburg shows how embedded sensors enhance confidence in newer materials by proving real-time durability. Recycling initiatives also raise steel’s sustainability profile, ensuring its continued relevance even as composites scale.
By Application:
Railway Infrastructure Accelerates GrowthRoad and highway projects represented 68.21% of the bridge construction market share in 2025, benefiting from sustained roadway upgrades across continents. Road and highway upgrades continue to support the highway, street, and bridge construction market, particularly across major transportation corridors. Railway applications produce a 6.55% CAGR on the back of high-speed networks and freight-corridor modernization. The European Commission’s USD 4.31 million grant on the Havlíčkův Brod-Pardubice line typifies EU efforts to replace life-expired trusses with modern Langer beams.
Japan’s USD 2.11 billion freight-connectivity program underscores rail’s strategic value for resilient supply chains. Multi-modal bridge formats that integrate tracks with traffic lanes gain favor in dense corridors, exemplifying how smart city mandates reshape cross-section design. Pedestrian and cycling links follow broader urban-mobility spending, bringing fresh opportunities for slender composite decks and aesthetic lighting.
Geography Analysis
APAC Bridge Construction Market
Asia-Pacific commanded 46.12% of global spending in 2025, anchored by China’s Belt and Road extensions and India’s USD 1.2 trillion National Infrastructure Pipeline. Japan’s USD 2.11 billion freight-link package and Australia’s climate-resilient bridge replacements reinforce regional momentum. Embedded manufacturing capacity for steel girder fabrication accelerates project execution, and governments increasingly mandate BIM, bringing digital parity with Western peers.
MEA Bridge Construction Market
Middle East & Africa leads growth with a 7.63% CAGR forecast as the African Development Bank mobilizes USD 635.8 million for the ECOWAS cross-border bridge and targets USD 130-170 billion annually to close the region’s infrastructure gap. Nigeria and Egypt award EPC contracts that bundle ABC methods with seismic detailing, reflecting both schedule urgency and performance expectations.
North America and Europe Bridge Construction Market
North America benefits from the IIJA’s USD 110 billion bridge allocation, unleashing dozens of design-build tenders that prioritize prefabrication capacity. Canada’s Pattullo Bridge replacement highlights the rise of public-private partnerships, while Mexico’s USD 12.6 billion bridge backlog advances economic integration goals. Europe, focused on decarbonization, invests in digital twins and low-carbon materials, aligning procurement with the EU Green Deal.
Regulatory Landscape
Bridge construction is governed by a mix of national design codes, public-procurement rules, and owner-issued technical specifications that increasingly embed resilience, safety, and life-cycle performance requirements in tender scoring. In the United States, multi-year federal funding through the Infrastructure Investment and Jobs Act (IIJA), including dedicated bridge programs, has reinforced compliance expectations around delivery, reporting, and performance for state DOT-led procurements.
Regulation and quasi-regulation also take shape through technical guidance and standardized methods published by public works bodies. For example, Hong Kong's Civil Engineering and Development Department (CEDD) has issued technical practice notes and guidelines covering bridge rotation methods, structural design for plate girder structures using ultra-high-strength S960 steel, and robotic welding of structural steel, which affects contractor qualification and fabrication QA/QC requirements. In the Middle East, program-led governance such as Saudi Arabia's Vision 2030 continues to shape oversight and delivery frameworks for large transport corridors that include significant bridge and viaduct scopes.
Value Chain Analysis
The bridge construction value chain begins with planning and funding (transport ministries, DOTs, multilateral lenders, and PPP sponsors), followed by engineering and program management (surveying, geotechnical, design, and permitting), procurement of major inputs (steel, cement/concrete, bearings, cables, and specialty materials such as UHPC and FRP), and then fabrication and construction (girder shops, precast yards, piling/marine works, erection, and paving and track interfaces). Projects increasingly incorporate digital delivery, including BIM-enabled design coordination, 4D scheduling, and LiDAR-based site capture, alongside shop-floor techniques such as robotic welding for structural steel in markets where owner guidance supports it.
Downstream, commissioning and long-term operations and maintenance (inspection, structural health monitoring, and rehabilitation) are becoming more integrated with initial delivery decisions as owners emphasize life-cycle outcomes. Because bridge supply chains rely on specialized fabrication capacity and heavy-material logistics, contractors are sensitive to input-price shocks and trade or shipping disruptions. Procurement strategies have expanded to include multi-sourcing and structured liquidity tools (for example, invoice-backed supply chain finance and bank guarantee-backed procurement funding) to stabilize working capital and protect margins during volatile materials cycles.
Competitive Landscape
The bridge construction market is moderately fragmented yet trending toward consolidation. The top five players capture under 35% of global revenue, as regional contractors retain stronghold positions. Manhattan Road & Bridge’s purchase of Jensen Construction demonstrates capability-focused M&A, particularly for marine foundations and ABC expertise.
Technology adoption distinguishes leaders: companies integrating IoT sensors, AI-driven scheduling, and off-site fabrication consistently outperform schedule baselines. FHWA’s ABC endorsement in 47 states formally embeds technology readiness into bid scoring, steering market share toward digital pioneers.
Private equity’s 40% participation in 2024 AEC transactions injects capital for equipment automation, modular yard expansion, and international joint ventures. Niche disruptors, sensor manufacturers, and software developers partner with EPCs to commercialize predictive-maintenance service models, diversifying revenue streams beyond one-time construction fees.
Bridge Construction Industry Leaders
-
ACS Group
-
AECOM
-
Balfour Beatty
-
China Communications Construction Co. (CCCC)
-
China Railway Group
- *Disclaimer: Major Players sorted in no particular order
Bridge Construction Market Companies Covered in this Report
- ACS Group
- AECOM
- Balfour Beatty
- China Communications Construction Co. (CCCC)
- China Railway Group
- VINCI
- Bechtel
- HOCHTIEF
- Skanska
- Bouygues Construction
- Fluor
- Kiewit
- Samsung C&T
- Strabag
- Ferrovial
- Larsen & Toubro
- Obayashi
- PCL Construction
- Webuild (Salini Impregilo)
- Gammon Construction
Market Opportunities and Future Outlook
A large, visible project pipeline and active renewal programs create whitespace for accelerated bridge construction (ABC), prefabrication capacity, and digitally enabled delivery models. As of Q2 2026, the global bridge construction pipeline has been cited at about USD 504.8 billion, with North America holding the largest share of pipeline value (USD 145.3 billion), which supports demand for standardized components, modular erection methods, and schedule-driven delivery.
Project starts and role awards in 2026 show where near-term demand is concentrating. Construction commencement was announced for Brazil's 12.4 km Salvador-Itaparica Bridge involving China Communications Construction Company (CCCC) and China Civil Engineering Construction Corporation (CCECC) (July 2026), and CCCC Second Harbor Engineering Co., Ltd. moved the Wuhan Baishazhou Yangtze River highway-railway bridge into its main engineering phase (June 2026). On the services side, AECOM's selection as lead designer for the Alexandra Bridge replacement in Ottawa (July 2026) reflects owners procuring integrated, digital-first design and delivery support for complex replacement corridors. These signals align with opportunities in UHPC/FRP-enabled durability upgrades, sensor-ready bridges tied to asset-management mandates, and ecosystem contracting that shares risk across designers, fabricators, and constructors.
Recent Industry Developments in Bridge Construction Market
- July 2026: AECOM has been selected as Lead Designer for the Alexandra Bridge Replacement Project connecting Ottawa and Gatineau. The project supports North American bridge replacement design activity and expands digital delivery and integrated services to manage a complex multi-stakeholder program.
- February 2026: Balfour Beatty-McLean JV was awarded a 229 million contract by the South Carolina Department of Transportation to replace the I-95 bridges over Lake Marion. The contract strengthens North American bridge rehabilitation capacity, and the joint venture brings scale and modular delivery capability for large-span replacement.
- January 2026: ACS Group and a HOCHTIEF-led joint venture commenced the Berliner Brückenzug project in Duisburg (A59 expansion, A40 renewal). The project indicates scale-focused execution by a leading contractor with cross-border capabilities.
Bridge Construction Market Report Scope and Research Methodology
Market Definition and Coverage
For this methodology, the market covers spending tied to planning, engineering, and building bridge structures, including new builds and major replacement work, where the output is a bridge asset delivered under public or private contracts.
Scope exclusions: Minor routine maintenance, standalone approach-road paving, and non-bridge civil works that do not result in a bridge structure are excluded.
Segments Covered in This Report
- By Bridge Type
- Beam Bridge
- Truss Bridge
- Arch Bridge
- Suspension Bridge
- Cable-Stayed Bridge
- Others
- By Material
- Steel
- Prestressed Concrete
- Composite Material
- Advanced Materials (FRP, UHPC)
- By Application
- Road & Highway
- Railway
- Others(Pedestrian & Cycle, Pipeline & Utility, etc.)
- By Geography
- North America
- United States
- Canada
- Mexico
- South America
- Brazil
- Argentina
- Chile
- Rest of South America
- Europe
- Germany
- United Kingdom
- France
- Italy
- Spain
- Rest of Europe
- Asia-Pacific
- China
- India
- Japan
- South Korea
- Australia
- Rest of Asia-Pacific
- Middle East & Africa
- United Arab Emirates
- Saudi Arabia
- South Africa
- Nigeria
- Rest of Middle East and Africa
- North America
Data Sources, Market Sizing, and Validation
Desk Research
Desk research starts with building a clean fact base on bridge programs, how projects get funded, and what is typically counted in contract values across regions. We relied on public and official sources such as national transport departments and public works ministries, national statistics offices that publish construction output series, multilateral development bank project portals, and OECD and World Bank infrastructure indicators.
To tighten cost and activity assumptions, we also used contract award releases and pipeline notes from industry associations, procurement portals and tender bulletins run by public agencies, and standards bodies that publish bridge design and materials guidance, which helps interpret material and design shifts. Company filings, investor presentations, and reputable engineering press were used to check backlog commentary and cost inflation context, and paid subscriptions for company financials and intelligence, patent databases, and a global contracts and tenders dataset were used selectively for cross-checking. The sources mentioned are illustrative only, and many other references were used for data collection, validation, and clarification.
Primary Interviews and Surveys
Primary inputs came from structured interviews and surveys with contractors, project consultants, material suppliers, and public-sector buyers who manage bridge programs, which helped confirm what is being procured and when costs are recognized. We kept coverage broad across major bridge-building regions so differences in labor, input prices, and procurement cycles could be reflected, then adjusted desk assumptions where repeated feedback pointed to gaps.
Distribution of primary research fieldwork respondents
| Company type | Respondent position | Region |
|---|---|---|
| Top tier: 29% | CXOs: 13% | APAC: 41% |
| Mid tier: 57% | Functional/Unit leaders: 42% | EMEA: 34% |
| Smaller Players: 14% | Managers: 45% | Americas: 25% |
Market-Sizing & Forecasting
Sizing starts from a top-down build where infrastructure construction spend and transport-capex signals are translated into a bridge-specific demand pool using bridge program shares, award activity, and typical project mix by region, and then cross-checked against what contractors can execute. To keep the numbers practical, we corroborated totals with selective bottom-up approximations such as sampled project values from tenders, channel checks on awarded packages, and simple ASP x volume logic using proxy counts like bridge starts or major replacements.
Key inputs that shaped the model included public budget allocations for bridge programs, contract award values and backlog signals, the mix of new build versus replacement work, material price movement (especially steel and cement), and regional labor cost pressure that shifts delivered project value. Forecasts were built using scenario analysis, because policy-driven funding cycles and input-cost swings can change the near-term slope, and the scenarios were anchored to consensus ranges shared by practitioners. Where a clean bottom-up roll-up was not possible for smaller geographies, gaps were handled through ratio-based extrapolation from comparable regions and then rechecked with interview feedback before finalizing.
Data Validation & Update Cycle
Outputs were validated through several checks, including reconciling the final market value against independent signals like award trends, budget releases, and observed cost inflation, and then reviewing any large year-on-year jumps for plausibility. When a variance was flagged, assumptions were revisited and follow-up calls were triggered to confirm whether the change came from project timing, price escalation, or a scope boundary.
Before sign-off, the model goes through multi-step analyst review where calculations, currency conversions, and regional splits are rechecked, and then the narrative is aligned to the quantified results. Reports are refreshed annually, with interim updates when material events occur, and a final pre-delivery review is completed so clients receive the most current view available.
Mordor Intelligence's Bridge Construction Market Size Compared Against Other Published Estimates
Published bridge construction market numbers often look different because each publisher locks assumptions at a different time and then counts project value in its own way, which changes the final total. Differences usually come from how contract awards are treated versus actual work executed, how currency is converted across regions, and whether replacement work is grouped with broader highway activity.
A refresh-led review usually explains most of the spread, since input-cost inflation and FX movement can move reported values even when project volumes are steady, and the practical fix is to keep price logic and validation checks current. With currency conversion timed to the base year and unit-price progression rechecked against recent tender awards and public budget releases, Mordor Intelligence reduces drift that can show up when older price bases are carried forward.
Benchmark comparison
| Source | Market Size | Gaps in Research Methodology |
|---|---|---|
| Mordor Intelligence | USD 128.06 B (2026) | |
| Industry Association A | USD 121.00 B (2024) | Represents state and local highway and bridge contract awards, which can lead actual construction execution and it is not a global bridge-only market revenue total. |
| Regional Consultancy B | USD 17.00 B (2025) | US-only view for bridge and elevated highway construction, and the narrower geography and classification-based coverage makes it structurally smaller than a global bridge construction total. |
The table shows that scope and timing choices explain the range more than any single demand shift. When award indicators, geography boundaries, and currency timing are aligned to the same definition, the market size becomes easier to trace back to repeatable steps and clear project-value drivers.
Key Questions Answered in the Report
What is the current global value of the bridge construction market?
The bridge construction market size is USD 128.06 billion in 2026.
How fast is bridge construction spending expected to grow?
Global revenue is forecast to rise at a 6.14% CAGR from 2026 to 2031.
Which region contributes the largest share of new bridge projects?
Asia-Pacific accounts for 46.12% of 2025 spending thanks to Chinese and Indian programs.
Which bridge type is expanding the quickest?
Cable-stayed structures lead with a projected 7.62% CAGR through 2031.