Brazil Organic Fertilizer Market Size and Share
Market Overview
| Study Period | 2018 - 2031 |
|---|---|
| Forecast Data Period | 2026 - 2031 |
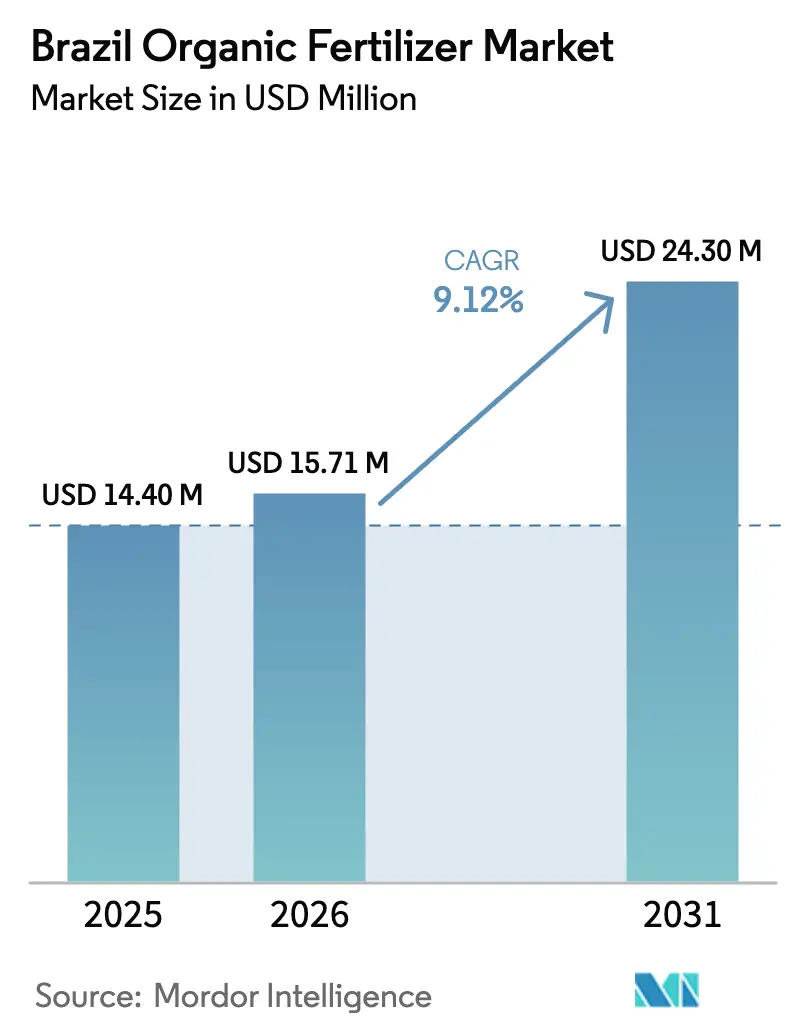
| Base Year Market Size (2025) | USD 14.4 Million |
| Market Size (2026) | USD 15.71 Million |
| Market Size (2031) | USD 24.3 Million |
| Growth Rate (2026 - 2031) | 9.12% CAGR |
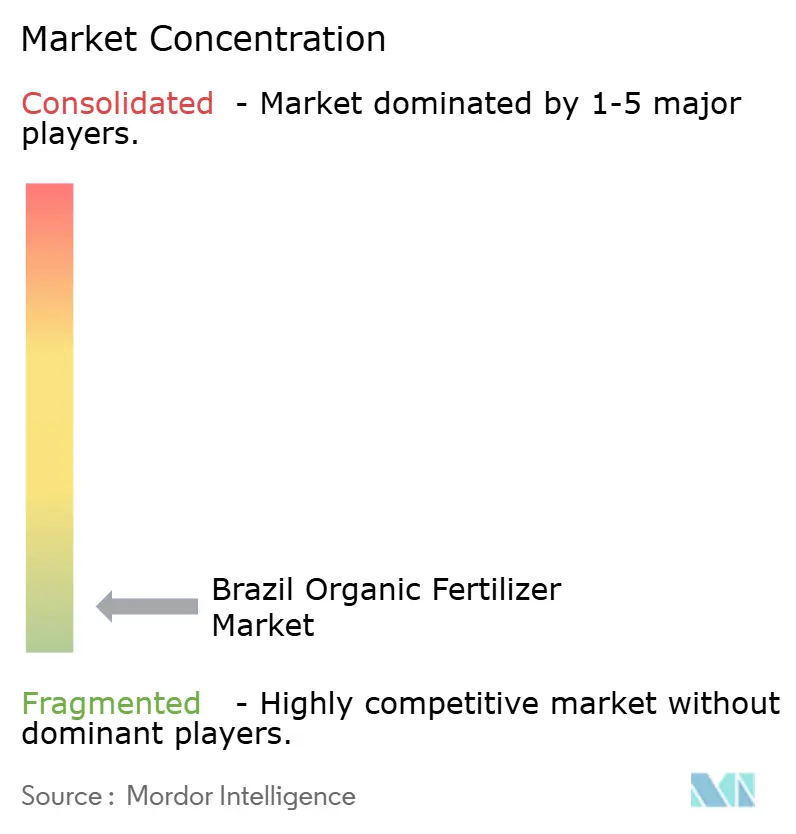
| Market Concentration | Low |
Major Players *Disclaimer: Major Players sorted in no particular order Image © Mordor Intelligence. Reuse requires attribution under CC BY 4.0. | |
Brazil Organic Fertilizer Market Analysis by Mordor Intelligence
Brazil organic fertilizer market size in 2026 is estimated at USD 15.71 million, growing from 2025 value of USD 14.4 million with 2031 projections showing USD 24.3 million, growing at 9.12% CAGR over 2026-2031. Momentum stems from government incentives under the ABC+ Plan, widening price gaps between organic and imported synthetic nutrients, and rising consumer demand for residue-free produce. Manure-based products dominate due to the plentiful livestock waste streams; however, digestate from emerging biogas plants is lowering input costs and improving product consistency. Larger processors are scaling output to satisfy certified coffee and soybean growers, while blockchain-enabled traceability programs are rewarding soil-regenerative practices with carbon premiums. Collectively, these shifts signal a biogas-driven transformation likely to redefine product economics across Brazil’s principal grain belts.[1]Source: Brazilian Ministry of Agriculture, “ABC+ Plan: Low Carbon Agriculture Program,” AGRICULTURA.GOV.BR
Key Report Takeaways
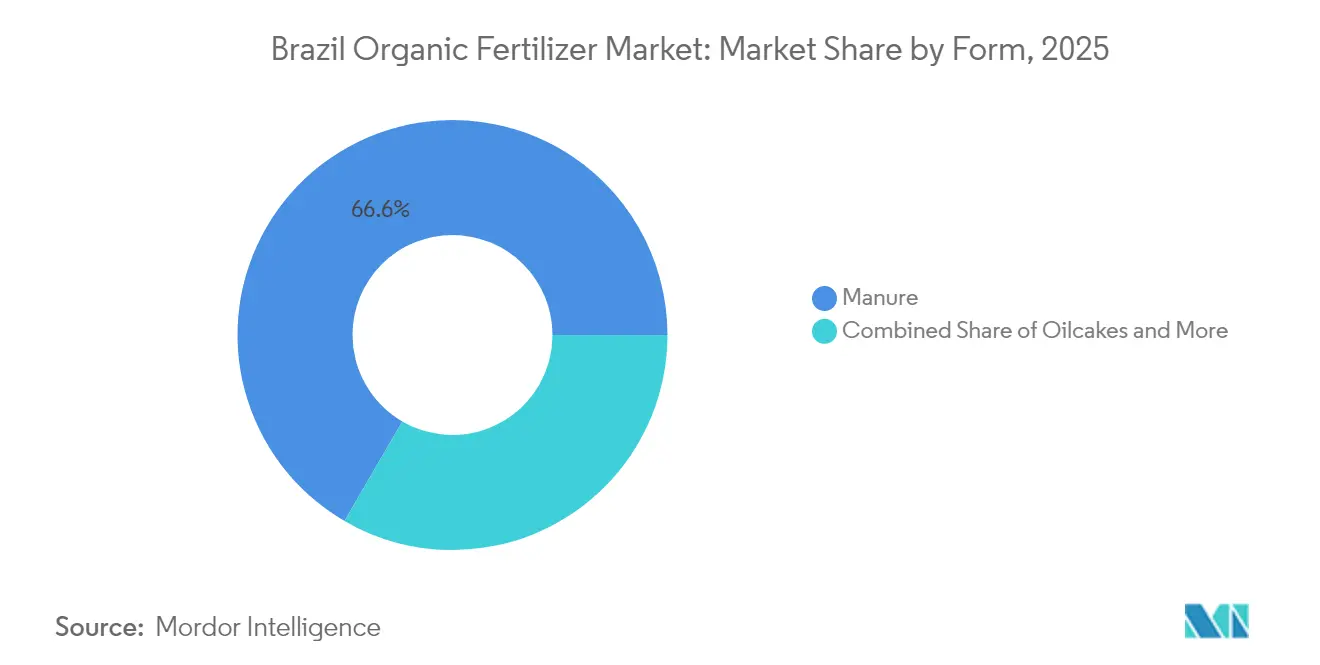
- By form, manure-based fertilizer led with 66.62% of the Brazil organic fertilizer market share in 2025, and is growing at the fastest rate with 9.58% CAGR.
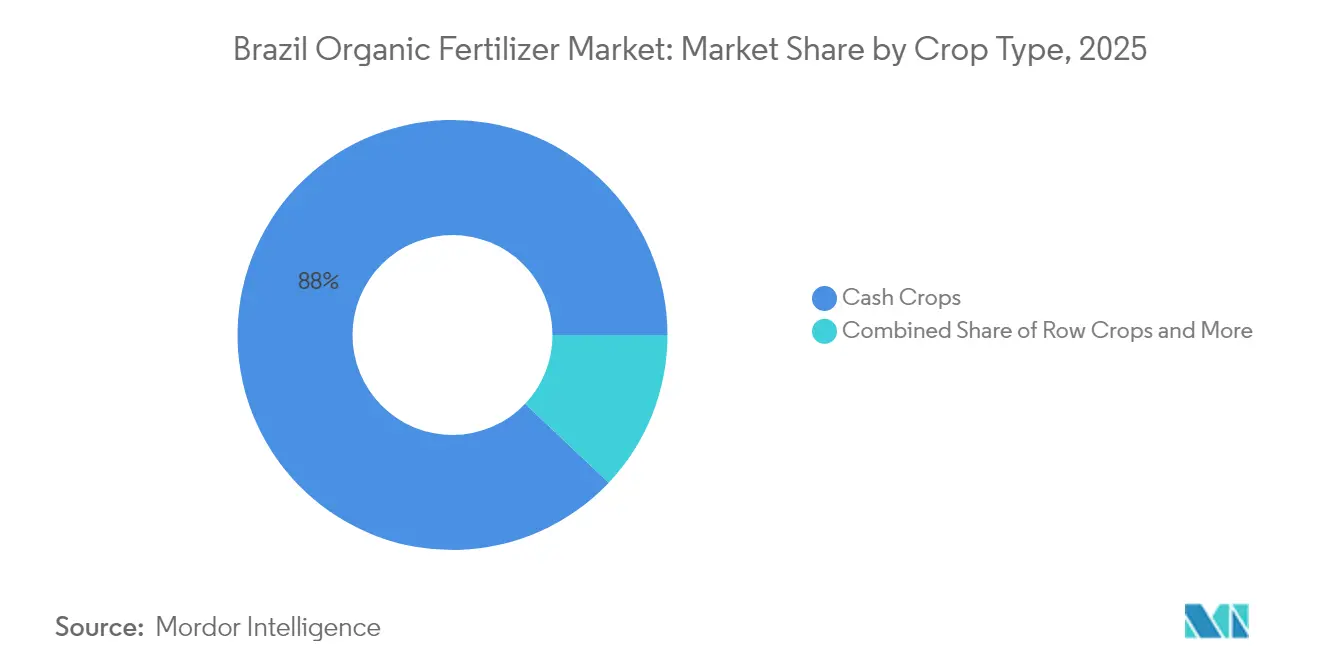
- By crop type, cash crops accounted for 87.95% share of the Brazil organic fertilizer market in 2025, while the row crops are projected to register the fastest 10.02% CAGR to 2031.
- Market concentration is fragmented, with the top five companies, including Adubasul Fertilizantes, Coromandel International Ltd., Plantin, Sigma AgriScience LLC, and T. Stanes and Company Limited, controlling less than 30% of the market share in 2024.
Note: Market size and forecast figures in this report are generated using Mordor Intelligence’s proprietary estimation framework, updated with the latest available data and insights as of 2026.
Brazil Organic Fertilizer Market Trends and Insights
Drivers Impact Analysis*
| Driver | (~) % Impact on CAGR Forecast | Geographic Relevance | Impact Timeline |
|---|---|---|---|
| Expansion of certified organic farmland | +2.1% | National; strongest in South and Southeast | Medium term (2-4 years) |
| Rising domestic and export demand for residue-free produce | +1.8% | Global export hubs and urban centers | Long term (≥ 4 years) |
| Government incentives under ABC+ Plan and tax relief on bio-inputs | +1.5% | Nationwide with regional bonuses | Short term (≤ 2 years) |
| Volatile synthetic-fertilizer prices driving substitution | +2.3% | Import-dependent regions | Short term (≤ 2 years) |
| Sugarcane biogas digestate projects lowering manure costs | +1.2% | São Paulo, Minas Gerais, Goiás | Medium term (2-4 years) |
| Blockchain-based traceability rewarding regenerative inputs | +0.7% | Export-oriented premium crop zones | Long term (≥ 4 years) |
| Source: Mordor Intelligence | |||
Expansion of Certified Organic Farmland
Certified acreage climbed 23% during 2024 after ABC+ Plan funding improved credit access for sustainable practices. Coffee and fruit growers spearheaded applications to secure European premiums, locking in multi-year demand for Brazil's organic fertilizer market products that maintain soil fertility without synthetics. A 3-year transition rules further guarantee sustained uptake, while cooperative extension programs in the South and Southeast deliver technical training that lowers adoption barriers for smallholders.
Rising Domestic and Export Demand for Residue-Free Produce
The European Union’s tighter Maximum Residue Limits, effective from January 2024, forced exporters to pivot toward residue-free cultivation. Parallel domestic trends saw organic food sales in Brazil’s largest cities rise 28% year over year, improving price realization for producers using certified inputs. Premiums for organic coffee, citrus, and specialty vegetables offset the comparatively higher cost per nutrient unit, ensuring broader penetration of Brazil's organic fertilizer market offerings in high-value segments.
Government Incentives under ABC+ Plan and Tax Relief on Bio-Inputs
The updated Plano Safra earmarked BRL 400.59 billion (USD 75.8 billion) in concessional credit for sustainable agriculture in 2024-2025. Complementary tax exemptions lowered organic input costs by 12-15%, while MAPA’s fast-track registration trimmed approval cycles from 6 to 18 months. These measures accelerate supplier entry and standardize product quality, benefiting established firms with compliance expertise while opening the Brazil organic fertilizer market to new biogas-linked entrants.
Volatile Synthetic-Fertilizer Prices Driving Substitution
Urea prices oscillated between USD 380 and USD 520 per metric ton in 2024, and potash imports surged 40% above historical averages. Such volatility narrowed the cost gap with organic alternatives, prompting co-ops to boost procurement by 35% during late 2024. Producers are increasingly hedging price risk by integrating Brazil's organic fertilizer market inputs into their nutrient programs, signaling durable demand even if import costs retreat.
Restraints Impact Analysis*
| Restraint | (~) % Impact on CAGR Forecast | Geographic Relevance | Impact Timeline |
|---|---|---|---|
| Higher cost per nutrient unit versus synthetics | −1.9% | National; severe among price-sensitive growers | Medium term (2-4 years) |
| Quality-standardization gaps across suppliers | −1.1% | Northern and Northeast states | Short term (≤ 2 years) |
| Northern-Arc logistics bottlenecks inflating freight costs | −0.8% | Amazon corridor | Long term (≥ 4 years) |
| Slow microbial efficacy in acidic Cerrado soils | −0.6% | Central-West Cerrado biome | Medium term (2-4 years) |
| Source: Mordor Intelligence | |||
Higher Cost per Nutrient Unit versus Synthetics
Organic formulations often deliver lower nutrient concentrations than synthetic fertilizers, which raises the cost per kilogram of nitrogen or phosphorus delivered. Budget-constrained growers in corn-soybean rotations remain price-sensitive, delaying adoption unless synthetic prices spike. Ongoing biogas digestate scaling and tax exemptions are narrowing this gap, yet Brazil's organic fertilizer market penetration in commodity grain belts still hinges on sustained cost reductions and yield evidence.
Quality-Standardization Gaps across Suppliers
Regional processors often lack uniform quality controls, resulting in variability in nutrient analysis and increased risks of contamination. MAPA’s 2024 certification upgrades introduced stricter batch-testing protocols, favoring organized players but leaving informal suppliers in the North and Northeast vulnerable to market exit. Persistent variability could temper farmer confidence and cap Brazil organic fertilizer market expansion until compliance becomes universal.
*Our forecasts treat driver/restraint impacts as directional, not additive. The impact forecasts reflect baseline growth, mix effects, and variable interactions.
Segment Analysis
By Form: Manure Dominance Reflects Infrastructure Advantages
Manure-based products held 66.62% of Brazil organic fertilizer market share in 2025 and are growing at the fastest rate with a 9.58% CAGR, driven by readily available livestock waste and mature composting networks across Rio Grande do Sul, Minas Gerais, and São Paulo. Suppliers leverage proximity between feedlots and grain belts to minimize haulage costs, ensuring stable margins despite fluctuating synthetic prices. Granulation technologies introduced during 2024 improved product uniformity, enabling mechanized broadcasting on large-scale soybean farms and reinforcing manure’s leadership position.
Meal-based fertilizers are projected to log an 8.21% CAGR through 2031, the quickest among forms. Oilseed processing byproducts and fish meals provide controlled nutrient release, which is desirable for perennial coffee and citrus plantations. Enhanced protein extraction yields nutrient-rich residues suitable for pelletization, thereby expanding distribution to mechanized row-crop operations. Regulatory clarity around pathogen control instituted in 2024 lowered entry barriers for industrial crushers, diversifying revenue streams within the Brazil organic fertilizer market.


By Crop Type: Cash Crops Drive Market Value
Cash crops captured 87.95% share of the Brazil organic fertilizer market size in 2025, anchored by soybeans, coffee, and sugarcane destined for premium export channels. European buyers’ residue limits and traceability demands motivate growers to adopt certified inputs, securing price premiums that compensate for the higher upfront costs. Coffee estates in Minas Gerais incorporate manure-based compost and meal blends to improve bean quality scores, thereby sustaining robust demand.
Row crops exhibit the fastest 10.02% CAGR outlook as corn-soy rotations respond to soil degradation, evidenced by plateauing yields. Organic amendments restore microbial diversity and organic matter, with biogas digestate delivering cost-effective nitrogen at regional plants. Research plots in Mato Grosso evidenced yield stability over multi-year cycles, encouraging cooperatives to bulk-purchase organic nutrients and mainstream them across thousands of hectares in the Brazil organic fertilizer market.
Geography Analysis
The South posts the highest concentration of certified farms, owing to cooperative extension networks and a favorable climate for diversified production. Aggregated demand underpins year-round procurement cycles, ensuring steady throughput for regional processors. Logistics advantages include dual-carriage highways that feed directly to Porto de Rio Grande, enabling efficient shipments of Brazil organic fertilizer market products to export-bound producers.
The Southeast commands the greatest value share, given its intensive clusters in sugarcane, coffee, and horticulture. Biogas digestate from São Paulo’s cane mills supplies localized fertilizer inputs, shaving freight and anchoring cost competitiveness. Specialty coffee estates in Minas Gerais are adopting blockchain traceability to capture premiums, a trend that reinforces certified organic nutrient uptake throughout this crucial zone of the Brazilian organic fertilizer market.
Central-West registers the fastest growth trajectory as expanding grain frontiers in Mato Grosso and Goiás confront soil fatigue and aluminum toxicity. Embrapa-validated formulations tailored for Cerrado acidity have lifted adoption among large-scale growers. However, long haul distances to port complexes and limited rail capacity still inflate delivered prices relative to coastal states, marginally tempering Brazil organic fertilizer market penetration in frontier municipalities.
Competitive Landscape
Market concentration is fragmented, with the top five companies, including Adubasul Fertilizantes, Coromandel International Ltd, Plantin, Sigma AgriScience LLC, and T.Stanes and Company Limited, controlling less than 30% of market share in 2024. Coromandel International leads, leveraging an integrated collection network and newly expanded São Paulo composting facility that adds 50,000 metric tons of capacity. Domestic challenger Adubasul Fertilizantes follows at 17%, focusing on manure-based granules tailored for southern cooperatives.
Strategic moves center on vertical integration and regional alliances. Mosaic Fertilizantes’ USD 20 million digestate plant in Uberaba processes 100,000 cubic meters of digestate annually, securing raw materials from biogas operators and reducing nutrient costs for clients in the Central-Western region. Yara Brasil introduced its inaugural organic line, YaraVita, bundling micronutrient packages and agronomic services to differentiate in the Brazil organic fertilizer market.
Distribution partnerships are proliferating. Nutrien’s 2024 joint venture with a cooperative network opened 200 retail points, expanding reach into secondary towns. E-commerce channels launched by Adubasul in late 2024 cater to mid-sized operations seeking doorstep deliveries, highlighting the omnichannel shift reshaping go-to-market models in the Brazil organic fertilizer market. Players are also establishing nationwide distribution networks and technical promotion programs to reach farmers effectively. The market has seen significant investment in physical infrastructure and export capabilities, particularly targeting Mercosur countries and global markets. [3]Source: Brazilian Ministry of Agriculture, “Bio-Inputs Registration Framework 2024,” AGRICULTURA.GOV.BR
Brazil Organic Fertilizer Industry Leaders
Adubasul Fertilizantes
Coromandel International Ltd
Plantin
Sigma AgriScience LLC
T.Stanes and Company Limited
- *Disclaimer: Major Players sorted in no particular order

Recent Industry Developments
- February 2023: Yara Brasil has rolled out YaraVita, a foliar and soil amendment line formulated for Brazilian micronutrient profiles. The launch includes field diagnostics and dosing software for vegetable growers.
- April 2022: Coromandel International Ltd approved the merger of Liberty Pesticides and Fertilizers Limited (LPFL) and Coromandel SQM (India) Private Limited (CSQM). This merger is anticipated to expand the company's product portfolio, including organic fertilizers.


Brazil Organic Fertilizer Market Report Scope
The Brazil Organic Fertilizer Market Report is Segmented by Form (Manure, Meal-Based Fertilizers, Oilcakes, Other Organic Fertilizers), and Crop Type (Cash Crops, Horticultural Crops, Row Crops), The Market Forecasts are Provided in Terms of Value (USD) and Volume (metric Tons).
| Manure |
| Meal Based Fertilizers |
| Oilcakes |
| Other Organic Fertilizers |
| Cash Crops |
| Horticultural Crops |
| Row Crops |
| Form | Manure |
| Meal Based Fertilizers | |
| Oilcakes | |
| Other Organic Fertilizers | |
| Crop Type | Cash Crops |
| Horticultural Crops | |
| Row Crops |


Market Definition
- AVERAGE DOSAGE RATE - The average application rate is the average volume of organic fertilizers applied per hectare of farmland in the respective region/country.
- CROP TYPE - Crop type includes Row crops (Cereals, Pulses, Oilseeds), Horticultural Crops (Fruits and vegetables) and Cash Crops (Plantation Crops, Fibre Crops and Other Industrial Crops)
- FUNCTION - The crop nutrition function of agricultural biological consists of various products that provide essential plant nutrients and enhance soil quality.
- TYPE - Organic fertilizers are applied to provide essential crop nutrients and enhance the soil quality.
| Keyword | Definition |
|---|---|
| Cash Crops | Cash crops are non-consumable crops sold as a whole or part of the crop to manufacture end-products to make a profit. |
| Integrated Pest Management (IPM) | IPM is an environment-friendly and sustainable approach to control pests in various crops. It involves a combination of methods, including biological controls, cultural practices, and selective use of pesticides. |
| Bacterial biocontrol agents | Bacteria used to control pests and diseases in crops. They work by producing toxins harmful to the target pests or competing with them for nutrients and space in the growing environment. Some examples of commonly used bacterial biocontrol agents include Bacillus thuringiensis (Bt), Pseudomonas fluorescens, and Streptomyces spp. |
| Plant Protection Product (PPP) | A plant protection product is a formulation applied to crops to protect from pests, such as weeds, diseases, or insects. They contain one or more active substances with other co-formulants such as solvents, carriers, inert material, wetting agents or adjuvants formulated to give optimum product efficacy. |
| Pathogen | A pathogen is an organism causing disease to its host, with the severity of the disease symptoms. |
| Parasitoids | Parasitoids are insects that lay their eggs on or within the host insect, with their larvae feeding on the host insect. In agriculture, parasitoids can be used as a form of biological pest control, as they help to control pest damage to crops and decrease the need for chemical pesticides. |
| Entomopathogenic Nematodes (EPN) | Entomopathogenic nematodes are parasitic roundworms that infect and kill pests by releasing bacteria from their gut. Entomopathogenic nematodes are a form of biocontrol agents used in agriculture. |
| Vesicular-arbuscular mycorrhiza (VAM) | VAM fungi are mycorrhizal species of fungus. They live in the roots of different higher-order plants. They develop a symbiotic relationship with the plants in the roots of these plants. |
| Fungal biocontrol agents | Fungal biocontrol agents are the beneficial fungi that control plant pests and diseases. They are an alternative to chemical pesticides. They infect and kill the pests or compete with pathogenic fungi for nutrients and space. |
| Biofertilizers | Biofertilizers contain beneficial microorganisms that enhance soil fertility and promote plant growth. |
| Biopesticides | Biopesticides are natural/bio-based compounds used to manage agricultural pests using specific biological effects. |
| Predators | Predators in agriculture are the organisms that feed on pests and help control pest damage to the crops. Some common predator species used in agriculture include ladybugs, lacewings, and predatory mites. |
| Biocontrol agents | Biocontrol agents are living organisms used to control pests and diseases in agriculture. They are alternatives to chemical pesticides and are known for their lesser impact on the environment and human health. |
| Organic Fertilizers | Organic fertilizer is composed of animal or vegetable matter used alone or in combination with one or more non-synthetically derived elements or compounds used for soil fertility and plant growth. |
| Protein hydrolysates (PHs) | Protein hydrolysate-based biostimulants contain free amino acids, oligopeptides, and polypeptides produced by enzymatic or chemical hydrolysis of proteins, primarily from vegetal or animal sources. |
| Biostimulants/Plant Growth Regulators (PGR) | Biostimulants/Plant Growth Regulators (PGR) are substances derived from natural resources to enhance plant growth and health by stimulating plant processes (metabolism). |
| Soil Amendments | Soil Amendments are substances applied to soil that improve soil health, such as soil fertility and soil structure. |
| Seaweed Extract | Seaweed extracts are rich in micro and macronutrients, proteins, polysaccharides, polyphenols, phytohormones, and osmolytes. These substances boost seed germination and crop establishment, total plant growth and productivity. |
| Compounds related to biocontrol and/or promoting growth (CRBPG) | Compounds related to biocontrol or promoting growth (CRBPG) are the ability of a bacteria to produce compounds for phytopathogen biocontrol and plant growth promotion. |
| Symbiotic Nitrogen-Fixing Bacteria | Symbiotic nitrogen-fixing bacteria such as Rhizobium obtain food and shelter from the host, and in return, they help by providing fixed nitrogen to the plants. |
| Nitrogen Fixation | Nitrogen fixation is a chemical process in soil which converts molecular nitrogen into ammonia or related nitrogenous compounds. |
| ARS (Agricultural Research Service) | ARS is the U.S. Department of Agriculture's chief scientific in-house research agency. It aims to find solutions to agricultural problems faced by the farmers in the country. |
| Phytosanitary Regulations | Phytosanitary regulations imposed by the respective government bodies check or prohibit the importation and marketing of certain insects, plant species, or products of these plants to prevent the introduction or spread of new plant pests or pathogens. |
| Ectomycorrhizae (ECM) | Ectomycorrhiza (ECM) is a symbiotic interaction of fungi with the feeder roots of higher plants in which both the plant and the fungi benefit through the association for survival. |


Research Methodology
Mordor Intelligence follows a four-step methodology in all our reports.
- Step-1: Identify Key Variables: In order to build a robust forecasting methodology, the variables and factors identified in Step-1 are tested against available historical market numbers. Through an iterative process, the variables required for market forecast are set and the model is built on the basis of these variables.
- Step-2: Build a Market Model: Market-size estimations for the forecast years are in nominal terms. Inflation is not a part of the pricing, and the average selling price (ASP) is kept constant throughout the forecast period.
- Step-3: Validate and Finalize: In this important step, all market numbers, variables and analyst calls are validated through an extensive network of primary research experts from the market studied. The respondents are selected across levels and functions to generate a holistic picture of the market studied.
- Step-4: Research Outputs: Syndicated Reports, Custom Consulting Assignments, Databases & Subscription Platforms.


