Azotobacter-Based Biofertilizer Market Size and Share
Market Overview
| Study Period | 2018 - 2031 |
|---|---|
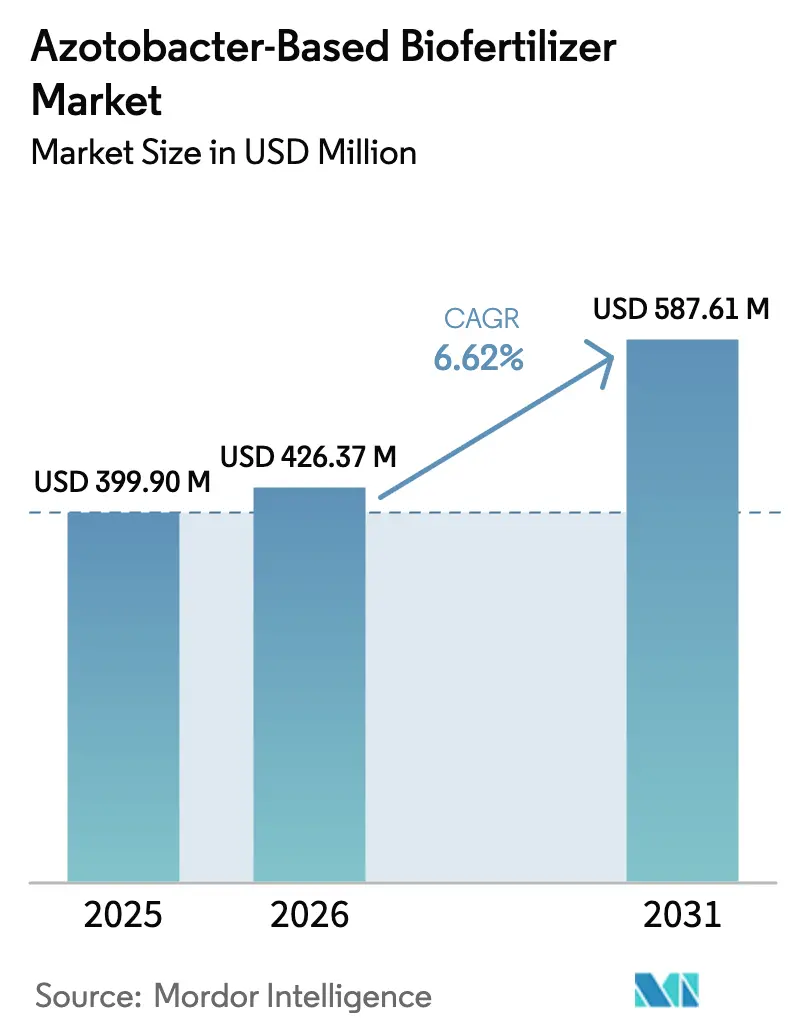
| Market Size (2026) | USD 426.37 Million |
| Market Size (2031) | USD 587.61 Million |
| Growth Rate (2026 - 2031) | 6.62% CAGR |
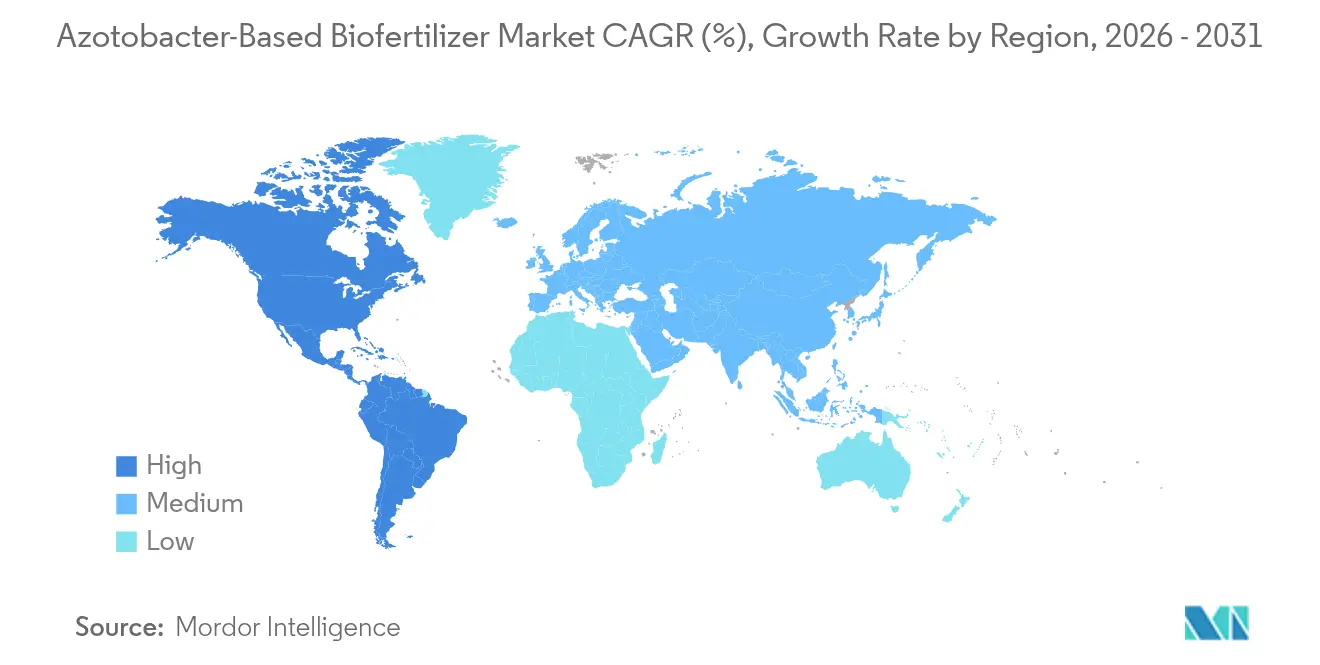
| Fastest Growing Market | North America |
| Largest Market | Asia-Pacific |
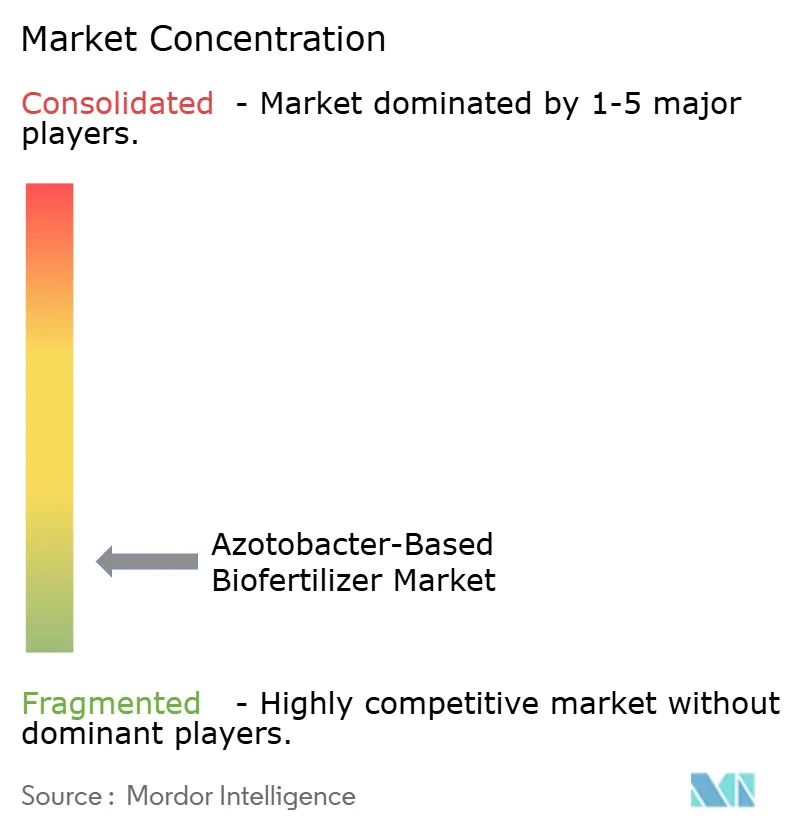
| Market Concentration | Low |
Major Players *Disclaimer: Major Players sorted in no particular order Image © Mordor Intelligence. Reuse requires attribution under CC BY 4.0. | |
Azotobacter-Based Biofertilizer Market Analysis by Mordor Intelligence
The azotobacter-based biofertilizer market size was valued at USD 399.90 million in 2025 and estimated to grow from USD 426.37 million in 2026 to reach USD 587.61 million by 2031, at a CAGR of 6.62% during the forecast period (2026-2031). Rising regulatory pressure to reduce synthetic fertilizer use, coupled with documented gains in soil health from biological nitrogen fixation, keeps demand on a steady upward path. Cost-sensitive growers favor the microbial option whenever urea prices rise, while carbon credit schemes in North America and the European Union create a new monetization layer. Precision agriculture platforms now embed Azotobacter prescriptions into variable-rate seeding and fertilization maps, improving return on investment for large-scale producers. Government biofertilizer subsidies in India, China, and Brazil significantly accelerate the uptake, particularly in rice, corn, and soybean systems[1]Source: Fertilizer Use and Price, USDA Economic Research Service, ers.usda.gov .
Key Report Takeaways
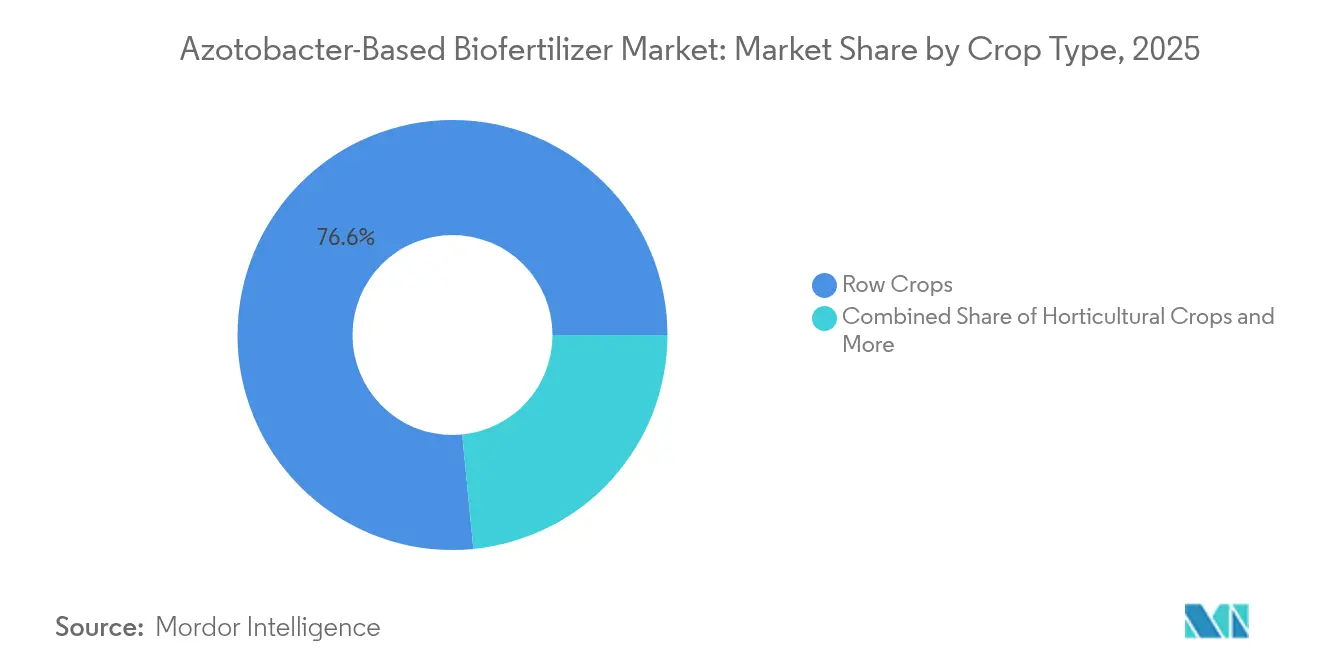
- By crop type, row crops held 76.55% of the azotobacter-based biofertilizer market share in 2025, while horticulture is projected to post the fastest 6.78% CAGR through 2031.
- By geography, the Asia-Pacific region held a 44.10% share of the azotobacter-based biofertilizer market size in 2025, while North America is expected to expand at a 7.18% CAGR through 2031.
Note: Market size and forecast figures in this report are generated using Mordor Intelligence’s proprietary estimation framework, updated with the latest available data and insights as of 2026.
Global Azotobacter-Based Biofertilizer Market Trends and Insights
Drivers Impact Analysis*
| Driver | (~) % Impact on CAGR Forecast | Geographic Relevance | Impact Timeline |
|---|---|---|---|
| Regulatory push for sustainable agriculture | +1.2% | Global, strongest in the EU and North America | Medium term (2–4 years) |
| Rising demand for organic, residue-free produce | +1.0% | North America, Europe, and urban Asia-Pacific | Medium term (2–4 years) |
| Cost-saving nitrogen fixation in row crops | +1.5% | Global, highest in North America and Brazil | Short term (≤ 2 years) |
| Government biofertilizer subsidy programs | +1.3% | Asia-Pacific core, expanding to Africa and South America | Long term (≥ 4 years) |
| Precision-ag driven microbial prescriptions | +0.8% | North America and Europe, and emerging in Australia | Medium term (2–4 years) |
| Carbon-credit monetization opportunities | +0.7% | North America, pilot programs in the EU, and Australia | Long term (≥ 4 years) |
| Source: Mordor Intelligence | |||
Regulatory Push for Sustainable Agriculture
Policies such as the European Union’s Farm to Fork strategy mandate a 20% reduction in chemical fertilizer use by 2030, creating a mandatory demand for biologics[2]Source: Farm to Fork Strategy, European Commission, europa.eu. A similar momentum is visible in the United States, where the Climate-Smart Commodities program allocates USD 3.1 billion to practices that include biological nitrogen fixation. Compliance reporting frameworks now accept documented Azotobacter applications as verifiable nitrogen-use efficiency gains, encouraging large farm groups to integrate the inoculant into their nutrient plans. Countries adopting carbon pricing see dual benefits, such as lower fertilizer-linked emissions and tradable soil-carbon offsets. Clear approval pathways in the EU and the United States shorten commercialization cycles, whereas markets with ambiguous regulations lag.
Rising Demand for Organic, Residue-Free Produce
U.S. organic food sales reached USD 63 billion in 2024, with residue-free labels commanding premiums of 15-30%[3]Source: 2024 Organic Survey, USDA National Agricultural Statistics Service, nass.usda.gov. Retailers in Europe and Asia now require biological-input documentation from suppliers to secure shelf space, prompting growers to adopt Azotobacter inoculants that leave no chemical residues. Specialty produce, such as berries and leafy greens, sees the highest adoption, since export markets conduct rigorous residue testing. Producers find that premium price capture often outweighs the cost savings from fertilizers, creating a strong economic case for the microbial solution. Certification agencies list Azotobacter products on approved substance rosters, streamlining organic compliance.
Cost-Saving Nitrogen Fixation in Row Crops
Urea averaged USD 380 per metric ton in 2024, up 15% from 2023, spurring growers to seek partial biological substitution. Field trials demonstrate that Azotobacter can replace 40-60 kg of synthetic nitrogen per hectare in corn, resulting in savings of USD 25 to 40 per hectare at current prices. Precision-ag platforms now account for nitrogen credits from microbial fixation, letting farmers cut variable-rate fertilizer doses without risking yield. The savings become more attractive during fertilizer price spikes, making demand cyclical yet structurally upward. Consistent performance in soybeans and wheat reinforces cross-crop confidence.
Government Biofertilizer Subsidy Programs
India’s scheme reimburses up to 50% of the purchase costs for Azotobacter for registered farmers, backed by an INR 1,451 crore (USD 174 million) budget for 2024-25. Brazil offers tax credits, while China ties provincial funding to targets for adopting biofertilizers. These incentives drive adoption rates three to five times higher than in unsubsidized areas, creating a first-mover advantage for local suppliers. Performance-based payouts, which require proof of yield or soil health improvement, prompt manufacturers to provide agronomic support services. As programs mature, market demand often persists even after subsidies taper.
Restraints Impact Analysis*
| Restraint | (~) % Impact on CAGR Forecast | Geographic Relevance | Impact Timeline |
|---|---|---|---|
| Short shelf life and storage hurdles | −0.9% | Global, severe in tropical regions | Short term (≤ 2 years) |
| Low farmer awareness and field variability | −0.7% | Developing markets, rural areas worldwide | Medium term (2–4 years) |
| Registration delays from regulatory ambiguity | −0.5% | Emerging markets are lacking biofertilizer frameworks | Long term (≥ 4 years) |
| Price pressure from low-cost Chinese strains | −0.4% | Asia-Pacific and price-sensitive regions globally | Medium term (2–4 years) |
| Source: Mordor Intelligence | |||
Short Shelf Life and Storage Hurdles
Bacterial counts can drop 50-80% after six months at temperatures above 25 °C, making cold storage essential. Added logistics costs run USD 0.15-0.25 per hectare, narrowing the price gap with chemical fertilizers. Tropical regions struggle most, as electricity costs and infrastructure gaps inflate distributor expenses. Encapsulation extends viability but raises manufacturing costs by up to 35%, creating a pricing dilemma until low-temperature-tolerant strains scale commercially, and shelf-life constraints cap market reach.
Low Farmer Awareness and Field Variability
Extension surveys indicate that 40 to 60% of first-time users report results below expectations, typically due to incorrect timing or unsuitable soil conditions. Biological solutions require more nuanced management than synthetic nutrients, yet many growers still follow one-size-fits-all practices. Demonstration plots with technical support improve repeat-purchase rates threefold; however, such programs require sustained investment to maintain their effectiveness. Adoption hurdles are highest among smallholders, especially in Sub-Saharan Africa and Southeast Asia, where advisory networks are under-resourced.
*Our forecasts treat driver/restraint impacts as directional, not additive. The impact forecasts reflect baseline growth, mix effects, and variable interactions.
Segment Analysis
By Crop Type: Row-Crop Dominance Underpinned by Cost Economics
Row crops accounted for a commanding 76.55% of the azotobacter-based biofertilizer market share in 2025, as nitrogen costs continue to weigh on budgets for corn, soybeans, and wheat. Heavy nitrogen demand during vegetative stages aligns well with microbial fixation timelines, ensuring reliable yield maintenance. Growers who integrate precision application achieve more uniform field performance, shrinking variability complaints.
The horticulture segment is projected to post the fastest expansion rate of 6.78% through 2031, as export buyers tighten residue thresholds for fruits and vegetables. Azotobacter industry suppliers cater to this space with strain blends tailored for high-value crops, priced 20-30% above row-crop formulations. Cash crops, such as cotton and sugarcane, continue to experience mid-single-digit growth, supported by public-sector research that validates long-term gains in soil fertility. As variable-rate capabilities drop in price, even small and mid-scale farms can fine-tune inoculation volumes, unlocking incremental savings.


Geography Analysis
Asia-Pacific’s commanding 44.10% f the azotobacter-based biofertilizer market share in 2025 arises from the region’s expansive cropland, robust subsidy support, and home-grown manufacturing base. India alone distributes 200 million Azotobacter packets annually through cooperative outlets, ensuring deep rural penetration. China’s capacity surplus enables aggressive export pricing, which influences neighboring markets such as Vietnam and Indonesia. Export-oriented horticulture in Thailand and the Philippines accelerates uptake as global retailers enforce residue standards.
North America charts the steepest growth curve at 7.18% CAGR through 2031, fueled by supportive climate-smart incentives and vibrant carbon markets. Adoption concentrates in the Midwest Corn Belt, where nitrogen costs absorb up to a quarter of operating budgets. Canada’s prairie provinces also embrace the technology, lured by the promise of lower fertilizer bills and incremental carbon revenue. Mexico’s greenhouse vegetable segment is shifting toward biological inputs to secure premium positions in U.S. supermarkets.
Europe’s trajectory remains stable but significant as the European Union pushes for a 20% reduction in fertilizer use by 2030. Germany and France lead the way in adoption, due to well-developed organic sectors and digital agronomy services. The Netherlands’ high-tech greenhouse cluster utilizes encapsulated strains that tolerate recirculating nutrient solutions. Mediterranean nations, such as Spain and Italy, expand the use of Azotobacter in wine grapes and olives, where soil health credentials carry significant marketing weight.

Competitive Landscape
The azotobacter-based biofertilizer market remains highly fragmented, with the top five brands holding only a limited share collectively in 2024. Indian Farmers Fertilizer Cooperative Limited leads, leveraging village-level retail reach and continual government procurement. National Fertilizers Limited trails closely, benefiting from state production grants that lower unit costs. Outside India, Chinese suppliers flood commodity channels with low-priced strains, capturing price-sensitive tiers across Asia and Africa.
Differentiation hinges on formulation science and cold-chain logistics rather than volume alone. Firms such as Novozymes and Lallemand invest in encapsulation technologies that lengthen shelf life to 18-24 months, unlocking hot-climate markets. Digital partnerships also emerge; IFFCO and Microsoft co-develop an app delivering field-specific Azotobacter prescriptions, combining microbial sales with subscription revenue. Global crop-input majors, including Bayer CropScience, are trialing multi-microbe blends to bundle nitrogen fixation with phosphorus solubilization, pursuing value-added niches.
Mergers and joint ventures focus on cross-regional distribution. Gujarat State Fertilizers and Chemicals teamed with Rizobacter to penetrate South America, while Koppert Biological Systems expanded its U.S. footprint via regional ag-retailer tie-ups. Patent filings for strain optimization and carrier technology increased by 18% in 2024, indicating a rise in R&D intensity. As cold-chain infrastructure improves, consolidation is expected, with well-capitalized players acquiring regional specialists to shore up supply consistency.
Azotobacter-Based Biofertilizer Industry Leaders
Green Vision Life Sciences
Gujarat State Fertilizers & Chemicals Ltd
Indian Farmers Fertiliser Cooperative Limited
National Fertilizers Limited
T.Stanes and Company Limited
- *Disclaimer: Major Players sorted in no particular order

Recent Industry Developments
- October 2025: Alltech broke ground on a USD 4.6 million biofertilizer production facility in Nicholasville, Kentucky, its first U.S. plant dedicated to crop-science technologies; the project received a USD 2.34 million grant from the USDA Fertilizer Production Expansion Program
- May 2025: ICL reported Q1 2025 consolidated sales of USD 1.77 billion, highlighted year-over-year growth in its Growing Solutions unit, and announced the acquisition of an ag-biologicals firm to expand specialty offerings


Global Azotobacter-Based Biofertilizer Market Report Scope
Cash Crops, Horticultural Crops, Row Crops are covered as segments by Crop Type. Africa, Asia-Pacific, Europe, Middle East, North America, South America are covered as segments by Region.| Cash Crops |
| Horticultural Crops |
| Row Crops |
| Africa | Egypt |
| Nigeria | |
| South Africa | |
| Rest of Africa | |
| Asia-Pacific | Australia |
| China | |
| India | |
| Indonesia | |
| Japan | |
| Philippines | |
| Thailand | |
| Vietnam | |
| Rest of Asia-Pacific | |
| Europe | France |
| Germany | |
| Italy | |
| Netherlands | |
| Russia | |
| Spain | |
| Turkey | |
| United Kingdom | |
| Rest of Europe | |
| Middle East | Iran |
| Saudi Arabia | |
| Rest of Middle East | |
| North America | Canada |
| Mexico | |
| United States | |
| Rest of North America | |
| South America | Argentina |
| Brazil | |
| Rest of South America |
| Crop Type | Cash Crops | |
| Horticultural Crops | ||
| Row Crops | ||
| Region | Africa | Egypt |
| Nigeria | ||
| South Africa | ||
| Rest of Africa | ||
| Asia-Pacific | Australia | |
| China | ||
| India | ||
| Indonesia | ||
| Japan | ||
| Philippines | ||
| Thailand | ||
| Vietnam | ||
| Rest of Asia-Pacific | ||
| Europe | France | |
| Germany | ||
| Italy | ||
| Netherlands | ||
| Russia | ||
| Spain | ||
| Turkey | ||
| United Kingdom | ||
| Rest of Europe | ||
| Middle East | Iran | |
| Saudi Arabia | ||
| Rest of Middle East | ||
| North America | Canada | |
| Mexico | ||
| United States | ||
| Rest of North America | ||
| South America | Argentina | |
| Brazil | ||
| Rest of South America | ||


Market Definition
- AVERAGE DOSAGE RATE - The average application rate is the average volume of Azotobacter applied per hectare of farmland in the respective region/country.
- CROP TYPE - Crop type includes Row crops (Cereals, Pulses, Oilseeds), Horticultural Crops (Fruits and vegetables) and Cash Crops (Plantation Crops, Fibre Crops and Other Industrial Crops)
- FUNCTION - The crop nutrition function of agricultural biological consists of various products that provide essential plant nutrients and enhance soil quality.
- TYPE - Azotobacter are beneficial microorganisms that help crops in Biological Nitrogen Fixation (BNF) and secretion of various plant hormones that boost crop growth and yield.
| Keyword | Definition |
|---|---|
| Cash Crops | Cash crops are non-consumable crops sold as a whole or part of the crop to manufacture end-products to make a profit. |
| Integrated Pest Management (IPM) | IPM is an environment-friendly and sustainable approach to control pests in various crops. It involves a combination of methods, including biological controls, cultural practices, and selective use of pesticides. |
| Bacterial biocontrol agents | Bacteria used to control pests and diseases in crops. They work by producing toxins harmful to the target pests or competing with them for nutrients and space in the growing environment. Some examples of commonly used bacterial biocontrol agents include Bacillus thuringiensis (Bt), Pseudomonas fluorescens, and Streptomyces spp. |
| Plant Protection Product (PPP) | A plant protection product is a formulation applied to crops to protect from pests, such as weeds, diseases, or insects. They contain one or more active substances with other co-formulants such as solvents, carriers, inert material, wetting agents or adjuvants formulated to give optimum product efficacy. |
| Pathogen | A pathogen is an organism causing disease to its host, with the severity of the disease symptoms. |
| Parasitoids | Parasitoids are insects that lay their eggs on or within the host insect, with their larvae feeding on the host insect. In agriculture, parasitoids can be used as a form of biological pest control, as they help to control pest damage to crops and decrease the need for chemical pesticides. |
| Entomopathogenic Nematodes (EPN) | Entomopathogenic nematodes are parasitic roundworms that infect and kill pests by releasing bacteria from their gut. Entomopathogenic nematodes are a form of biocontrol agents used in agriculture. |
| Vesicular-arbuscular mycorrhiza (VAM) | VAM fungi are mycorrhizal species of fungus. They live in the roots of different higher-order plants. They develop a symbiotic relationship with the plants in the roots of these plants. |
| Fungal biocontrol agents | Fungal biocontrol agents are the beneficial fungi that control plant pests and diseases. They are an alternative to chemical pesticides. They infect and kill the pests or compete with pathogenic fungi for nutrients and space. |
| Biofertilizers | Biofertilizers contain beneficial microorganisms that enhance soil fertility and promote plant growth. |
| Biopesticides | Biopesticides are natural/bio-based compounds used to manage agricultural pests using specific biological effects. |
| Predators | Predators in agriculture are the organisms that feed on pests and help control pest damage to the crops. Some common predator species used in agriculture include ladybugs, lacewings, and predatory mites. |
| Biocontrol agents | Biocontrol agents are living organisms used to control pests and diseases in agriculture. They are alternatives to chemical pesticides and are known for their lesser impact on the environment and human health. |
| Organic Fertilizers | Organic fertilizer is composed of animal or vegetable matter used alone or in combination with one or more non-synthetically derived elements or compounds used for soil fertility and plant growth. |
| Protein hydrolysates (PHs) | Protein hydrolysate-based biostimulants contain free amino acids, oligopeptides, and polypeptides produced by enzymatic or chemical hydrolysis of proteins, primarily from vegetal or animal sources. |
| Biostimulants/Plant Growth Regulators (PGR) | Biostimulants/Plant Growth Regulators (PGR) are substances derived from natural resources to enhance plant growth and health by stimulating plant processes (metabolism). |
| Soil Amendments | Soil Amendments are substances applied to soil that improve soil health, such as soil fertility and soil structure. |
| Seaweed Extract | Seaweed extracts are rich in micro and macronutrients, proteins, polysaccharides, polyphenols, phytohormones, and osmolytes. These substances boost seed germination and crop establishment, total plant growth and productivity. |
| Compounds related to biocontrol and/or promoting growth (CRBPG) | Compounds related to biocontrol or promoting growth (CRBPG) are the ability of a bacteria to produce compounds for phytopathogen biocontrol and plant growth promotion. |
| Symbiotic Nitrogen-Fixing Bacteria | Symbiotic nitrogen-fixing bacteria such as Rhizobium obtain food and shelter from the host, and in return, they help by providing fixed nitrogen to the plants. |
| Nitrogen Fixation | Nitrogen fixation is a chemical process in soil which converts molecular nitrogen into ammonia or related nitrogenous compounds. |
| ARS (Agricultural Research Service) | ARS is the U.S. Department of Agriculture's chief scientific in-house research agency. It aims to find solutions to agricultural problems faced by the farmers in the country. |
| Phytosanitary Regulations | Phytosanitary regulations imposed by the respective government bodies check or prohibit the importation and marketing of certain insects, plant species, or products of these plants to prevent the introduction or spread of new plant pests or pathogens. |
| Ectomycorrhizae (ECM) | Ectomycorrhiza (ECM) is a symbiotic interaction of fungi with the feeder roots of higher plants in which both the plant and the fungi benefit through the association for survival. |


Research Methodology
Mordor Intelligence follows a four-step methodology in all our reports.
- Step-1: Identify Key Variables: In order to build a robust forecasting methodology, the variables and factors identified in Step-1 are tested against available historical market numbers. Through an iterative process, the variables required for market forecast are set and the model is built on the basis of these variables.
- Step-2: Build a Market Model: Market-size estimations for the forecast years are in nominal terms. Inflation is not a part of the pricing, and the average selling price (ASP) is kept constant throughout the forecast period.
- Step-3: Validate and Finalize: In this important step, all market numbers, variables and analyst calls are validated through an extensive network of primary research experts from the market studied. The respondents are selected across levels and functions to generate a holistic picture of the market studied.
- Step-4: Research Outputs: Syndicated Reports, Custom Consulting Assignments, Databases & Subscription Platforms.


