Market Overview
| Study Period | 2021 - 2031 |
|---|---|
| Forecast Data Period | 2026 - 2031 |
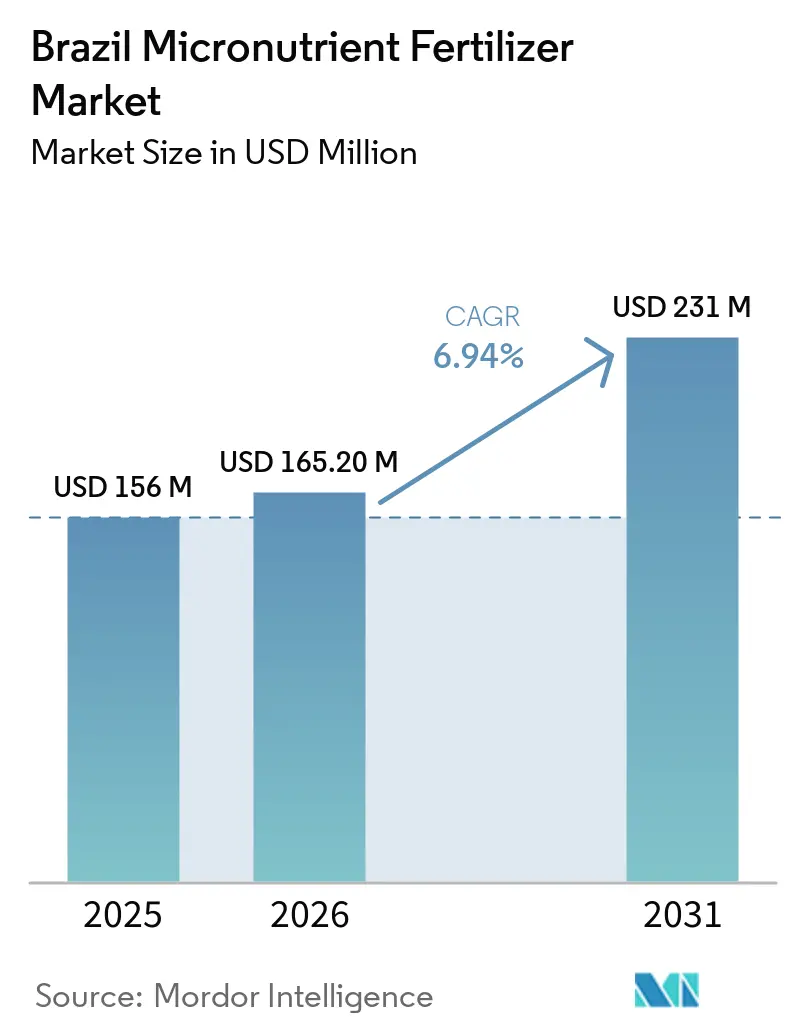
| Base Year Market Size (2025) | USD 156 Million |
| Market Size (2026) | USD 165.20 Million |
| Market Size (2031) | USD 231 Million |
| Growth Rate (2026 - 2031) | 6.94% CAGR |
| Market Concentration | Medium |
Major Players *Disclaimer: Major Players sorted in no particular order Image © Mordor Intelligence. Reuse requires attribution under CC BY 4.0. | |
Brazil Micronutrient Fertilizer Market Analysis by Mordor Intelligence
The Brazil micronutrient fertilizer market size is anticipated to grow from USD 156.00 million in 2025 to USD 165.20 million in 2026 and is forecast to reach USD 231.00 million by 2031 at a 6.94% CAGR over 2026-2031. Persistent zinc, boron, and manganese depletion across soybean–corn double-cropping areas, rapid center-pivot irrigation build-out, and subsidy support under the Plano ABC+ program are shifting demand toward chelated and water-soluble solutions. Growers in the Center-West and the states of Maranhao, Tocantins, Piaui, and Bahia (MATOPIBA) are moving away from one-size-fits-all blends toward variable-rate prescriptions that align doses with grid-sampled soil deficits, boosting uptake efficiency and trimming waste. Specialty formulators are commercializing biodegradable chelates that comply with draft National Environment Council discharge limits, while pivot makers are bundling micronutrient injectors with new irrigation rigs to lock in fertigation use. Heightened raw-material volatility and pending chelate regulation temper near-term margin prospects, yet integrated soil-testing, advisory, and financing packages continue to pull the Brazil micronutrient fertilizer market into a data-driven era.
Key Report Takeaways
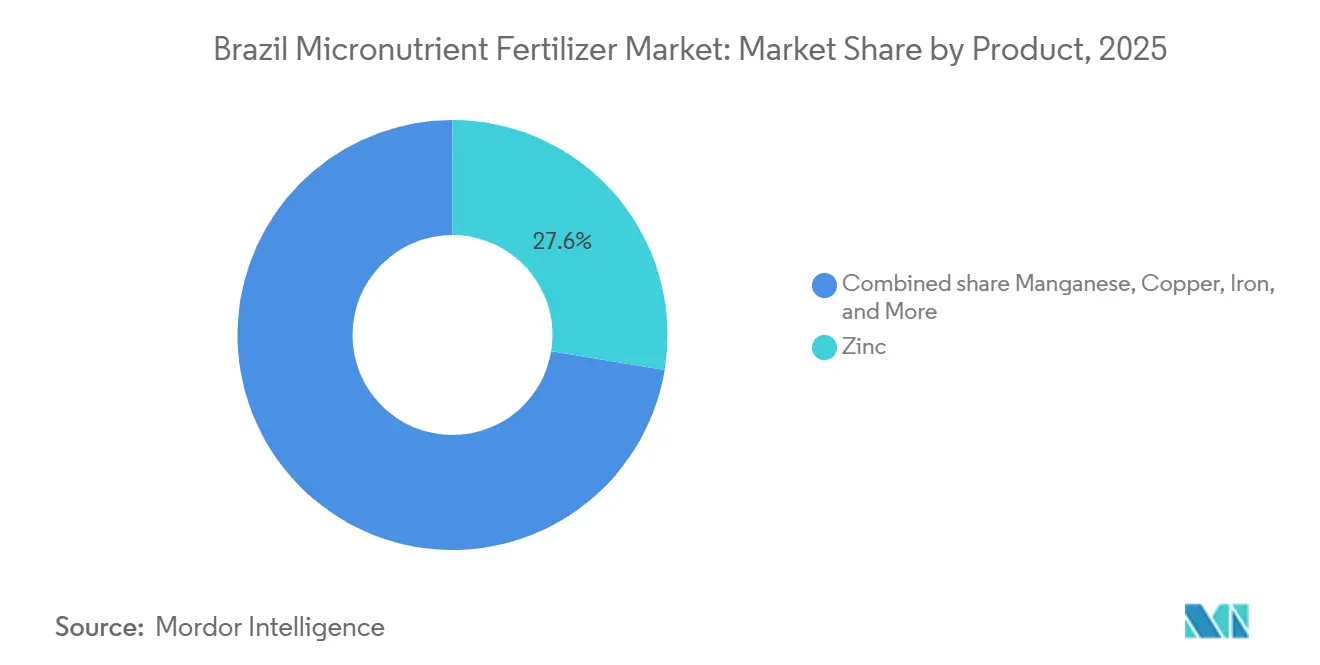
- By product, zinc held the largest Brazil micronutrient fertilizer market share at 27.6% in 2025, while molybdenum is projected to be the fastest-growing product segment, expanding at a CAGR of 7.0% from 2026 to 2031.
- By form, conventional fertilizers were the largest segment at 96.9% in 2025, while specialty fertilizers are the fastest-growing at a 9.2% CAGR from 2026 to 2031.
- By application mode, soil application was the largest segment at 93.6% in 2025, while fertigation is the fastest-growing at a 6.0% CAGR during 2026 to 2031.
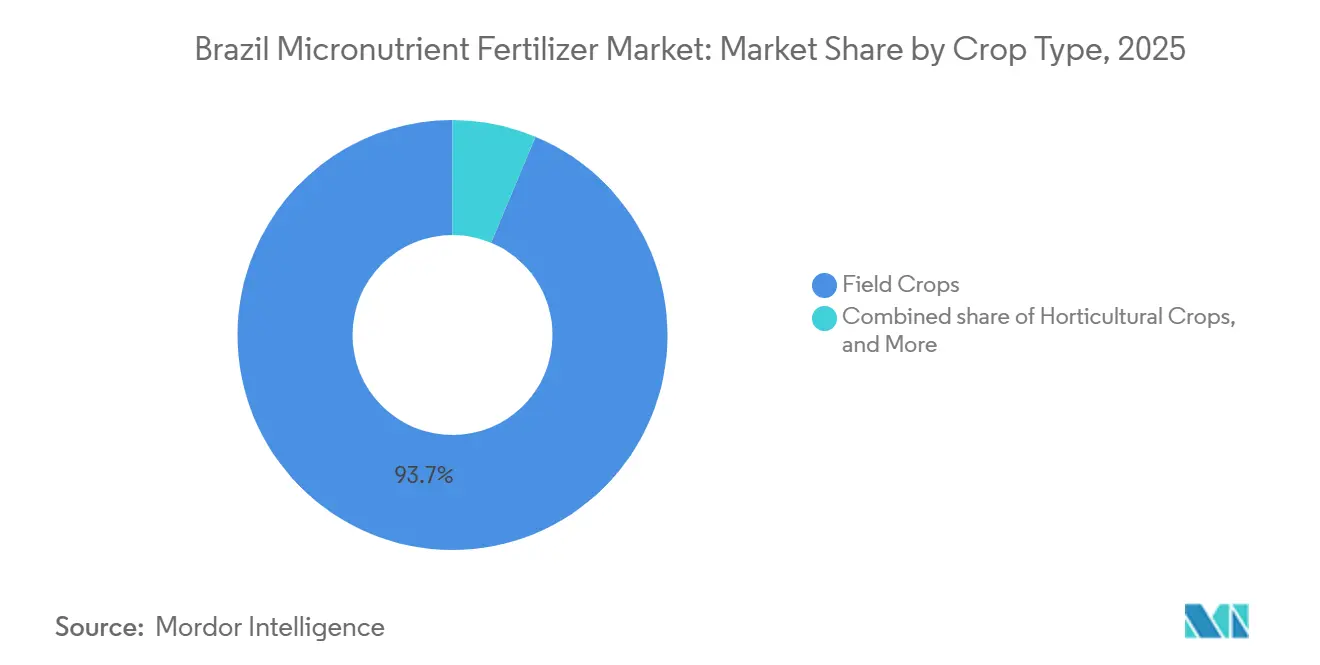
- By crop type, field crops accounted for the largest Brazil micronutrient fertilizer market size at 93.7% in 2025, while horticultural crops are the fastest-growing segment, rising at a CAGR of 8.8% through 2031.
Note: Market size and forecast figures in this report are generated using Mordor Intelligence’s proprietary estimation framework, updated with the latest available data and insights as of 2026.
Brazil Micronutrient Fertilizer Market Trends and Insights
Drivers Impact Analysis*
| Driver | (~) (%) Impact on CAGR Forecast | Geographic Relevance | Impact Timeline |
|---|---|---|---|
| Soil micronutrient depletion in high-yield regions | +1.2% | Center West, MATOPIBA, and Rio Grande do Sul | Medium term (2–4 years) |
| Climate-linked nutrient leaching spikes | +0.8% | Northern Brazil, MATOPIBA, and coastal zones | Short term (≤ 2 years) |
| Government soil-health subsidy programs | +0.9% | National, early gains in Mato Grosso, Goiás, and Paraná | Medium term (2–4 years) |
| Expansion of precision fertigation infrastructure | +1.1% | MATOPIBA, Center‑West, and São Paulo | Long term (≥ 4 years) |
| Rise of chelated nano-formulations for alkaline soils | +0.7% | Center‑West and MATOPIBA limestone belts | Long term (≥ 4 years) |
| Carbon-credit premiums rewarding balanced nutrition | +0.5% | Pilot zones in Mato Grosso and Pará | Long term (≥ 4 years) |
| Source: Mordor Intelligence | |||
Soil Micronutrient Depletion in High-Yield Regions
Decades of soybean–corn double-cropping have pushed zinc, boron, and manganese levels below critical thresholds on more than half of Cerrado hectares[1]Source: Empresa Brasileira de Pesquisa Agropecuária, “Micronutrient Deficiency in Brazilian Cerrado Soils 2024,” EMBRAPA, embrapa.br. In 2024, 62% of sampled fields in Mato Grosso had zinc concentrations near the critical threshold of 0.5 mg/kg, resulting in an 8–12% yield reduction in second-season corn due to impaired kernel development and reduced stress resilience. Trials utilizing low-dose zinc sulfate (2 kg/ha) resulted in a yield increase of 450 kg/ha, valued at USD 90 based on 2025 market prices. This demonstrates that targeted micronutrient application is among the most cost-effective methods for enhancing cereal productivity. No-till residues further immobilize micronutrients, encouraging growers to shift from reactive foliar sprays to preventive chelated dressings. As commodity margins tighten, low-dose but high-impact micronutrient strategies become essential for sustaining Brazil micronutrient fertilizer market growth.
Climate-Linked Nutrient Leaching Spikes
Although El Niño typically causes drying in the North-Northeast, certain areas of Maranhão experienced rainfall accumulations exceeding 700 mm in early 2025, surpassing historical averages due to localized summer instabilities[2]Source: Instituto Nacional de Meteorologia, “Precipitation Analysis 2024-2025,” INMET, inmet.gov.br. Heavy downpours flushed mobile boron and molybdenum out of sandy Oxisols, doubling the area showing deficiency symptoms in cotton and soybeans. In late 2025, growers responded with split boron applications and polymer-coated granules that cut leaching loss by 35% in field trials. Climate models project 12% more extreme rain events by 2030, making controlled-release formulations a hedge against wash-off risk. Accelerated adoption of cover crops such as Brachiaria improves nutrient scavenging, yet chemical replenishment remains indispensable, reinforcing demand within the Brazil micronutrient fertilizer market.
Government Soil-Health Subsidy Programs
The Low Carbon Agriculture Plan (Plano ABC+) reimburses half the cost of soil-restoration inputs, including chelated micronutrients, through the Sustainable Rural Credit line at the National Bank for Economic and Social Development[3]Source: Banco Nacional de Desenvolvimento Econômico e Social, “Plano ABC+ Financing Report 2025,” BNDES, bndes.gov.br. Under the 2024/2025 Plano Safra, credit lines for soil health boosted micronutrient adoption. With zinc sulfate prices halving to BRL 2.25 per kg (USD 0.45), annual applications offer a cost-effective strategy for mid-sized Brazilian farms. Reimbursements jump to 60% when producers use georeferenced sampling and variable-rate maps, accelerating the uptake of precision agriculture. Subsidized farms lifted soybean yields by 7% in 2025, validating the policy’s agronomic and fiscal paybacks.
Expansion of Precision Fertigation Infrastructure
Center-pivot irrigated hectares in the states of Maranhão, Tocantins, Piauí, and Bahia (MATOPIBA) doubled to 1.16 million between 2020 and 2025. Fertigation modules deliver chelated zinc, manganese, and iron with 85% uptake efficiency, compared with 55% for broadcast methods. Yara International reported 19% growth in YaraVita liquid micronutrient sales in 2025, largely from fertigation in cotton and coffee. Equipment vendors cut installation lead times to five months and trimmed capital costs 15% through bank-financed packages that shorten payback periods below three years. Lower per-hectare nutrient costs and precise timing anchor long-run expansion of the Brazil micronutrient fertilizer market.
Restraints Impact Analysis*
| Restraint | (~) (%) Impact on CAGR Forecast | Geographic Relevance | Impact Timeline |
|---|---|---|---|
| Price volatility of imported micronutrient ores | -0.9% | National, acute in import-dependent zones | Short term (≤ 2 years) |
| Knowledge gaps among Brazilian smallholders | -0.6% | National, concentrated in the Northeast | Medium term (2–4 years) |
| Stricter Conselho Nacional do Meio Ambiente (CONAMA) limits on synthetic chelating agents | -0.5% | Nationwide, enforcement focuses on São Paulo and Paraná | Medium term (2–4 years) |
| Competition from biological inoculants in organic systems | -0.4% | Organic coffee belts and Southeast sugarcane | Long term (≥ 4 years) |
| Source: Mordor Intelligence | |||
Price Volatility of Imported Micronutrient Ores
Global zinc prices increased by nearly 20% in 2024 but stabilized in 2025, with Brazilian imports totalling USD 260 million. During this time, Mosaic Fertilizantes experienced broader margin pressures in Brazil, driven by high sulfur costs and competition from imported phosphates, rather than localized zinc price fluctuations. Brazil relies on imports for 78% of its zinc oxide feedstock, exposing formulators to labor strikes in Peru and export-duty shifts in Australia. Small regional blenders lacking hedging tools passed costs straight to growers, depressing sub-50-hectare farm demand by 12% in early 2025. Domestic smelting capacity of 180,000 metric tons barely meets half of fertilizer needs, so supply security remains a structural vulnerability. Long-term offtake talks with Minas Gerais mining projects will not yield metal until after 2028, prolonging this drag on the Brazil micronutrient fertilizer market.
Knowledge Gaps Among Brazilian Smallholders
Almost half of farms with less than 50 hectares still diagnose deficiencies visually rather than through lab tests. Extension agents reach only 31% of smallholders in the Northeast, and retailer agronomists often lack training on specialty solutions. A 2024 survey found 64% of small farms were unaware that molybdenum supports nitrogen fixation, leading to poor inoculant performance and yield losses. Empresa Brasileira de Pesquisa Agropecuária (EMBRAPA’s) AgroDigital app attracted 120,000 users by 2025, yet smartphone access and digital literacy remain barriers. Bridging this gap requires sustained public funding and private advisory models to unleash the full potential of the Brazil micronutrient fertilizer market.
*Our forecasts treat driver/restraint impacts as directional, not additive. The impact forecasts reflect baseline growth, mix effects, and variable interactions.
Segment Analysis
By Product: Zinc Dominance Reflects Widespread Deficiency Patterns
Zinc accounted for 27.6% of 2025 revenue, anchoring the Brazil micronutrient fertilizer market at the field-crop scale. Molybdenum is slated for the fastest 7.0% CAGR as pulse and oilseed rotations demand better nitrogen fixation. Trials applying 2 kilograms per hectare of zinc sulfate yielded 450 kilograms per hectare of second-season corn, demonstrating a clear revenue boost and cementing demand for preventive soil dressings. Together, these two nutrients draw the most agronomic attention, anchoring baseline volume while signaling where the next premium gains will emerge.
Empresa Brasileira de Pesquisa Agropecuária (EMBRAPA) seed-treatment trials showed molybdenum lifting soybean nodulation by 18% and grain by 210 kilograms per hectare, validating rapid uptake. Chelated zinc-EDTA is increasingly adopted despite costing three times as much as zinc sulfate, due to its suitability for irrigated horticulture, where speed is highly valued. Manganese sulfate use in sugarcane jumped 14% as mills chase sucrose premiums, while nano-iron chelates serve high-pH vegetable belts. Balanced uptake across the stack sustains volume and supports premium formulations inside the Brazil micronutrient fertilizer market.


By Form: Conventional Dominates, Specialty Fertilizers Accelerate
Conventional fertilizer blends controlled a commanding 96.9% of the Brazilian micronutrient fertilizer market size in 2025 because every broadcast spreader and planter is already set up to handle them at a low delivered cost. Specialty fertilizers are projected to post the quickest 9.2% CAGR through 2031 as center-pivot irrigation and foliar programs seek higher uptake efficiency and fewer labor hours per hectare. Growers installing new fertigation modules report 30% better nutrient absorption with chelated liquids, offsetting their price premium and shortening payback periods. This split keeps bulk volume anchored in low-cost granules while channeling incremental value to soluble concentrates aligned with precision farming.
Other non-granular formats, including fully soluble suspensions and emulsions, serve niche situations where rapid leaf uptake or emitter compatibility matters most. These products gain traction in high-value horticulture and turf, where uniform nutrient distribution justifies higher per-liter pricing. Suppliers bundle agronomic advice with these alternatives to overcome user unfamiliarity and ensure correct dilution and timing. Collectively, the expanding menu of delivery formats broadens grower choice and cushions the market against any single technology shock.
By Application Mode: Soil Still Rules, Fertigation Ramps
Soil application captured 93.6% of the 2025 Brazil micronutrient fertilizer market share by leveraging planter-integrated band spreaders that need no extra capital outlay, while fertigation is projected to grow fastest at a 6.0% CAGR from 2026 to 2031 as center-pivot hectares in Maranhao, Tocantins, Piaui, and Bahia states (MATOPIBA), and the Center-West multiply and slashes labor costs. Split-dose fertigation aligns nutrient supply with crop uptake curves, trimming luxury consumption and runoff. Lindsay Corporation fitted 64% of the new pivots it sold in 2025 with injection modules, underscoring hardware pull-through for micronutrient delivery. This combination keeps soil delivery dominant yet shifts marginal growth toward soluble inputs.
Foliar sprays accounted for a limited market share but remain crucial for mid-season corrections, particularly when drought or high pH conditions hinder root nutrient uptake. This is especially significant for boron application during the cotton squaring stage. Band-in-furrow starters combine macronutrients with trace elements to promote early corn growth in cooler regions of South Brazil. Controlled-release coatings on granular fertilizers offer a balance between prolonged soil availability and the consistency of foliar applications, making them attractive to no-till farmers seeking to reduce field passes. As digital decision-making tools continue to advance, growers are anticipated to utilize these three approaches to address site-specific economic and environmental requirements.
By Crop Type: Field Crops Dominate, Horticulture Accelerates
Field crops accounted for 93.7% of the Brazil micronutrient fertilizer market in 2025, while horticultural crops are projected to register the fastest CAGR of 8.8% through 2031. The dominance of field crops reflects the extensive cultivation of soybean, corn, cotton, and sugarcane, which collectively drive substantial micronutrient consumption. Widespread use of zinc and boron across major grain-producing regions, particularly in Mato Grosso, reinforces the segment's large volume base. Continued efforts to improve nutrient-use efficiency and maximize yields are expected to sustain demand across Brazil's broadacre farming systems.
Horticultural crops represented a smaller share of the market but are expanding rapidly due to the increasing production of coffee, citrus, fruits, and vegetables that require precise micronutrient management to enhance quality, productivity, and export competitiveness. Cotton remains an important source of demand within the field-crop segment, relying on boron and zinc to support fiber development and uniformity. Sugarcane also contributes significantly to micronutrient consumption, with manganese and zinc applications helping improve crop vigor and sucrose productivity. The diversity of crop systems, ranging from large-scale grains and sugarcane to high-value horticultural production, supports resilient demand and strengthens the long-term growth outlook for the Brazil micronutrient fertilizer market.
Geography Analysis
Center-West remained the largest regional buyer, accounting for a prominent share of Brazil micronutrient fertilizer market size in 2025 as Mato Grosso’s soybean-corn acreage relies on routine zinc and boron top-ups. Maranhao, Tocantins, Piaui, and Bahia states (MATOPIBA) are poised for the fastest CAGR through 2031, as center-pivot irrigation doubled irrigated hectares and sandy soils require higher application rates. Growers in both regions are adopting variable-rate prescriptions that align doses with grid-sampled soil moisture deficits, improving uptake efficiency and reducing waste. These dynamics anchor national demand and shift incremental growth toward precision, soluble inputs.
Southeast demand stems from sugarcane mills in São Paulo that boost sucrose with manganese and from Minas Gerais coffee farms that use copper and boron sprays to secure quality premiums. The South depends on copper and manganese seed treatments in wheat and barley rotations and increasingly pairs them with controlled-release coatings to limit early leaching. Northeast growers in the São Francisco Valley fertigate chelated iron and zinc to sustain export-grade grapes and mangoes under saline water stress. The North remains a smaller outlet but is adding soybean hectares in Pará, creating pull for cost-efficient granular blends that tolerate acidic Oxisols.
Regional adoption patterns are converging around soil testing, government subsidies, and bundled advisory services that lower per-hectare costs and shorten payback periods. Subsidy expansion under Plano ABC+ now halves effective nutrient pricing in the states of Maranhao, Tocantins, Piaui, and Bahia (MATOPIBA) and the North, lifting first-time adoption among mid-sized farms. Pivot suppliers embed injector modules on new rigs, ensuring that every hectare brought under irrigation becomes a candidate for soluble chelates. As each zone upgrades agronomy and infrastructure, the combined effect keeps national consumption on a steady upward path.
Competitive Landscape
The top five suppliers, including Nutrien Ltd., Yara International ASA, The Mosaic Company, ICL Group Ltd., and Compo Expert GmbH. accounted for a significant share of Brazil micronutrient fertilizer sales in 2025, underscoring a moderately concentrated field that still leaves room for mid-tier challengers. Nutrien Ltd., leverages its 180-store retail network to bundle soil testing, prescription mapping, and financing, bringing one-stop solutions directly to Center-West growers. Yara International ASA builds loyalty through liquid chelate lines and on-farm agronomy teams that calibrate fertigation programs for the states of Maranhao, Tocantins, Piaui, and Bahia (MATOPIBA). Both leaders invest heavily in digital platforms that merge satellite imagery with soil data, cutting nutrient cost per hectare and deepening customer stickiness.
The Mosaic Company integrates zinc and boron into phosphate granules that shorten application passes, while ICL Group Ltd. focuses on water-soluble blends for high-value horticulture and drip systems. Compo Expert GmbH targets coffee and citrus belts with nano-chelated foliar sprays that overcome alkaline soil lock-up. BASF SE, Haifa Group, and regional blenders follow niche strategies such as biodegradable chelates, low-cost granular mixes, or proximity-driven distribution in grain corridors. Biological specialists, such as Simbiose Agro, work to reduce the use of synthetic inputs by mobilizing native soil nutrients in certified organic farmland.
Capacity expansions and service bundling frame the next growth wave. Yara International ASA 2026 Rondonópolis plant adds 45,000 metric tons of liquid capacity aimed at pivot owners, and Mosaic’s coated-blend line in Minas Gerais trims freight and lead times for Center-West deliveries. ICL Group Ltd. offers zero-interest terms through Banco do Brasil to advance specialty orders, while Nutrien channels venture capital into custom-blend startups that accelerate new chelate chemistry to market. As these investments mature, suppliers will widen product breadth, lock in agronomic advisory revenue, and propel overall market advancement.
Brazil Micronutrient Fertilizer Industry Leaders
Nutrien Ltd.
Yara International ASA
The Mosaic Company
ICL Group Ltd.
Compo Expert GmbH
- *Disclaimer: Major Players sorted in no particular order

Recent Industry Developments
- April 2026: EuroChem allocated USD 36 million to double its specialty micronutrient‐blend storage capacity across Brazil’s North and Northeast terminals by the end of 2025, ensuring faster in-season availability of tailor-made products for soybean and corn growers.
- September 2025: Adufértil, a subsidiary of Indorama Corporation, acquired liquid‐fertilizer specialist Fass Agro to accelerate leadership in Brazil’s high-efficiency liquid NPK and micronutrient segment, expanding its portfolio and regional footprint.
- February 2025: Haifa inaugurated its first South American specialty fertilizer blending unit in Uberlândia, Minas Gerais, with an initial annual capacity of 6,000 metric tons and a target of 30,000 metric tons within five years to serve fruit, vegetable, coffee, and corn growers.


Brazil Micronutrient Fertilizer Market Report Scope
The Brazil Micronutrient Fertilizer Market Report is Segmented by Product (Zinc, Manganese, Copper, Iron, Boron, Molybdenum, and Others), Form (Conventional and Specialty [Liquid Fertilizer and Water Soluble]), Application Mode (Soil, Foliar, and Fertigation), Crop Type (Field Crops, Horticultural Crops, and Turf and Ornamental). The Market Forecasts are Provided in Terms of Value (USD) and Volume (Units).
By Product
| Zinc |
| Manganese |
| Copper |
| Iron |
| Boron |
| Molybdenum |
| Others |
By Form
| Conventional | |
| Speciality | Liquid Fertilizer |
| Water Soluble |
By Application Mode
| Soil |
| Foliar |
| Fertigation |
By Crop Type
| Field Crops |
| Horticultural Crops |
| Turf & Ornamental |
| By Product | Zinc | |
| Manganese | ||
| Copper | ||
| Iron | ||
| Boron | ||
| Molybdenum | ||
| Others | ||
| By Form | Conventional | |
| Speciality | Liquid Fertilizer | |
| Water Soluble | ||
| By Application Mode | Soil | |
| Foliar | ||
| Fertigation | ||
| By Crop Type | Field Crops | |
| Horticultural Crops | ||
| Turf & Ornamental | ||


Market Definition
- MARKET ESTIMATION LEVEL - Market Estimations for various types of fertilizers has been done at the product-level and not at the nutrient-level.
- NUTRIENT TYPES COVERED - Micronutients: Zn, Mn, Cu, Fe, Mo, B, and Others
- AVERAGE NUTRIENT APPLICATION RATE - This refers to the average volume of nutrient consumed per hectare of farmland in each country.
- CROP TYPES COVERED - Field Crops: Cereals, Pulses, Oilseeds, and Fiber Crops Horticulture: Fruits, Vegetables, Plantation Crops and Spices, Turf Grass and Ornamentals
| Keyword | Definition |
|---|---|
| Fertilizer | Chemical substance applied to crops to ensure nutritional requirements, available in various forms such as granules, powders, liquid, water soluble, etc. |
| Specialty Fertilizer | Used for enhanced efficiency and nutrient availability applied through soil, foliar, and fertigation. Includes CRF, SRF, liquid fertilizer, and water soluble fertilizers. |
| Controlled-Release Fertilizers (CRF) | Coated with materials such as polymer, polymer-sulfur, and other materials such as resins to ensure nutrient availability to the crop for its entire life cycle. |
| Slow-Release Fertilizers (SRF) | Coated with materials such as sulfur, neem, etc., to ensure nutrient availability to the crop for a longer period. |
| Foliar Fertilizers | Consist of both liquid and water soluble fertilizers applied through foliar application. |
| Water-Soluble Fertilizers | Available in various forms including liquid, powder, etc., used in foliar and fertigation mode of fertilizer application. |
| Fertigation | Fertilizers applied through different irrigation systems such as drip irrigation, micro irrigation, sprinkler irrigation, etc. |
| Anhydrous Ammonia | Used as fertilizer, directly injected into the soil, available in gaseous liquid form. |
| Single Super Phosphate (SSP) | Phosphorus fertilizer containing only phosphorus which has lesser than or equal to 35%. |
| Triple Super Phosphate (TSP) | Phosphorus fertilizer containing only phosphorus greater than 35%. |
| Enhanced Efficiency Fertilizers | Fertilizers coated or treated with additional layers of various ingredients to make it more efficient compared to other fertilizers. |
| Conventional Fertilizer | Fertilizers applied to crops through traditional methods including broadcasting, row placement, ploughing soil placement, etc. |
| Chelated Micronutrients | Micronutrient fertilizers coated with chelating agents such as EDTA, EDDHA, DTPA, HEDTA, etc. |
| Liquid Fertilizers | Available in liquid form, majorly used for application of fertilizers to crops through foliar and fertigation. |


Research Methodology
Mordor Intelligence follows a four-step methodology in all our reports.
- Step-1: IDENTIFY KEY VARIABLES: In order to build a robust forecasting methodology, the variables and factors identified in Step-1 are tested against available historical market numbers. Through an iterative process, the variables required for market forecast are set and the model is built on the basis of these variables.
- Step-2: Build a Market Model: Market-size estimations for the forecast years are in nominal terms. Inflation is not a part of the pricing, and the average selling price (ASP) is kept constant throughout the forecast period for each country.
- Step-3: Validate and Finalize: In this important step, all market numbers, variables and analyst calls are validated through an extensive network of primary research experts from the market studied. The respondents are selected across levels and functions to generate a holistic picture of the market studied.
- Step-4: Research Outputs: Syndicated Reports, Custom Consulting Assignments, Databases & Subscription Platforms


