Market Overview
| Study Period | 2021 - 2031 |
|---|---|
| Forecast Data Period | 2026 - 2031 |
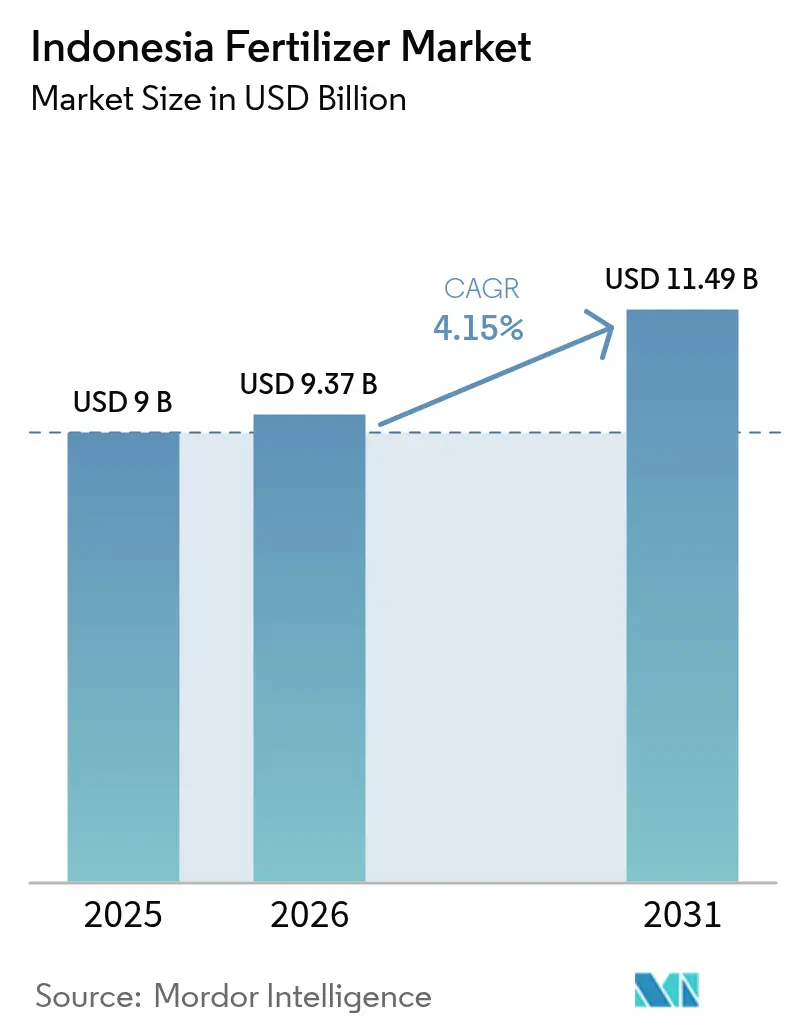
| Base Year Market Size (2025) | USD 9 Billion |
| Market Size (2026) | USD 9.37 Billion |
| Market Size (2031) | USD 11.49 Billion |
| Growth Rate (2026 - 2031) | 4.15% CAGR |
| Market Concentration | High |
Major Players *Disclaimer: Major Players sorted in no particular order Image © Mordor Intelligence. Reuse requires attribution under CC BY 4.0. | |
Indonesia Fertilizer Market Analysis by Mordor Intelligence
The Indonesia fertilizer market size was valued at USD 9 billion in 2025 and estimated to grow from USD 9.37 billion in 2026 to reach USD 11.49 billion by 2031, at a CAGR of 4.15% during the forecast period (2026-2031). Strong public funding for input subsidies and the replanting of aging oil-palm estates forms the backbone of demand across the Indonesia fertilizer market. A government allocation of 9.5 million metric tons of subsidized product under the Highest Retail Price scheme stabilizes consumption even when natural-gas prices spike, compressing producer margins. New NPK blending projects worth more than USD 1 billion enhance domestic value addition and keep the Indonesia fertilizer market on track to serve regional export demand. Competitive dynamics reflect extreme market concentration, with the top 5 companies, including PT Pupuk Kalimantan Timur (PKT), PT Petrokimia Gresik, Wilmar International Limited, PT Saraswanti Anugerah Makmur Tbk, and Agrifert Marketing Pte Ltd (Kuok Group), maintaining significant positions through integrated palm oil operations. This concentration creates both operational efficiency and strategic vulnerability, as supply disruptions from major producers can significantly impact national food security.
Key Report Takeaways
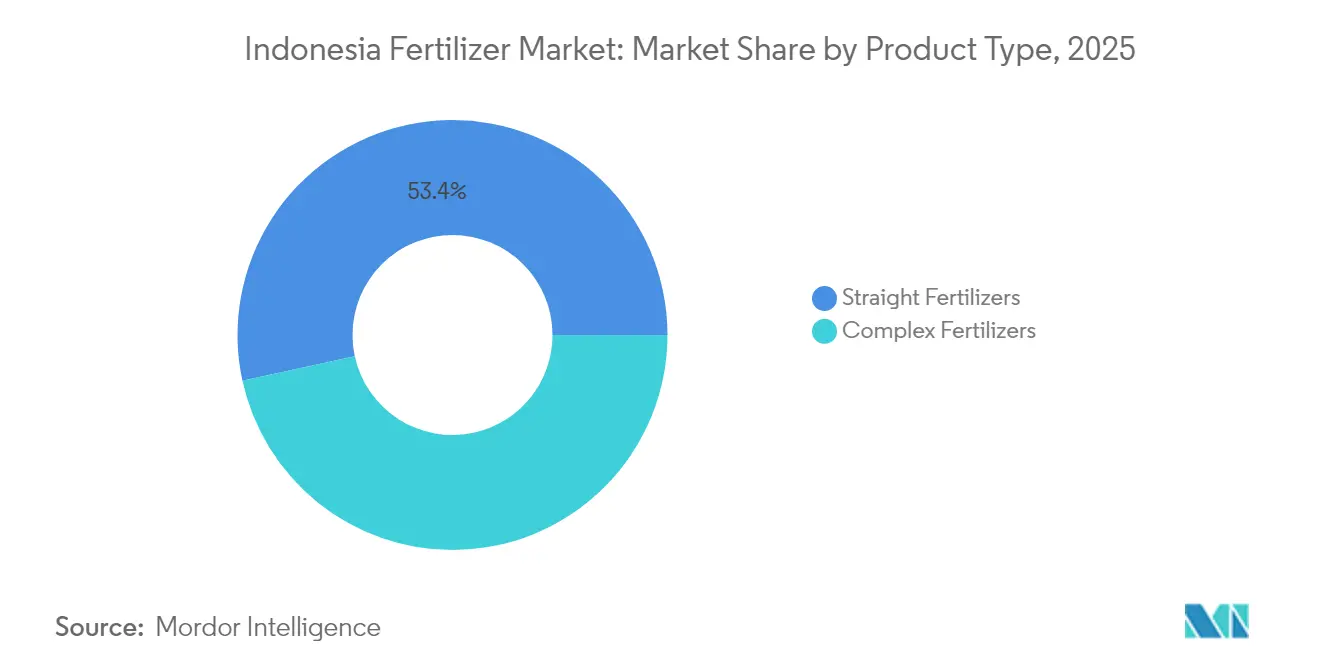
- By product type, straight fertilizers captured 53.42% of the Indonesia fertilizer market share in 2025. Micronutrient fertilizers are projected to expand at a 7.96% CAGR through 2031, making them the fastest-growing product category.
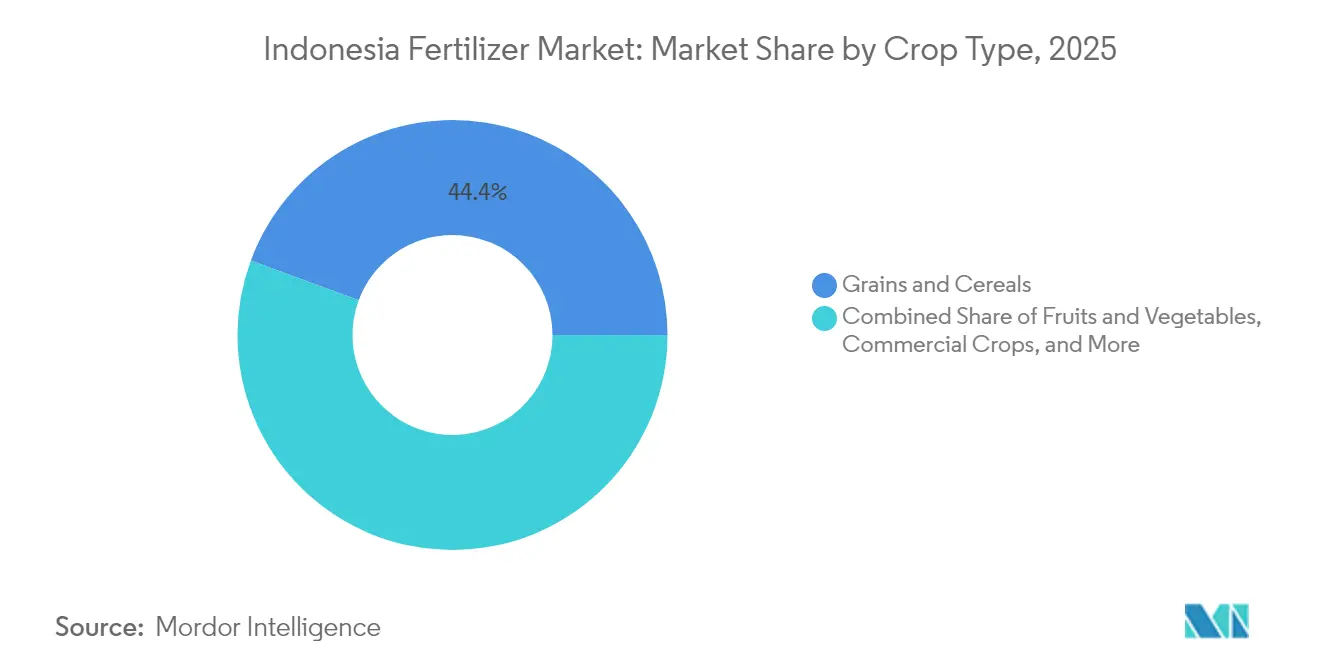
- By crop type, grains and cereals commanded 44.36% of the Indonesia fertilizer market share in 2025, and the fruits and vegetables are forecast to register the quickest growth at a 6.4% CAGR to 2031.
Note: Market size and forecast figures in this report are generated using Mordor Intelligence’s proprietary estimation framework, updated with the latest available data and insights as of 2026.
Indonesia Fertilizer Market Trends and Insights
Drivers Impact Analysis*
| Driver | (~) % Impact on CAGR Forecast | Geographic Relevance | Impact Timeline |
|---|---|---|---|
| Government fertilizer subsidy (HET) expansion | +1.2% | Java, Sumatra, and Sulawesi | Medium term (2–4 years) |
| Rice and corn self-sufficiency programs | +0.8% | Java, Sumatra, and Kalimantan | Long term (≥ 4 years) |
| New NPK blending plants under Pupuk Indonesia | +0.6% | Java and Sumatra | Medium term (2–4 years) |
| Palm-oil plantation replanting cycle | +0.5% | Sumatra, Kalimantan, and Papua | Long term (≥ 4 years) |
| Growth in export-oriented horticulture needs specialty nutrients | +0.4% | Java, Sumatra, and Eastern regions | Medium term (2–4 years) |
| Early adoption of drone-based precision fertilization in Java | +0.3% | Java (early) then nationwide | Long term (≥ 4 years) |
| Source: Mordor Intelligence | |||
Government Fertilizer Subsidy (HET) Expansion
As per the Indonesian ministry, the 2025 budget earmarked 9.5 million metric tons of subsidized fertilizer, 4.6 million metric tons of urea, 4.2 million metric tons of NPK, and 500,000 metric tons of organic keeping prices at IDR 2,250/kg (USD 0.14) for urea and IDR 2,300/kg (USD 0.15) for NPK, levels far below commercial quotations[1].Source: BSIP Serealia Public Relations, “2024 Fertilizer Quota Rises to 9.55 Million Tons,” Ministry of Agriculture, serealia.bsip.pertanian.go.id This guaranteed volume underpins the Indonesia fertilizer market even as fiscal outlays approach USD 3.3 billion, roughly 2.8% of GDP. By linking deliveries to the e-RDKK farmer database, authorities minimize leakages and channel nutrients to priority crops. Suppliers also gain visibility on quarterly offtake, allowing smoother production scheduling and working-capital planning.
Rice And Corn Self-Sufficiency Programs
President Prabowo targets rice self-sufficiency by 2026 and corn self-sufficiency within three years, spurring wider adoption of balanced NPK over single-nutrient products across new cultivation zones in Sulawesi and Kalimantan. Higher planting density and double-cropping schedules lift per-hectare nutrient requirements, offsetting future efficiency gains from precision farming. Seed packages issued under the Kartini Tani program include fertilizer recommendations, nudging farmers toward integrated soil fertility management. Private distributors report that demand for zinc-enriched NPK has tripled in the eastern islands since mid-2024.
New NPK Blending Plants Under Pupuk Indonesia
Pupuk Indonesia is commissioning 2 million metric tons per year of extra NPK blending capacity, lifting national nameplate output to 14 million metric tons and cutting reliance on imports for complex formulations[2].Source: Sinta Ambarwati, “Pupuk Indonesia Reveals 2024 Production Capacity Reaches 14 Million Tons,” Antara News, antaranews.com. The new lines incorporate in-line coating systems that tailor micronutrient content by micro-region, an innovation that improves crop response and reduces wastage. Local sourcing of phosphate rock from Kalimantan further enhances the cost profile and shields the Indonesia fertilizer market from global freight volatility. Early offtake agreements indicate that 15% of incremental output could reach neighboring Association of Southeast Asian Nations (ASEAN) states by 2027.
Palm-Oil Plantation Replanting Cycle
Indonesian government funding for the People’s Oil Palm Rejuvenation program doubled to IDR 60 million (USD 3,750) per hectare, locking in predictable fertilizer demand during the three-year establishment phase of 180,000 hectares annually [3]Source: BSIP Serealia Public Relations, “Starting 1 January 2025, Subsidized Fertilizers Ready for Distribution,” Ministry of Agriculture, serealia.bsip.pertanian.go.id. Trials by PT Petrokimia Gresik show that chloride-free K-Mag blends boost early frond growth by 12% relative to muriate of potash, creating headroom for premium pricing. Estate managers are shifting from annual bulk purchases to trimester call-off contracts that stagger deliveries and smooth warehouse loads. Banks now bundle fertilizer credit lines into replanting loans, reinforcing consumption visibility through 2030.
Restraints Impact Analysis*
| Restraint | (~) % Impact on CAGR Forecast | Geographic Relevance | Impact Timeline |
|---|---|---|---|
| Subsidy budget cuts creating supply gaps | −0.9% | Nationwide, outer islands worst hit | Short term (≤ 2 years) |
| Natural-gas price volatility raising urea costs | −0.7% | Nationwide production hubs | Medium term (2–4 years) |
| Proliferation of counterfeit fertilizers in informal channels | −0.4% | Rural Sumatra and Kalimantan | Medium term (2–4 years) |
| Environmental pressure on peatland nutrient runoff | −0.3% | Sumatra, Kalimantan peat zones | Long term (≥ 4 years) |
| Source: Mordor Intelligence | |||
Natural-Gas Price Volatility Raising Urea Costs
Regasified LNG now trades at USD 16.77 per MMBtu versus USD 6 under the previous subsidy, adding USD 50–70 to the cost of every metric ton of urea and squeezing margins for domestic manufacturers. Producers seek long-term gas contracts indexed to Brent-minus formulas to stabilize input costs. Several plants are evaluating carbon-capture linked blue ammonia pathways to unlock concessional finance and hedge against fossil fuel volatility.
Environmental Pressure on Peatland Nutrient Runoff
Heightened scrutiny of nutrient runoff and carbon emissions in peat ecosystems could impose stricter application caps, restraining demand growth in plantation-heavy provinces. Draft guidelines envisage mandating 30% organic matter incorporation and banning ammonium-based fertilizers during peak rainfall months. Plantation companies are piloting slow-release pellets and biochar blends that cut leaching losses by up to 40%, potentially absorbing some of the policy shock.
*Our forecasts treat driver/restraint impacts as directional, not additive. The impact forecasts reflect baseline growth, mix effects, and variable interactions.
Segment Analysis
By Product Type: Nitrogenous grades hold the largest share
Straight fertilizers led with 53.42% of the Indonesia fertilizer market share in 2025, a position anchored by urea’s 60% slice of nitrogen volume and by the government’s HET-backed allocation of 4.6 million metric tons for the 2025 season. Abundant local ammonia feedstock keeps urea costs low, while wide dealer networks push product into remote rice and corn belts that consume the bulk of nitrogen inputs under the swasembada pangan plan. Calcium ammonium nitrate and ammonium sulfate fill soil-specific niches, and in-country ammonia synthesis largely feeds domestic demand, reinforcing leadership for nitrogenous grades within the Indonesia fertilizer market size.
Micronutrient fertilizers post the quickest climb, advancing at an 7.96% CAGR to 2031 as precision farming spreads from Java to Sumatra and supports export-oriented horticulture. Complex NPK sales also rise steadily because 2 million metric tons of new blending capacity lifts national nameplate output to 14 million metric tons, curbing reliance on imports and tailoring micronutrient coatings by micro-region. Phosphatic and potash grades remain exposed to freight swings because Indonesia imports almost all DAP, MAP, and MOP, while secondary nutrients gain traction in acidic soils across Kalimantan and Sumatra that limit long-term plantation yields.


By Crop Type: Grains and cereals dominate demand
Grains and cereals absorbed 44.36% of total nutrients in 2025, led by rice fields that alone consumed 40% of the Indonesia fertilizer market size across Java, Sumatra, and Sulawesi. Government goals of rice self-sufficiency by 2026 and a 48% year-on-year jump in corn harvests during Q1-2025 keep per-hectare application rates high at 250–300 kg, far above regional norms. Subsidies mute price sensitivity and lock in steady offtake, ensuring that grains remain the volume anchor for the Indonesia fertilizer market share.
Fruits and vegetables represent the fastest-growing use case, set to expand at a 6.4% CAGR through 2031 as premium export contracts justify 400–500 kg nutrient regimes and drive disproportionate impact on total value. Palm-oil estates continue to add steady tonnage through the People’s Oil Palm Rejuvenation program, which funds IDR 60 million (USD 3,750) per hectare of young plantings and keeps potassium and phosphorus pulls firm. Pulses and oilseeds record moderate gains, while turf and ornamental demand remains a niche tied to urban landscaping budgets in Jakarta and Surabaya.
Geography Analysis
Java consumed a significant portion of total nutrients in 2025, making it the single largest provincial cluster within the Indonesia fertilizer market. Dense irrigation networks, paved rural roads, and proximity to Surabaya and Jakarta ports compress freight spreads to only 5 percent above plant-gate quotations. The island’s double-rice seasons and rising vegetable exports further lock in steady urea and micronutrient pulls. Precision drone services emerge first here because mobile connectivity and farmer education levels are highest, accelerating the shift toward variable-rate blends.
Sumatra accounts for a major share of national offtake, powered by oil-palm estates that favor potassium-rich mixes and rice zones scattered across river plains. Fertilizer barging on the Musi and Siak rivers lowers logistics bills, but inland last-mile costs still push retail tags up by 15% over Java benchmarks. Potash cargoes land at Belawan and Dumai, then move by trucking convoys aligned with plantation replanting calendars, creating visible quarterly spikes in the Indonesia fertilizer market. Sulawesi’s share continues to rise on the back of hybrid corn adoption, while central cocoa groves switch to sulfate-based inputs that correct soil acidity.
Eastern Indonesia, including Kalimantan, Papua, Maluku, and Nusa Tenggara, represents the smallest yet fastest growing pool, adding 5–7% annually from a low base. Kalimantan’s transmigration farms and new oil-palm concessions generate predictable bulk orders, although peatland nutrient caps may temper long-run volumes. Papua’s upcoming USD 1 billion fertilizer complex at Fakfak will cut delivery lead times by 40 days once operational and expand coastal distribution to smallholder cassava and sago plots. Remote islands still face weather disruptions that inflate retail quotes by up to 25%, pushing authorities to test sea-tanker subsidy corridors to harmonize prices across the Indonesia fertilizer market.
Regulatory Landscape
Indonesia regulates fertilizers through a mix of subsidized distribution governance, pricing controls under the Highest Retail Price (HET) scheme, and product quality compliance. Subsidized fertilizer management is anchored by Presidential Regulation (Perpres) No. 6 of 2025 as revised by Perpres No. 113 of 2025, with implementation taking effect from January 1, 2026. The update includes changes to the payment and governance scheme for PT Pupuk Indonesia and the channeling of subsidized volumes through registered farmer data (e-RDKK).
In 2026, the Ministry of Agriculture also updated implementing rules, including Permentan No. 03 of 2026 to refine procurement and distribution execution, and Permentan No. 06 of 2026 to set calculation methods for the commercial value and raw material components of subsidized fertilizers, replacing earlier cost-based calculation approaches. Quality and conformity requirements remain a compliance layer for blended products sold nationwide. Mandatory Indonesian National Standard (SNI) certification continues to apply for solid NPK fertilizers manufactured, imported, or distributed in Indonesia, supported by administrative processes linked to the Industrial Information System (SIINas). At the same time, the Ministry of Industry issued Regulation No. 9 of 2026 (May 25, 2026), which revoked prior mandatory SNI requirements for certain single inorganic fertilizers, changing the compliance burden for parts of the straight-fertilizer segment while keeping scrutiny on regulated formulations used in subsidy programs and broad retail distribution.
Competitive Landscape
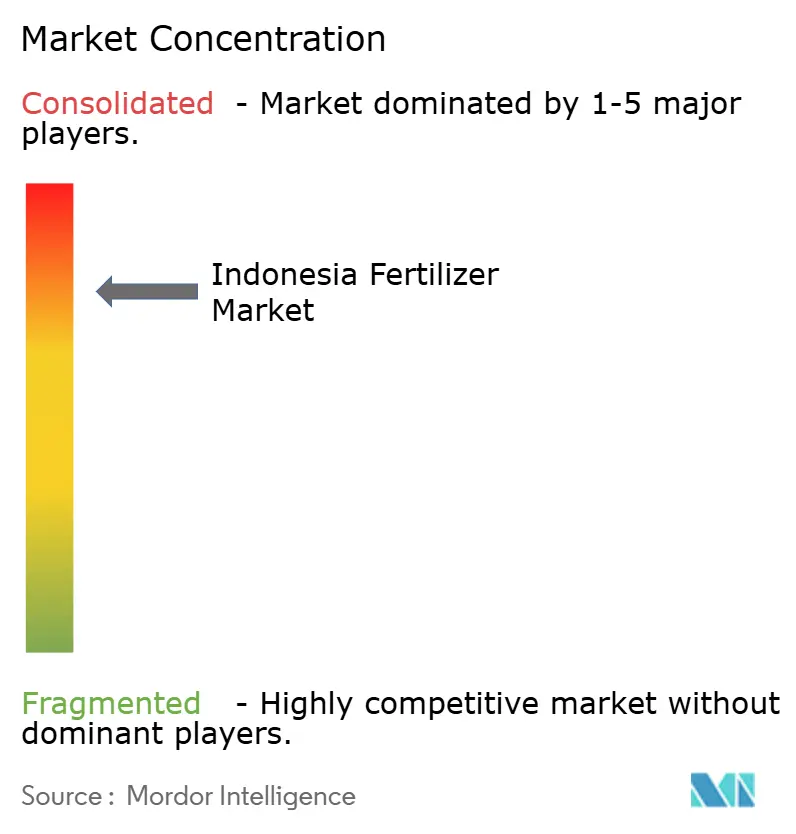
Indonesia’s fertilizer market shows a distinct high market concentration profile where the top five producers account for 84% of national volume and set the tone for pricing discipline and supply reliability. Indonesia's fertilizer market is oligopolistic, with the top five producers, PT Pupuk Kalimantan Timur (PKT), PT Petrokimia Gresik, Wilmar International Limited, Agrifert Marketing Pte Ltd (Kuok Group), and PT Saraswanti Anugerah Makmur Tbk, holding the largest share, while players focused on potash and diammonium phosphate cargos concede share to local blenders when global freight spikes widen landed-cost differentials.
Competition increasingly revolves around technology adoption rather than headline capacity alone. Pupuk Indonesia has partnered with Toyo Engineering and Itochu to build the GAIA (Green Ammonia Initiative) in Aceh, a hybrid electrolyzer and natural-gas setup that could shave 450,000 metric tons of carbon emissions each year once fully scaled. Yara International’s local subsidiary pursues a premium-service model in which agronomists conduct on-farm soil sampling and prescribe customized blends that command up to 18% pricing uplift over commodity grades. ICL Group concentrates on water-soluble and chelated micronutrients for greenhouse peppers and export-oriented mango orchards in West Java.
Mergers and listings are poised to reshape the field over the next five years. Pupuk Kaltim has initiated documentation for an initial public offering that would mark the first partial privatization inside the state fertilizer family and raise capital for a proposed USD 800 million brownfield expansion. Mergers and listings could strengthen loyalty and shield leading players from low-cost imports in the long term.
Indonesia Fertilizer Industry Leaders
PT Pupuk Kalimantan Timur (PKT)
PT Petrokimia Gresik
Wilmar International Limited
PT Saraswanti Anugerah Makmur Tbk
Agrifert Marketing Pte Ltd (Kuok Group)
- *Disclaimer: Major Players sorted in no particular order

Market Opportunities and Future Outlook
A near-term opportunity is the production modernization and import-substitution investment cycle led by Pupuk Indonesia, which ties back to Indonesia's subsidy-backed volume base and the need to manage supply risk under gas-cost volatility. In April 2026, Pupuk Indonesia disclosed progress across seven major facility projects totaling about Rp 77 trillion, spanning ammonia-urea revamps and new downstream capability such as NPK nitrat at Pupuk Kujang Cikampek. The disclosures also covered projects with distribution relevance, including the Fakfak fertilizer project in West Papua.
These programs open space for technology vendors, EPC and retrofit contractors, and specialized raw-material logistics that support NPK and phosphate-related value chains. This is particularly relevant where domestic blending capacity is being increased and more complex formulations are being pushed for food crops and plantations. A second opportunity area comes from subsidized fertilizer distribution governance changes and the associated digital and last-mile enablement needs. Recent reforms streamlined subsidized fertilizer distribution toward a more direct pathway from PT Pupuk Indonesia to registered farmers, and government reporting in 2026 highlighted a measurable reduction in distribution bureaucracy and costs, alongside continued large annual allocations for subsidized fertilizers. That shift supports solutions centered on traceability, anti-counterfeit controls, dealer enablement, and precision nutrition offerings that can be aligned with e-RDKK-linked demand signals. Specialty nutrients and customized NPK mixes also gain room where export-oriented horticulture and micro-region coating and blending initiatives are being adopted by large manufacturers, supporting micronutrients, water-soluble fertilizers, and agronomy services in intensive production zones such as Java and selected horticulture belts.
Recent Industry Developments
- July 2026: PT Petrokimia Gresik reported progress on modifying its Phosphate Plant I into a Phonska V plant using Flex-Phos technology, enabling production flexibility across NPK Phonska, NPK solid granulation, and phosphate fertilizers. The upgrade strengthens the domestic complex-fertilizer slate and helps the company adjust product mix when raw material economics shift.
- April 2026: PT Pupuk Kalimantan Timur (Pupuk Kaltim) announced an investment of about Rp 900 billion to revamp Ammonia Plant-2, targeting higher efficiency and lower gas consumption. The investment supports cost control in upstream nitrogen production, which is central to urea availability and pricing discipline in Indonesia.
- January 2026: PT Petrokimia Gresik started construction of two sulfuric acid storage tanks with a combined 40,000-ton capacity in Gresik, East Java, with completion targeted for May 2027. Added storage improves raw material security for NPK and related downstream products, reducing operational risk during peak demand and import-logistics disruptions.


Research Methodology Framework and Report Scope
Market Definition and Coverage
For this study, the market is defined as the value of fertilizers sold for agricultural and allied crop use within Indonesia, covering straight and complex products across the main nutrient categories and micronutrients, measured in USD for the stated year.
Scope exclusions: We exclude on-farm manure and compost that are not sold as standardized commercial fertilizer products, as well as farm services that may be bundled with input advisory.
Segmentation Overview
- By Product Type
- Complex Fertilizers
- Straight Fertilizers
- Nitrogenous Fertilizers
- Urea
- Calcium Ammonium Nitrate (CAN)
- Ammonia
- Ammonium Nitrate
- Ammonium Sulfate
- Other Nitrogenous Fertilizers
- Phosphatic Fertilizers
- Mono-ammonium Phosphate (MAP)
- Di-ammonium Phosphate (DAP)
- Triple Super-phosphate (TSP)
- Other Phosphatic Fertilizers
- Potash Fertilizers
- Muriate of Potash (MOP)
- Other Potash Fertilizers
- Secondary Nutrient Fertilizers
- Micronutrients
- Nitrogenous Fertilizers
- By Crop Type
- Grains and Cereals
- Pulses and Oil Seeds
- Commercial Crops
- Fruits and Vegetables
- Turf and Ornamental Crops
Data Sources, Market Sizing, and Validation
Desk Research
Desk research started with building the demand and supply context for Indonesia using public, citable datasets, then narrowing them to fertilizer-relevant indicators. Sources such as FAOSTAT, World Bank data, and official Indonesian agriculture statistics were used to track crop area trends, yields, and fertilizer intensity signals, which helps keep the market size tied to actual agronomic activity.
To add trade and price context, we reviewed import and export statistics (such as UN Comtrade and customs-linked releases), publications from international fertilizer and nutrient associations, and peer-reviewed agronomy and soil nutrition papers that cite typical application rates by crop. Company annual reports, investor presentations, and reputed press were used for capacity additions, policy changes, and channel shifts, and we referenced paid subscription material for financials and another for patent activity selectively to cross-check business scale and innovation focus. The desk sources listed here are illustrative only, and many other public and paid references were used during data collection, clarification, and validation.
Primary Interviews and Surveys
Primary work was used to pressure-test the desk assumptions that typically move the final value number, especially realized pricing, subsidy pass-through, and how different crops pull demand across seasons. We spoke with producers, importers, distributors, large farm operators, and agronomy advisors across Indonesia so the model could be adjusted where paperwork data was slow or mixed. Where inputs differed by crop or channel, we followed up to ensure the final sizing matched what is actually purchased and applied.
Distribution of primary research fieldwork respondents
| Company type | Respondent position | Region |
|---|---|---|
| Top tier: 26% | CXOs: 12% | |
| Mid tier: 54% | Functional/Unit leaders: 32% | |
| Smaller Players: 20% | Managers: 56% |
Market-Sizing & Forecasting
The core model was built using a top-down approach where Indonesia crop area and planting patterns, nutrient application intensity by crop, and the shifting split between straight and complex products are translated into an implied consumption pool, which is then priced using observed ranges. Once that structure was set, we added selective bottom-up approximations, like sampled price times volume checks by major product groups and channel feedback, and then adjusted totals when the two views did not align.
Key inputs that shaped the sizing included planted area changes for major crops, typical nutrient demand per hectare (and how it changes with yield targets), subsidy allocation and eligibility mechanics that affect offtake timing, import dependency for certain nutrients that moves landed costs, and observed retail versus subsidized price gaps. For forecasting, we relied mainly on scenario analysis, since policy choices and input price shocks can change demand quickly, and then anchored scenarios to expert expectations on cropping patterns, subsidy continuity, and gradual pricing normalization.
Data Validation & Update Cycle
Outputs were validated in multiple passes, starting with unit checks so that area, nutrient intensity, and pricing produced realistic implied volumes and values. We flagged anomalies when year-over-year jumps conflicted with crop area trends, subsidy announcements, or trade signals, then re-checked assumptions through quick re-contacts and targeted desk refreshes.
Before sign-off, the model is reviewed by another analyst for logic consistency and arithmetic accuracy. Final values were compared with independent indicators like fertilizer import movements and major crop planting trends. Reports are refreshed annually, and when a material policy change or supply disruption occurs, we run an interim update so the published view stays current. Right before delivery, a final review pass is completed to reflect the latest available public releases.
Mordor Intelligence's Fertilizers Market Indonesia Market Size Versus Other Published Estimates
Published market sizes for Indonesia fertilizers often differ because the scope boundary is not always the same, and because pricing and policy assumptions are handled differently from one study to another. Differences also show up when one estimate is closer to farmer purchase prices while another leans toward manufacturer-level values or a narrower product basket.
The table shows a wide spread that is largely explained by what is counted in the value numerator and how pricing is treated across subsidized and non-subsidized channels. In Mordor Intelligence's model, the value is built to include straight and complex fertilizers across nutrient types for Indonesia, while being disciplined about excluding non-commercial on-farm organics and keeping pricing tied to observed channel realities for the stated year.
Benchmark comparison
| Source | Market Size | Gaps in Research Methodology |
|---|---|---|
| Mordor Intelligence | USD 9.00 B (2025) | |
| Industry Publisher A | USD 2.20 B (2025) | Uses a narrower value basis that appears closer to select fertilizer categories and may not fully account for the broader straight plus complex basket and channel-level price differences that lift total market value. |
| Consultancy B | USD 4.50 B (2024) | Uses a different base year and a higher-growth forward curve, which can shift the starting value, and its channel and product inclusions are framed differently, creating a non-like-for-like comparison with a 2025 value baseline. |
Taken together, the comparison suggests that scope definition and price treatment drive most of the gap, more than simple math differences. By keeping the model traceable to crop-linked demand signals and then checking it with channel feedback, the estimate stays repeatable and easier to explain when assumptions need to be updated.


Key Questions Answered in the Report
What is the current value of the Indonesia fertilizer market?
The Indonesia fertilizer market size stands at USD 9.37 billion in 2026 and is forecast to reach USD 11.49 billion by 2031.
How concentrated is Indonesia’s fertilizer supply base?
The top five producers control 84% of national sales, including PT Pupuk Kalimantan Timur (PKT), which maintains the largest share, followed by Sister firm PT Petrokimia Gresik, Wilmar International Limited, Agrifert Marketing Pte Ltd (Kuok Group), and PT Saraswanti Anugerah Makmur Tbk.
What role do subsidies play in fertilizer demand?
Government subsidies cover 9.5 million metric tons a year, anchor baseline consumption, and keep farmer purchase prices well below global averages.
How are gas prices affecting local fertilizer producers?
A jump to USD 16.77 per MMBtu for regasified LNG has added up to USD 50-70 to each ton of urea, squeezing margins unless offset by green-ammonia investments.
Page last updated on:


