
Market Overview
| Study Period | 2021 - 2031 |
|---|---|
| Forecast Data Period | 2026 - 2031 |
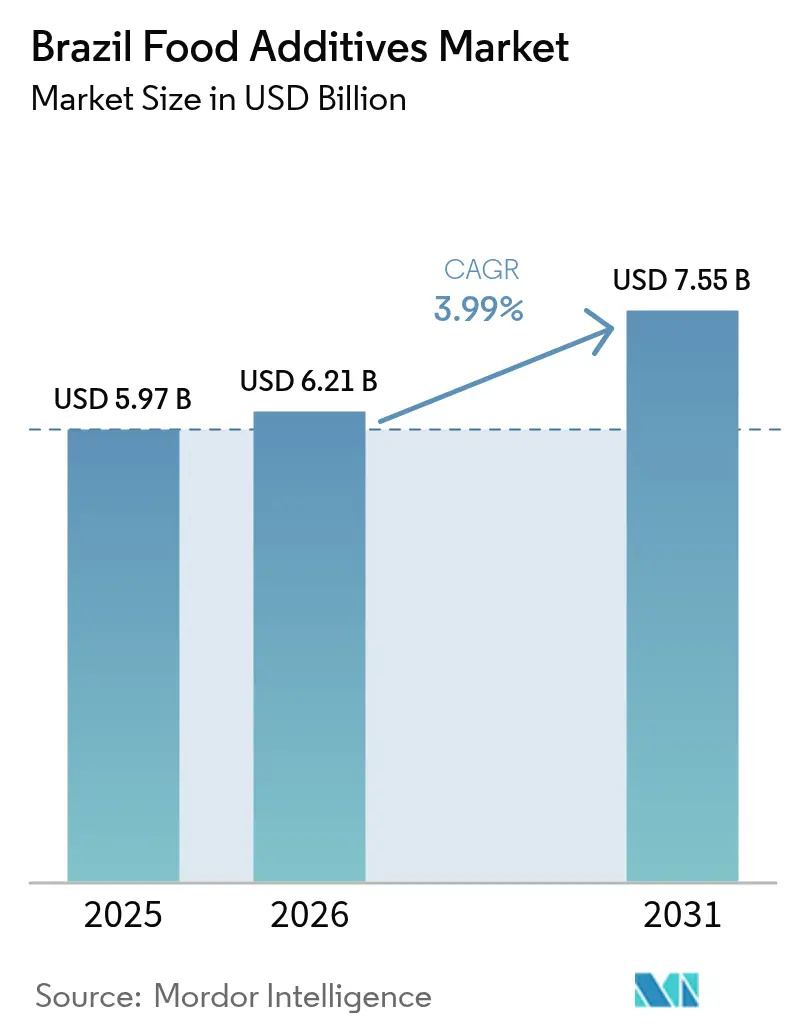
| Base Year Market Size (2025) | USD 5.97 Billion |
| Market Size (2026) | USD 6.21 Billion |
| Market Size (2031) | USD 7.55 Billion |
| Growth Rate (2026 - 2031) | 3.99 % |
| Market Concentration | Medium |
Major Players *Disclaimer: Major Players sorted in no particular order Image © Mordor Intelligence. Reuse requires attribution under CC BY 4.0. | |
Brazil Food Additives Market Analysis by Mordor Intelligence
The Brazil food additive market size was valued at USD 5.97 billion in 2025 and estimated to grow from USD 6.21 billion in 2026 to reach USD 7.55 billion by 2031, at a CAGR of 3.99% during the forecast period (2026-2031). This growth underscores Brazil's position as Latin America's largest food processor and a leading exporter of sugar. However, the implementation of stricter domestic regulations is exerting pressure on profit margins, even as demand volumes continue to rise. Key drivers of this growth include sustained urbanization, increasing disposable incomes, and a structural shift among consumers toward packaged convenience foods. Regulatory initiatives, such as front-of-package labeling (FOPL) requirements and selective taxation policies, are accelerating reformulation efforts within the industry. These measures have led to a growing preference for clean-label natural colorants and high-intensity sweeteners, despite their higher cost implications. In response, multinational corporations are investing in expanded production capacities for hydrocolloids, premixes, and precision dosing systems to strengthen their market presence. Meanwhile, small and medium enterprises, which represent the majority of market participants, face significant challenges in managing compliance costs. Furthermore, public consultations on the authorization of new additives offer incremental growth opportunities, although extended timelines for dossier preparation are delaying commercialization processes. These interconnected factors collectively shape the competitive dynamics of the Brazil food additive market.
Key Report Takeaways
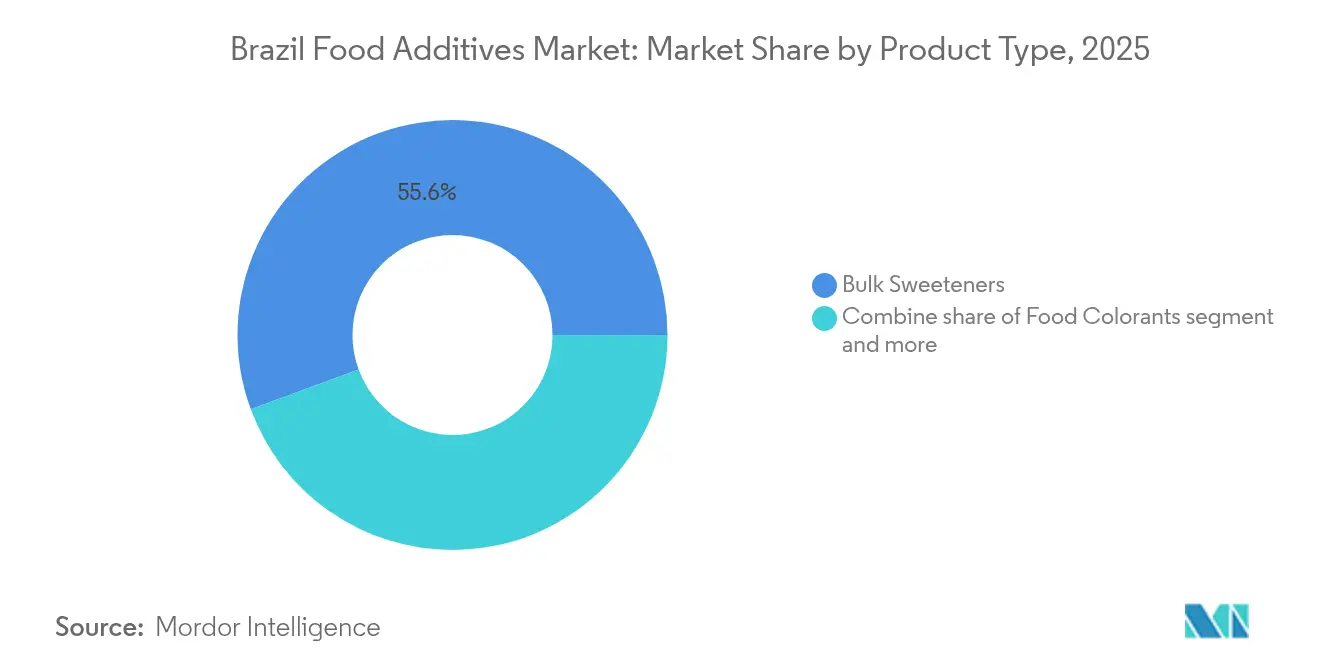
- By product type, bulk sweeteners held 55.62% of Brazil food additive market share in 2025, while natural colorants are forecast to expand at the quickest 5.48% CAGR to 2031.
- By form, dry formats commanded 67.75% of the Brazil food additive market size in 2025; liquid formats are poised to grow at 5.06% CAGR through 2031.
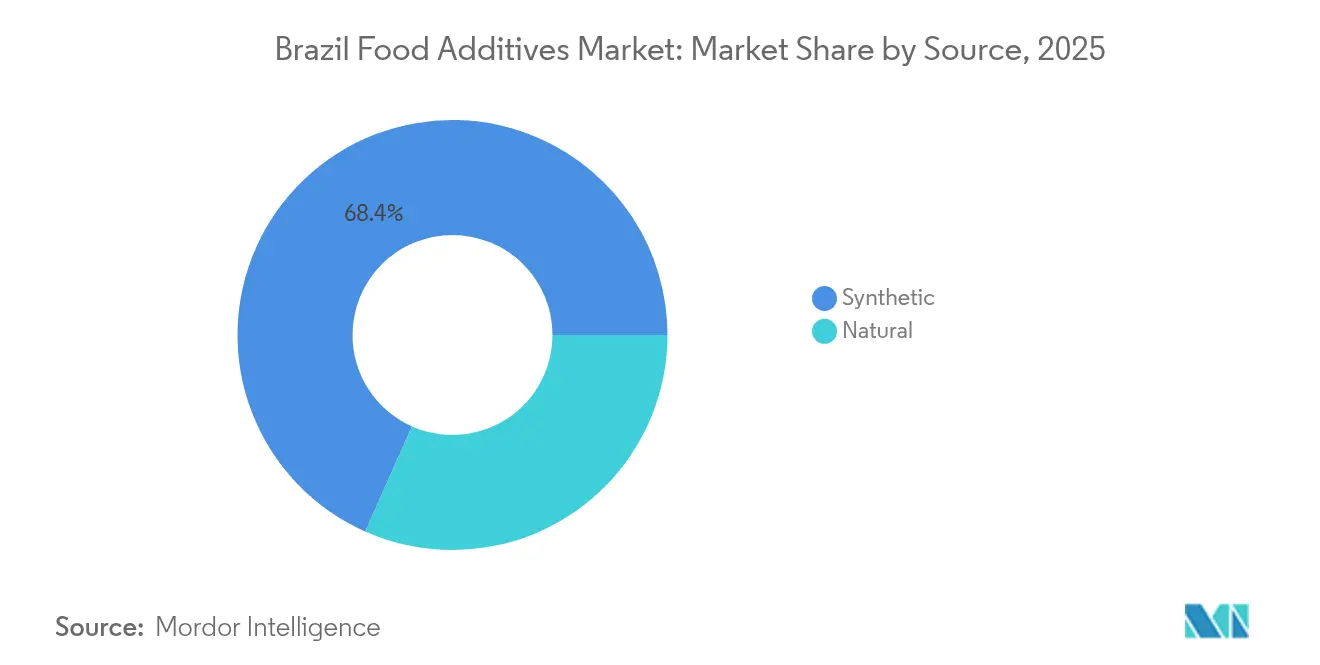
- By source, synthetic inputs captured 68.35% volume in 2025, whereas natural ingredients are projected to rise at a 4.99% CAGR to 2031.
- By application, bakery and confectionery contributed 31.02% of the Brazil food additive market size in 2025, while dairy and desserts will advance at the leading 4.82% CAGR during the forecast window.
Note: Market size and forecast figures in this report are generated using Mordor Intelligence’s proprietary estimation framework, updated with the latest available data and insights as of 2026.
Brazil Food Additives Market Trends and Insights
Drivers Impact Analysis*
| Driver | (~)% Impact on CAGR Forecast | Geographic Relevance | Impact Timeline |
|---|---|---|---|
| Growing preference for natural and organic additives | +0.8% | National, with concentration in São Paulo, Rio de Janeiro, and Southern states | Medium term (2-4 years) |
| Expansion of clean-label and plant-based additive options | +0.7% | National, driven by urban centers and export-oriented processors | Medium term (2-4 years) |
| Increased consumption of convenience and processed foods | +0.9% | National, particularly metropolitan regions (São Paulo, Rio, Belo Horizonte) | Short term (≤ 2 years) |
| Shifting consumer taste profiles and rising demand for diverse flavors | +0.5% | National, with regional variations (Northeast spices, South European influences) | Long term (≥ 4 years) |
| Cultural influences impacting additive preferences | +0.4% | National, emphasis on Amazon-origin ingredients and regional cuisines | Long term (≥ 4 years) |
| Emerging applications in bakery, confectionery, and dairy products | +0.6% | National, led by São Paulo industrial corridor and Minas Gerais dairy belt | Medium term (2-4 years) |
| Source: Mordor Intelligence | |||
Growing demand for anti-microbial additive
Brazilian consumers are becoming increasingly attentive to ingredient lists, although their perception of what constitutes "natural" often diverges from regulatory definitions. According to an analysis by the National Institute of Industrial Property (INPI), urucum (annatto) is linked to 864 global patent families, ranking it as the fifth-most-researched Amazonian input after cacao, manioc, guaraná, and açaí. This is primarily due to the presence of bixin and norbixin carotenoids in urucum, which provide orange-to-red hues without relying on synthetic azo dyes. Similarly, anthocyanins derived from jaboticaba (Plinia cauliflora) are emerging as a promising natural colorant alternative [1]Source: Brazilian Journal of Food Technology, “Open-access Emerging ingredients for clean label products and food safety,” scielo.br. Peer-reviewed research has demonstrated that these anthocyanins exhibit stability across a wide range of pH levels, addressing challenges that previously required synthetic stabilizers. In 2023, açaí production in Pará state reached 1.6 million tonnes, with lyophilized (freeze-dried) powder exports priced at USD 40 per kilogram and distributed to over 40 countries. However, domestic additive processors currently capture only 15-20% of the value chain, as freeze-drying capacity remains predominantly controlled by vertically integrated exporters.
Expansion of clean-label and plant-based additive options
Plant-based protein innovation is significantly influencing the demand for emulsifiers and stabilizers, driven by the adoption of alternatives such as ProVerde bean protein concentrate and aquafaba (chickpea brine), which are replacing egg albumin in bakery applications. However, the scalability of these innovations faces challenges due to Brazil's limited pulse-processing infrastructure. The country produces only 3,500 tonnes of chickpeas annually, which is insufficient to meet domestic demand, forcing manufacturers to rely on imports from Argentina and Canada. These imports come with a cost premium of 30-40%, adding to the overall production expenses. Additionally, Uvaia fruit (Eugenia pyriformis) is gaining traction in the fermented beverages market as a natural acidulant and flavor enhancer. Research has demonstrated its antimicrobial properties, which help reduce the reliance on synthetic preservatives such as sodium benzoate (INS 211). Similarly, Baru nut (Dipteryx alata) proteins, offering a protein content of 23-30%, 86% digestibility, and a balanced profile of essential amino acids, are being positioned as a viable soy alternative in meat analogs. Despite their potential, market projections indicate that Baru nut proteins generated revenue of only USD 5.1 million in 2022, with expectations to grow to USD 47 million by 2032. This suggests that the segment will remain niche and is unlikely to disrupt mainstream emulsifier demand before 2028. Furthermore, BASF and INOCAS entered into an agreement in December 2024 to develop macaúba oil, initially targeting personal-care applications. However, there is potential for this oil to expand into food-grade emulsifiers if pilot-scale production in 2025 and regular offtake by 2027 prove its cost-competitiveness against palm oil.
Increased consumption of convenience and processed foods
Brazilian retail food sales grew, with household consumption expanding by 3.1% in 2023. However, convenience food penetration remains below 60% in rural areas, where fresh-market purchases dominate. This creates a bifurcated demand profile, favoring preservatives such as sorbates and benzoates in urban areas, while minimal processing is preferred in agricultural regions. The Brazilian food-processing sector generated USD 233 billion in revenue in 2024, reflecting a 9.9% growth. Convenience categories, including ready meals, snacks, and bakery products, accounted for 40% of the incremental volume, indicating a structural shift driven by urbanization. National urbanization rates reached 87%, though regional disparities persist, with the Northeast at 75% and the Southeast at 93%. ADM is constructing a premix factory in Paraná state, scheduled for completion in August 2025. This facility will deliver a 40% capacity expansion and require an investment of tens of millions of Brazilian reais. The project reflects a strategic move to capture market share in vitamin-mineral premixes, as processors increasingly seek one-stop formulations over standalone additive sales.
Shifting consumer taste profiles and rising demand for diverse flavors
Regional flavor preferences in Brazil create diverse micro-segments that multinational companies find challenging to address in a cost-effective manner. For instance, consumers in the Northeast region exhibit a strong preference for spicy and savory flavor profiles, such as malagueta pepper and dendê oil, while Southern states favor European-influenced sweet-dairy flavors like dulce de leche and stroopwafel. However, flavor houses often lack access to granular sales data below the state level, which forces them to rely on trial-and-error approaches in product development. This inefficiency leads to significant resource wastage, with 20-30% of research and development (R&D) budgets being consumed without optimal outcomes. According to the National Institute of Industrial Property (INPI) patent mapping, guaraná, with 1,254 patent families, and açaí, with 1,019 patent families, dominate research on Amazon-origin flavors. Despite this focus, commercialization efforts are hindered by lengthy benefit-sharing negotiations mandated under Law 13.123/2015, which require 18-24 months to complete and impose royalty structures that increase ingredient costs by 5-8%. Givaudan, a leading global flavor and fragrance company, reported Latin America sales of CHF 1.6 billion in 2024, representing 22.6% of its global revenue. Brazil alone contributed an estimated 60-65% of the regional volume. However, the company's 2024 Annual Report highlights challenges such as margin compression driven by "intense price competition and customer consolidation," which have eroded the premium pricing traditionally associated with proprietary flavor systems.
Restraints Impact Analysis*
| Restraint | (~)% Impact on CAGR Forecast | Geographic Relevance | Impact Timeline |
|---|---|---|---|
| Stringent and complex regulatory compliance | -0.5% | National, affecting all manufacturers and importers | Short term (≤ 2 years) |
| Consumer preference for clean-label and additive-free convenience foods | -0.4% | National, concentrated in urban middle-income segments | Medium term (2-4 years) |
| Insufficient consumer awareness regarding the benefits of additives | -0.3% | National, particularly rural and low-income populations | Long term (≥ 4 years) |
| Increased taxation on sugar-based packaged products | -0.6% | National, with highest impact on beverage and confectionery sectors | Short term (≤ 2 years) |
| Source: Mordor Intelligence | |||
Stringent and ocmplex regulatory compliance
Brazilian Health Regulatory Agency (ANVISA) introduced four critical resolutions aimed at enhancing food safety and transparency: RDC 839/2023, which establishes a general food framework; RDC 843/2024, focusing on food and packaging standards; IN 281/2024, outlining procedures for additive authorization; and IN 344/2025, which mandates updates to labeling requirements [2]Source: National Health Surveillance Agency “Anvisa publishes second version of guide for determining food expiration dates,” gov.br. These regulations compel manufacturers to revisit and update technical dossiers, reformulate products, and revise front-of-package labeling (FOPL) to align with nutrient thresholds that trigger black magnifying-glass warnings for excessive levels of sodium, sugar, or saturated fat. The associated compliance costs vary significantly, ranging from USD 50,000 for reformulating a single product to over USD 500,000 for updating an entire product portfolio. These financial demands are particularly challenging for small and medium enterprises (SMEs), which often lack the resources and in-house regulatory expertise to navigate these changes effectively. Brazil's food-processing industry comprises approximately 37,000 establishments, with 92% classified as SMEs. However, only 15% of these SMEs have dedicated quality-assurance teams capable of addressing ANVISA's evolving positive lists and regulatory requirements. Despite these efforts, compliance with FOPL requirements was recorded at only 12-15% one year after implementation, suggesting either gaps in enforcement or widespread industry non-compliance. This low compliance rate raises concerns about potential corrective actions and supply-chain disruptions, especially if ANVISA accelerates its audit processes in 2026.
Consumer preference for clean-label and additive-free convenience foods
Brazilian consumers exhibit a contradictory demand pattern. Retail surveys indicate that 68% of consumers express a preference for products labeled as "natural" or "additive-free." However, sales of convenience foods grew by 7.2% in 2023, driven by the popularity of ready meals and snacks. These products often depend on preservatives, such as sorbates and benzoates, and emulsifiers, including mono- and diglycerides and lecithin, to achieve a shelf life of 90 to 180 days. This "clean-label paradox" is particularly evident among urban middle-income households, with monthly incomes ranging from BRL 4,000 to BRL 10,000. In these segments, time constraints drive the demand for convenience-oriented products, while growing health awareness leads to increased scrutiny of ingredients. This duality forces manufacturers to invest in costly reformulations, replacing synthetic additives with natural alternatives, which often come at a cost premium of 30% to 50%. The introduction of Front-of-Pack Labeling (FOPL) regulations under RDC 839/2023 mandates the use of black magnifying-glass warnings on products high in sodium, sugar, or saturated fat. However, consumer advocacy groups, such as the Brazilian Institute of Consumer Defense (IDEC), have criticized these standards as being less stringent compared to the octagonal warnings implemented in Chile and Mexico. Their concerns focus on the less restrictive nutrient thresholds and the lack of marketing restrictions for products targeted at children.
*Our forecasts treat driver/restraint impacts as directional, not additive. The impact forecasts reflect baseline growth, mix effects, and variable interactions.
Segment Analysis
By Product Type: Bulk Sweeteners Anchor Revenue, Colorants Lead Innovation
Bulk sweeteners held a significant 55.62% share of the market in 2025, largely driven by Brazil's position as the world's leading sugar exporter. Brazil supplies approximately 50% of globally traded sugar, reinforcing its dominance in the market. However, this segment is facing notable challenges due to regulatory measures such as the selective tax imposed on sugar-sweetened beverages and the zero-rating of refined sugar in the national food basket. These policies create uneven incentives within the market, leading to compressed profit margins for suppliers of high-intensity sweeteners .
Food colorants are anticipated to experience the fastest growth, with a compound annual growth rate (CAGR) of 5.48% projected through 2031. This growth is primarily fueled by the increasing adoption of natural pigments. For example, urucum (commonly known as annatto) accounts for 864 patent families registered with the National Institute of Industrial Property (INPI) in Brazil. Additionally, jaboticaba anthocyanins demonstrate superior pH stability compared to synthetic alternatives, while cacao polyphenol extraction, which is associated with 20,745 patent families, offers dual functionality as both a natural colorant and an antioxidant. These advancements highlight the growing preference for natural and multifunctional ingredients in the food industry.



By Form: Dry Dominance Faces Liquid Precision Gains
In 2025, dry-form additives represented 67.75% of the market share, highlighting Brazil's strong preference for powdered seasonings, premixes, and bulk sweeteners. These products are well-suited to the country's ambient-temperature distribution networks, which span 5,570 municipalities, many of which lack cold-chain infrastructure necessary for perishable goods. However, this segment is under pressure due to fluctuating commodity prices and competition from low-cost imports, particularly from China. Despite their dominance, dry-form additives face challenges in maintaining profitability under these conditions, as manufacturers must navigate these pricing dynamics while meeting consumer demand.
Liquid formats, on the other hand, are expected to grow at a compound annual growth rate (CAGR) of 5.06% through 2031. This growth is driven by beverage and dairy processors increasingly adopting in-line dosing systems, which are automated systems designed to add precise amounts of liquid ingredients directly into production lines. These systems offer several advantages, including reduced contamination risks, improved batch consistency, and the ability to implement just-in-time inventory management, which can lower working capital requirements by 15-20%. Archer Daniels Midland (ADM) is responding to this trend with its new premix factory in Paraná, scheduled for completion in August 2025. This facility will expand production capacity by 40% and focus on liquid vitamin-mineral blends for dairy fortification. This move reflects a strategic shift toward higher-margin liquid formats, which typically command a 25-30% premium over dry-form equivalents, offering manufacturers an opportunity to enhance profitability while meeting evolving market demands.
By Source: Synthetic Efficiency Meets Natural Premiums
Synthetic-source additives accounted for 68.35% of the 2025 volume, primarily due to their cost advantages, regulatory familiarity, and supply chain reliability. These additives are 30-50% cheaper than their natural counterparts, making them a more economical choice for manufacturers. Regulatory frameworks, such as the Agência Nacional de Vigilância Sanitária (ANVISA) positive lists, tend to favor established synthetic options, further supporting their widespread use. Additionally, synthetic additives benefit from a more reliable supply chain, with suppliers from regions like China, India, and the European Union offering lead times of 30-60 days, significantly shorter than the 90-180 days required for Amazon-origin natural extracts. These factors collectively make synthetic-source additives a preferred option for cost-sensitive and time-critical applications.
In contrast, natural-source ingredients are projected to grow at a compound annual growth rate (CAGR) of 4.99% through 2031, driven by increasing demand for clean-label products, innovation in Amazonian inputs, and consumer preferences. Patent activity around Amazonian ingredients is robust, with 43,399 global patent families covering 59 ingredients, reflecting growing interest in these natural resources. Consumers are also willing to pay a premium of 15-25% for products labeled as "natural," despite their safety profiles being equivalent to synthetic alternatives. A notable example of this trend is CP Kelco's USD 60 million investment in citrus fiber production. The company's NUTRAVA and KELCOSENS branded fibers, derived from upcycled citrus peels, command a 40-50% premium over synthetic cellulose gum. However, these natural fibers primarily cater to niche clean-label segments, such as organic bakery and premium dairy products, rather than mass-market applications where cost constraints continue to favor synthetic options.
By Application: Bakery Anchors Volume, Dairy Leads Growth
Bakery and confectionery applications are expected to dominate the market with a 31.02% share in 2025, largely influenced by Brazil's high per-capita annual bread consumption of 34 kilograms, the highest in Latin America. Despite this strong demand, the adoption of enzymes in this segment remains below 40%. This is primarily due to the dominance of artisanal bakeries, which make up 60% of retail outlets. These smaller bakeries often lack the technical knowledge and resources to effectively utilize enzymes such as amylases and xylanases, which are essential for improving dough quality and shelf life. Consequently, the market is divided into two distinct segments: industrial bread manufacturers, who have nearly universal adoption of enzymes, and small and medium-sized enterprise (SME) bakeries, which continue to depend on traditional dough conditioners like ascorbic acid and azodicarbonamide to meet their production needs.
The dairy and desserts segment is projected to experience the fastest growth, with a compound annual growth rate (CAGR) of 4.82% through 2031. This growth is driven by the increasing popularity of probiotic-fortified yogurts, which contain beneficial bacterial strains such as Lactobacillus and Bifidobacterium. These products require stabilizers to ensure the viability of probiotics over a 90-day shelf life. Additionally, the rising demand for plant-based dairy alternatives, including oat, almond, and coconut-based products, is creating a need for advanced emulsifiers and hydrocolloids. These ingredients play a critical role in replicating the creamy texture and mouthfeel of traditional dairy products while preventing phase separation, ensuring a consistent and appealing product for consumers.
Geography Analysis
Brazil's demand for food additives is concentrated in the Southeast industrial corridor. São Paulo state accounts for 45% of the national food-processing capacity, hosting multinational R&D centers (Nestlé, Unilever, Mondelēz) and regional specialists (Duas Rodas, Vogler). This clustering reduces logistics costs by 15-20% and accelerates innovation cycles due to proximity to ingredient suppliers and contract manufacturers. Minas Gerais plays a key role in dairy applications, producing 28% of the country's milk and hosting DSM-Firmenich's Sete Lagoas factory, which is set to open in October 2024. This facility, with an annual capacity of 100,000 tonnes, will focus on enzyme and vitamin premixes for yogurt and cheese fortification.
The South region, comprising Paraná, Santa Catarina, and Rio Grande do Sul, contributes 22% of Brazil's food-processing output. This is driven by meat (poultry, pork) and grain-based industries, which utilize preservatives (nitrites, sorbates) and emulsifiers. ADM's premix factory in Paraná, scheduled for completion in August 2025, will expand capacity by 40% to meet regional demand.
The North region, led by Pará's açaí production (1.6 million tonnes in 2023), supplies raw materials for natural colorants and flavors. However, it captures minimal value addition as freeze-drying capacity is concentrated in Southeast export hubs. This forces Pará processors to sell raw pulp at USD 2-3 per kilogram, while lyophilized powder commands USD 40 per kilogram in international markets.
Regulatory Landscape
Food additives and technological aids in Brazil are regulated federally by the Brazilian Health Regulatory Agency (ANVISA) under a positive list approach, where substances are only permitted when explicitly authorized for defined food categories, functions, and maximum limits. ANVISA consolidates the authorized lists through Instruction Normative (IN) 211/2023, and subsequent amendments require companies to track list and condition changes across portfolios.
Recent regulatory updates reinforce the compliance load on both domestic manufacturers and importers. IN 407, dated November 21, 2025, amended IN 211/2023 by updating the permitted additives and technological aids lists. Related ANVISA frameworks referenced in the report (RDC 843/2024 and IN 281/2024) further affect how additives are regularized for industrial use and how the responsible legal entity is defined within the National Sanitary Surveillance System (SNVS), shaping importer-of-record structures and documentation readiness.
Competitive Landscape
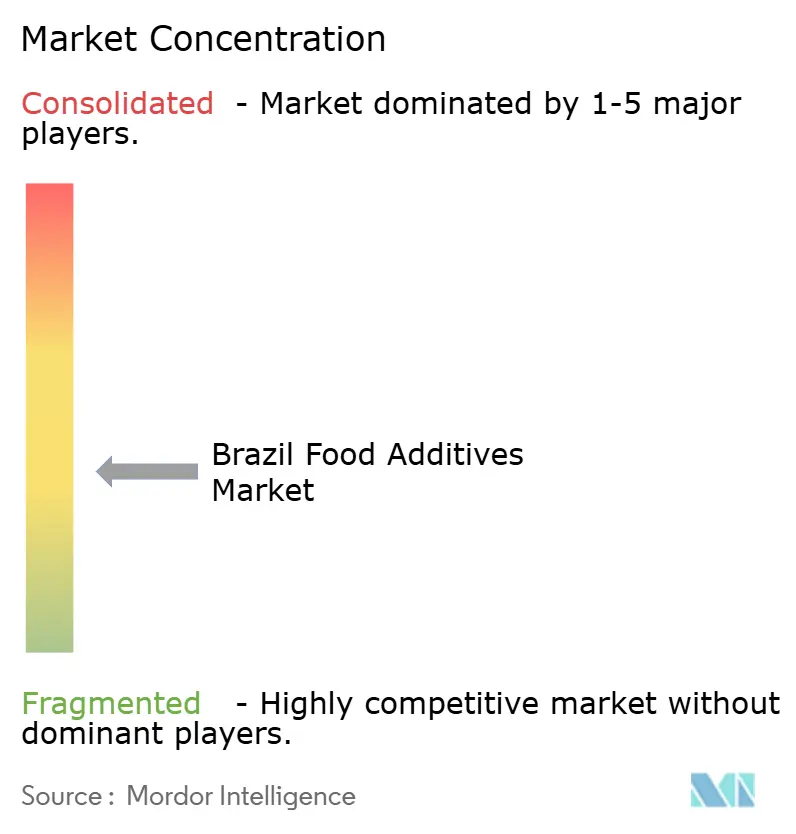
The Brazil food additive market demonstrates moderate fragmentation, showcasing a competitive environment. Multinational corporations such as BASF SE, Cargill Incorporated, DuPont de Nemours Inc., Kerry Group, and Archer Daniels Midland Company (ADM) utilize their extensive global research and development pipelines and regulatory expertise to maintain dominance in high-margin segments. These segments include enzymes, proprietary flavor systems, and specialty emulsifiers. On the other hand, regional companies like Biorigin, Duas Rodas, Vogler, and Gelnex leverage their proximity to raw material sources, faster lead times, and the ability to offer hyperlocal flavor customization. These advantages enable them to capture market share in areas where multinational corporations often face cost-related challenges in replicating such offerings effectively.
Patent activity within the market underscores strategic positioning by key players. According to an analysis by the National Institute of Industrial Property (INPI), companies such as Nestlé S.A. (holding 667 patent families), Mars Incorporated, Cargill Incorporated, Kraft Foods, and Fuji Oil Co., Ltd. lead research efforts into ingredients derived from the Amazon region. These ingredients include cacao, açaí, guaraná, and urucum. However, Brazilian firms derive limited value from these innovations, as approximately 70% of domestic raw materials are exported in unprocessed forms rather than as high-margin extracts. This structural inefficiency allows foreign patent holders to capture the majority of innovation-related revenues, highlighting a significant challenge for the local industry.
Despite regulatory challenges, capacity expansions indicate growing confidence in the market's potential. CP Kelco has announced a USD 60 million investment in a citrus fiber facility in Matão, scheduled for completion in May 2024. Similarly, ADM is constructing a premix factory in Paraná, expected to be operational by August 2025, while DSM-Firmenich plans to open an enzyme production plant in Sete Lagoas by October 2024. Collectively, these projects will add over 150,000 tonnes of annual production capacity, focusing on clean-label and fortification segments, which are forecasted to grow at a compound annual growth rate (CAGR) of 5-6%. Additionally, opportunities in fermentation-derived additives are emerging. McKinsey & Company projects that precision fermentation could generate USD 100-150 billion globally by 2050. However, Brazil's bioreactor capacity remains underdeveloped, accounting for less than 5% of its installed food-processing infrastructure. This limitation has allowed startups in the United States and Europe to gain a first-mover advantage in developing innovative products such as animal-free dairy proteins and next-generation sweeteners.
Brazil Food Additives Industry Leaders
BASF SE
Cargill, Incorporated
DuPont de Nemours, Inc.
Ingredion Incorporated
Kerry Group plc
- *Disclaimer: Major Players sorted in no particular order

Market Opportunities and Future Outlook
Reformulation and compliance-driven portfolio work continues to create opportunities for suppliers that can reduce customers time-to-compliance under ANVISA's positive list regime, particularly where permitted uses, limits, or technological functions are updated. ANVISA's Public Consultation 1.394 (April 2026) to propose updates to technological functions, maximum limits, and conditions of use for food additives and technological aids creates a visible pipeline for new or adjusted use cases. This supports demand for dossier support services, application labs, and differentiated additive systems aligned with revised conditions of use.
On the demand side, processed food manufacturing expansion is a direct pull-through for additives, premixes, and process aids, especially where front-of-pack labeling pressure is driving recipe changes around sodium, sugar, and saturated fat thresholds. The Brazilian food processing industry has highlighted R$ 120 billion in investments for 2023-2026 (with allocations to plant expansion, modernization, and R&D and innovation). This capex cycle supports supplier opportunities tied to modernization themes such as precision dosing, premix standardization, and localization of higher value-added ingredients to reduce reliance on imported specialty inputs with longer lead times.
Recent Industry Developments
- May 2026: MBRF announced a R$ 500 million investment to expand Gelprime (50% owned), with a plan to double capacity to 30,000 tonnes per year for gelatin and collagen products by 2030. The expansion increases domestic supply of functional animal-derived ingredients used across food and beverage formulations, supporting broader availability for texture and protein-related applications in Brazil.
- June 2025: Lesaffre completed the acquisition of a 70% stake in Biorigin, a business unit of Zilor, forming a joint venture to advance yeast-based solutions for global food and feed markets. The deal strengthens local production and application capabilities for yeast derivatives and fermentation-based ingredients, expanding options for clean-label flavor, nutrition, and processing solutions.
- December 2024: BASF and INOCAS signed a macauba oil supply agreement, initially targeting personal-care applications with an identified pathway toward food-grade emulsifier use if pilot-scale output and offtake validate cost competitiveness. The agreement points to a route to diversify lipid-based feedstocks in Brazil, aligning sustainability positioning with potential downstream formulation use in emulsifiers.


Research Methodology Framework and Report Scope
Market Definition and Coverage
For this study, the Brazil food additives market is defined as the value of additives sold for use in food and beverage manufacturing, where the additives are used to preserve, sweeten, color, flavor, stabilize, or improve texture.
Scope exclusions: This sizing excludes packaging materials, processing equipment, and food ingredients that are not used as additives in formulations.
Segmentation Overview
- By Product Type
- Preservatives
- Bulk Sweeteners
- Sugar Substitutes
- Emulsifiers
- Anti-Caking Agents
- Enzymes
- Hydrocolloids
- Food Flavors and Enhancers
- Food Colorants
- Acidulants
- By Form
- Dry
- Liquid
- By Source
- Natural
- Synthetic
- By Application
- Bakery and Confectionery
- Dairy and Desserts
- Beverages
- Meat and Meat Products
- Soups, Sauces, and Dressings
- Other Applications
Data Sources, Market Sizing, and Validation
Desk Research
Desk research was used to set market boundaries, follow regulatory direction, and collect demand signals that can be tracked over time. We referred to public sources such as ANVISA publications and consultations, IBGE industrial and consumer statistics, Comex Stat trade data for key additive categories, and trade bodies such as ABIA for processed food context.
To keep assumptions grounded, we also reviewed company filings and investor presentations for Brazil exposure, and we used reputable press and association websites to track near-term changes like labeling moves and reformulation activity. Where gaps remained on company presence, patent activity, or shipment direction, we cross-checked using paid subscriptions covering company financials and intelligence, news and financials, patent databases, and import and export shipment-level data. These examples are illustrative, and many other sources were also used for data collection, validation, and research clarification.
Primary Interviews and Surveys
Primary work was used to test scope, confirm use-rate and pricing logic, and sanity-check the split across key additive functions and food applications. We spoke with a mix of additive suppliers, distributors, and food and beverage manufacturers across Brazil, then followed up on mismatches between desk signals and what was reflected in current contracting and formulation practices.
Distribution of primary research fieldwork respondents
| Company type | Respondent position |
|---|---|
| Top tier: 30% | CXOs: 15% |
| Mid tier: 49% | Functional/Unit leaders: 39% |
| Smaller Players: 21% | Managers: 46% |
Market-Sizing & Forecasting
Sizing was built using a top-down demand pool reconstruction, where processed food and beverage output patterns, trade movement for relevant categories, and formulation intensity by application are converted into additive value, then checked against what market participants describe as typical buying behavior. To keep the totals realistic, we also used selective bottom-up approximations, including sampled price-per-kilogram ranges by additive function, distributor channel checks, and supplier revenue exposure to Brazil, which were used to tune the model.
Key inputs that shaped the model included packaged food and beverage production trends, reformulation pressure tied to labeling and sugar reduction, the mix shift between natural and synthetic solutions, observed price progression by additive family, and application demand signals in bakery, dairy, beverages, and meat processing. For forecasting, scenario analysis was used so base-case growth can be adjusted when changes in regulation timing, consumer preference for clean labels, or macro conditions shift faster or slower than expected. Where bottom-up checks could not be completed for smaller categories, gaps were handled using conservative adoption and pricing bands validated through interviews before finalizing totals.
Data Validation & Update Cycle
Validation was done by triangulating model outputs against independent signals, such as processed food output movement, trade direction, and pricing direction discussed by buyers and sellers. Outliers were flagged, reviewed by another analyst, and then re-tested through follow-up calls when the variance looked too wide to be explained by mix changes.
The report is refreshed on an annual cycle, with interim updates when material events occur, such as major regulatory changes or sudden shifts in demand for specific additive functions. Before delivery, the full dataset and narrative are reviewed again so clients receive the latest view aligned to the newest available indicators.
Mordor Intelligence's Brazil Food Additives Market Market Size Compared Against Other Published Estimates
Published numbers for Brazil food additives often do not match because the scope, base year, and pricing assumptions vary across studies, even when the market name appears similar. Differences also show up when one estimate follows manufacturer selling prices while another uses broader food ingredient definitions that pull in adjacent items.
The table points to a wide spread that usually comes from what is counted as an additive versus a general ingredient, plus how each publisher treats the base year and inflation timing in local currency before converting to USD. Under Mordor Intelligence's model, the value is built around defined additive functions used in food and beverage manufacturing, and it is cross-checked by application usage patterns so non-additive ingredients are not silently included.
Benchmark comparison
| Source | Market Size | Gaps in Research Methodology |
|---|---|---|
| Mordor Intelligence | USD 5.97 B (2025) | |
| Global Consultancy A | USD 3.78 B (2024) | Uses an earlier base year and appears to rely more on high-level category aggregation, which can undercount value when additive intensity rises in reformulated products and when local price timing is not updated. |
| Industry Bulletin B | USD 6.60 B (2025) | Likely includes a wider food-ingredients basket alongside additives, and it may apply blended average pricing without separating premium functions such as hydrocolloids and specialty enzymes from lower-value additives. |
Reading the three numbers together, the biggest practical driver is definition discipline, followed by base-year timing and how pricing is carried into USD. By keeping assumptions traceable to application demand signals and by checking totals against supplier and channel feedback, the final estimate stays easier to reproduce and update.


Key Questions Answered in the Report
What is the current value of the Brazil food additive market?
The Brazil food additive market size is valued at USD 6.21 billion in 2026.
How fast is demand for natural colorants growing?
Natural colorants are forecast to expand at a 5.48% CAGR through 2031, the fastest among all product categories.
Which form segment is expanding quickest?
Liquid additives will rise at a 5.06% CAGR as beverage and dairy lines adopt in-line dosing systems.
Why are compliance costs rising for small manufacturers?
Four new ANVISA regulations issued since 2023 require dossier updates, reformulation and new labels, costing SMEs up to USD 500,000 for broad portfolios.
Page last updated on:


 Your data is secure and never sold or shared.


