
Crypto Asset Management Market Size and Share
Market Overview
| Study Period | 2020 - 2031 |
|---|---|
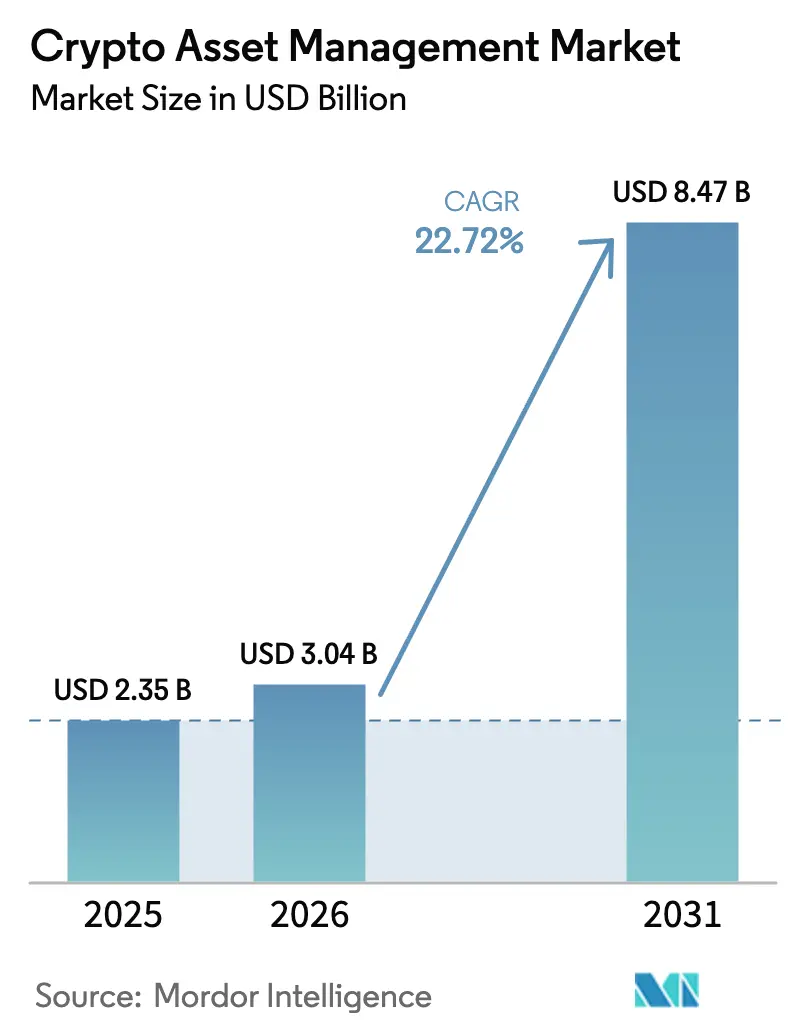
| Market Size (2026) | USD 3.04 Billion |
| Market Size (2031) | USD 8.47 Billion |
| Growth Rate (2026 - 2031) | 22.72 % |
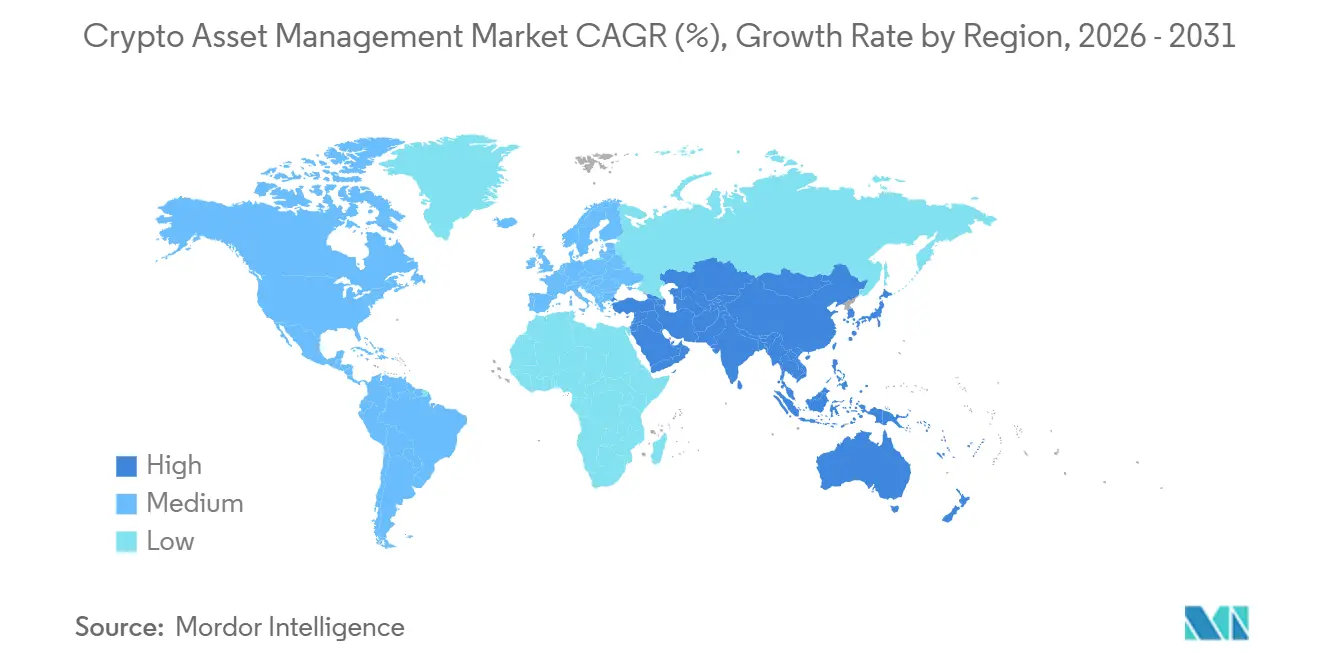
| Fastest Growing Market | Asia-Pacific |
| Largest Market | North America |
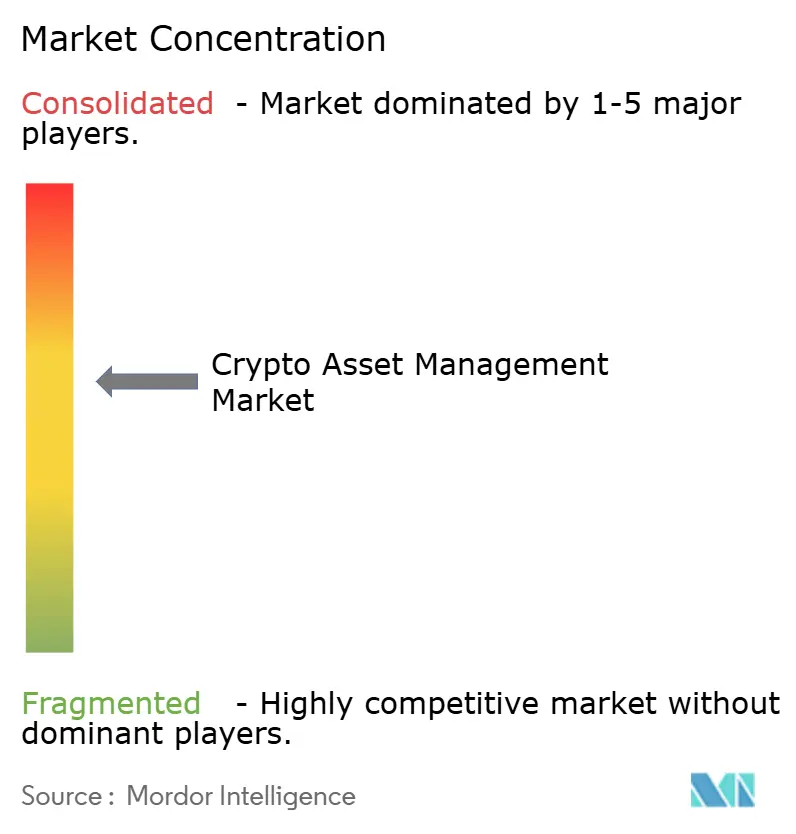
| Market Concentration | Medium |
Major Players *Disclaimer: Major Players sorted in no particular order Image © Mordor Intelligence. Reuse requires attribution under CC BY 4.0. | |
Crypto Asset Management Market Analysis by Mordor Intelligence
The Crypto Asset Management Market size is projected to be USD 2.35 billion in 2025, USD 3.04 billion in 2026, and reach USD 8.47 billion by 2031, growing at a CAGR of 22.72% from 2026 to 2031.
The growth trajectory reflects structural changes as pension funds, corporate treasuries, and family offices move from small pilot positions to permanent portfolio allocations. Institutional inflows now set daily price discovery, evidenced by a USD 40 billion first-year asset haul at BlackRock’s iShares Bitcoin Trust. Custody security, tokenized real-world assets, and regulatory clarity in major economies are reinforcing confidence, while service-layer expertise has emerged as the main differentiator among suppliers. The crypto asset management market is also benefiting from cloud-native architectures that scale on demand, hybrid deployments that meet sovereignty requirements, and DeFi-CeFi convergence that unlocks yield strategies once considered too complex for institutions.
Key Report Takeaways
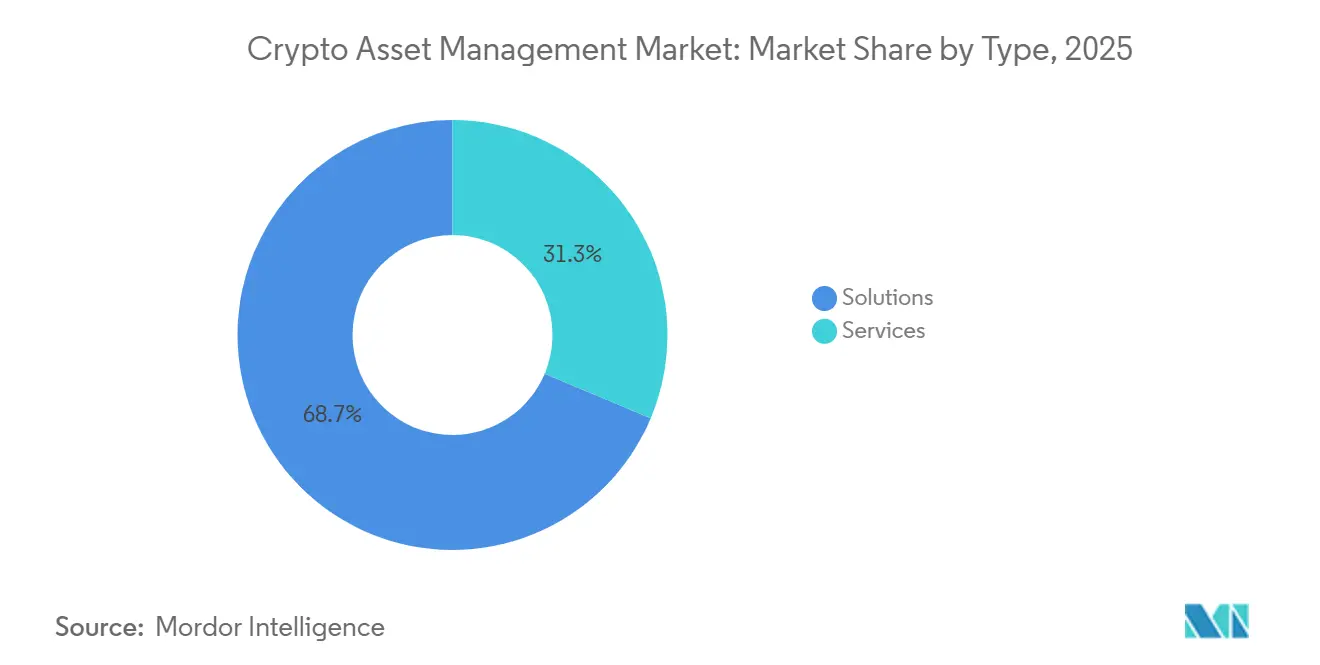
- By type, solutions controlled 68.67% of revenue share in 2025, while services are forecast to expand at a 24.22% CAGR through 2031.
- By deployment mode, cloud models led with 82.04% share in 2025, yet hybrid architectures are projected to grow at 23.83% CAGR through 2031.
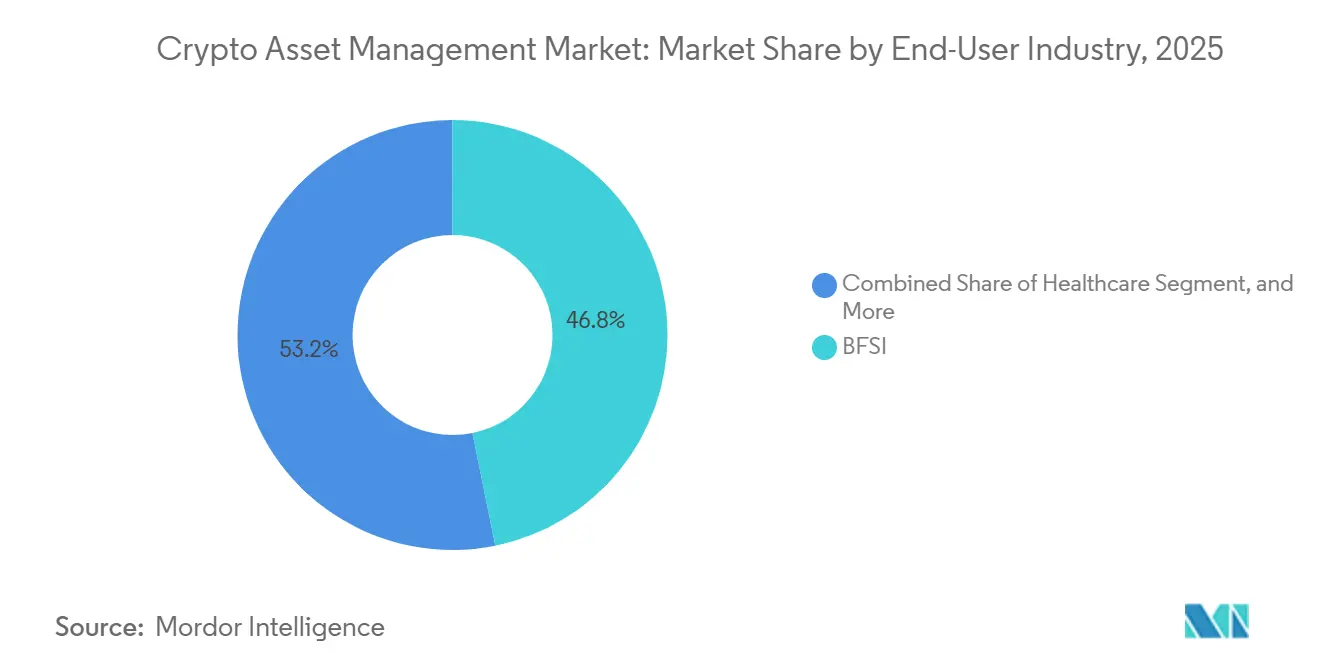
- By end-user industry, BFSI held 46.81% share in 2025, whereas healthcare is anticipated to rise at a 24.20% CAGR through 2031.
- By user type, institutional investors controlled 38.37% share in 2025, and corporate treasuries are set to climb at a 23.91% CAGR through 2031.
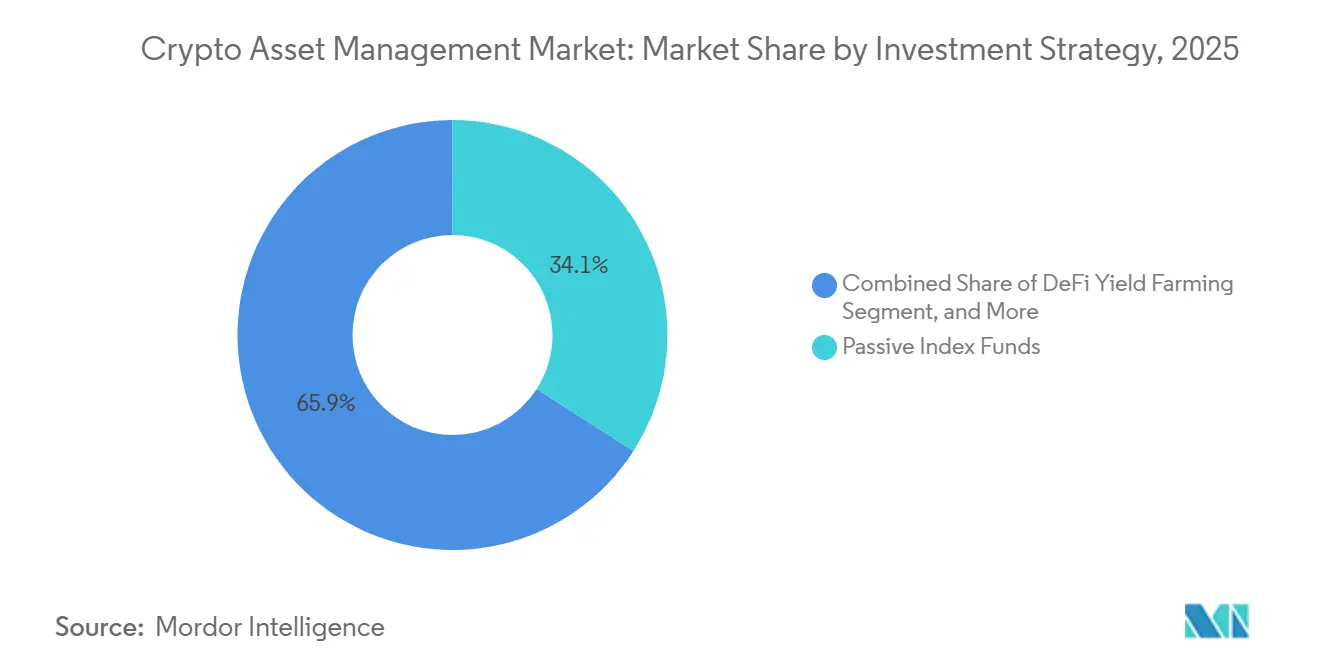
- By investment strategy, passive index funds held 34.06% share in 2025, but DeFi yield farming is slated to accelerate at 24.59% CAGR through 2031.
- By asset class, Bitcoin retained 42.51% share in 2025, while tokenized securities are projected to grow at a 24.86% CAGR through 2031.
- By geography, North America accounted for 39.34% share in 2025, and Asia Pacific is forecast to expand at a 24.79% CAGR through 2031.
Note: Market size and forecast figures in this report are generated using Mordor Intelligence’s proprietary estimation framework, updated with the latest available data and insights as of January 2026.
Market Trends and Insights
Drivers Impact Analysis of Crypto Asset Management Market*
| Driver | (~) % Impact on CAGR Forecast | Geographic Relevance | Impact Timeline |
|---|---|---|---|
| Institutional Adoption by Traditional Financial Firms | +5.20% | Global, with concentration in North America and Europe | Medium term (2-4 years) |
| Rising Focus on Custody Security and Insurance Solutions | +4.10% | Global, with early adoption in North America and Asia Pacific | Short term (≤ 2 years) |
| Regulatory Clarity in Major Economies | +4.80% | North America, Europe, Asia Pacific core markets | Medium term (2-4 years) |
| Integration of DeFi Protocols with CeFi Platforms | +3.70% | Global, with innovation hubs in North America and Asia Pacific | Long term (≥ 4 years) |
| Pension-Fund Allocation Experiments in OECD Countries | +2.90% | North America and Europe, spillover to Asia Pacific | Long term (≥ 4 years) |
| Emergence of Carbon-Neutral Crypto Funds | +2.10% | Europe and North America, expanding to Asia Pacific | Medium term (2-4 years) |
| Source: Mordor Intelligence | |||
Institutional Adoption by Traditional Financial Firms
Traditional financial institutions now position digital assets alongside equities and bonds. BlackRock captured USD 40 billion within 12 months of launching its iShares Bitcoin Trust, surpassing inflows to all earlier Bitcoin vehicles. Fidelity Digital Assets broadened its custody suite to include Ethereum staking in April 2025, enabling pension plans to earn protocol rewards without adding operational teams.[1]Fidelity Digital Assets, “Institutional Custody Platform Expansion,” fidelity.com JPMorgan’s Onyx processed more than USD 1 trillion in tokenized repo trades during 2024, proving that blockchain rails handle high-value settlement volumes.[2]JPMorgan, “Onyx Tokenized Repos Cross USD 1 Trillion,” jpmorgan.com The progress indicates that fiduciary-grade infrastructure is no longer a market bottleneck. As a result, the crypto asset management market increasingly competes head-to-head with traditional asset classes for long-term allocations.
Rising Focus on Custody Security and Insurance Solutions
Custody architecture has evolved from single-key cold storage to multiparty computation (MPC) and hardware security modules. Fireblocks secured over USD 4 trillion in transfers during 2024 without a single cryptographic breach. BitGo placed a USD 250 million insurance tower in partnership with Marsh in June 2024, addressing board-level concerns about balance-sheet protection.[3]Marsh, “USD 250 Million Crypto Custody Insurance Facility,” marsh.com Gemini launched proof-of-reserves attestations audited by Deloitte in September 2024, giving clients real-time visibility into segregated holdings.[4]Gemini Trust, “Proof-of-Reserves Attestations,” gemini.com These measures have moved custody security from a technical talking point to a mandatory compliance requirement, accelerating institutional inflows into the crypto asset management market.
Regulatory Clarity in Major Economies
The European Union’s Markets in Crypto-Assets Regulation (MiCA) became fully operational in December 2024, offering a single passport for licensed providers across 27 member states. Hong Kong issued 12 virtual-asset trading licenses in 2024, creating an Asian hub with rules mirroring securities markets. Japan’s April 2024 Payment Services Act update now obliges segregated custody and capital buffers equal to 50% of customer deposits. In the United States, the Securities and Exchange Commission approved 11 spot Bitcoin ETFs in January 2024, reversing a decade-long stance. Collectively these frameworks reduce jurisdictional uncertainty and enable multinational managers to standardize risk, compliance, and reporting processes in the crypto asset management market.
Integration of DeFi Protocols with CeFi Platforms
Centralized platforms have begun embedding permissionless protocols. Coinbase added Uniswap pools into its front end in August 2024, letting users swap tokens directly from exchange custody. Robinhood debuted a DeFi wallet in May 2024 that connects to Aave and Compound while retaining an app-based user experience. Lido’s liquid-staking derivative reached USD 35 billion in value locked during 2024, showing institutional scale when validator risk is pooled across large operator sets. The result is a modular finance stack where custody, execution, and settlement can be assembled much like cloud services, expanding the addressable universe of yield strategies inside the crypto asset management market.
Restraints Impact Analysis of Crypto Asset Management Market*
| Restraint | (~) % Impact on CAGR Forecast | Geographic Relevance | Impact Timeline |
|---|---|---|---|
| Lack of a Centralised Regulatory Framework | -3.40% | Global, with acute impact in jurisdictions lacking clear guidelines | Short term (≤ 2 years) |
| High Market Volatility and Liquidity Risks | -2.80% | Global, with heightened sensitivity in emerging markets | Short term (≤ 2 years) |
| Shortage of Institutional-Grade Insurance Capacity | -1.90% | Global, with constraints in Asia Pacific and Middle East | Medium term (2-4 years) |
| ESG Concerns over Energy Consumption | -1.60% | Europe and North America, with regulatory pressure intensifying | Medium term (2-4 years) |
| Source: Mordor Intelligence | |||
Lack of a Centralised Regulatory Framework
Fragmented rules inflate compliance cost by 30-40% for cross-border managers, according to PwC estimates. U.S. providers juggle state money-transmitter licenses alongside federal enforcement actions, while MiCA still lacks reciprocity with non-EU jurisdictions. Singapore and the United Arab Emirates attract firms seeking clearer guidelines, but global players still face duplicate legal entities, audits, and reporting requirements. The uncertainty hampers rapid scaling in the crypto asset management market and slows capital formation until equivalent standards emerge across major hubs.
High Market Volatility and Liquidity Risks
Bitcoin’s 30-day realized volatility averaged 55% in 2024 compared with 15% for the S&P 500. Large block orders can move crypto spot prices by up to 3% on fragmented venues, lifting transaction costs for asset managers. Under Basel III, banks must hold more capital against volatile assets, which reduces leverage and dampens allocations. Although derivatives provide hedges, Galaxy Digital notes that option depth still trails spot by a wide margin. Until liquidity broadens, volatility remains a hurdle for widespread balance-sheet adoption in the crypto asset management market.
*Our forecasts treat driver/restraint impacts as directional, not additive. The impact forecasts reflect baseline growth, mix effects, and variable interactions.
Crypto Asset Management Market Segment Analysis
By Type:
Services Gain as Platforms CommoditiseSolutions captured 68.67% of revenue in 2025, reflecting the historical dominance of custody, tokenization, and trading software that underpins the crypto asset management market. Services, however, are expected to grow at a 24.22% CAGR through 2031, faster than the overall crypto asset management market. Consulting engagements now address MiCA licensing, U.S. transfer-pricing rules, and DeFi smart-contract audits. Managed offerings appeal to family offices that want staking rewards without validator oversight.
Competitive parity in core custody features is pushing differentiation toward integration expertise. Fidelity Digital Assets unveiled a managed staking service in April 2025 that handles validator operations, tax paperwork, and slashing-risk coverage. Deloitte notes that institutions migrating from legacy systems often require 12-18 months to re-architect audit trails in line with Sarbanes-Oxley, giving service integrators room to capture higher-margin work. As a result, service revenue will likely form the next profit pool, changing how suppliers price offerings inside the crypto asset management market.


By Deployment Mode:
Hybrid Models Balance Sovereignty and ScaleCloud deployments commanded an 82.04% share in 2025 because asset managers value elastic compute and pay-as-you-grow pricing. Yet hybrid architectures are projected to expand at a 23.83% CAGR through 2031, outpacing overall crypto asset management market growth. Regulatory requirements under the EU’s Digital Operational Resilience Act (DORA) oblige financial firms to maintain on-premises failover plans. BitGo answered that need with a hybrid custody service in March 2025 that splits key storage on-premises while orchestrating transactions in the cloud, cutting latency by 40%.
Hybrid models also meet data sovereignty mandates in China and Russia that restrict cross-border transfers. For institutional clients, the approach combines regulatory assurance with the cloud’s analytical horsepower. Consequently, hybrid solutions will become a default option, reshaping vendor roadmaps and spending patterns in the crypto asset management market.
By End-User Industry:
Healthcare Emerges Beyond BFSI DominanceBFSI accounted for 46.81% of the crypto asset management market share in 2025, benefiting from early custody and trading adoption. Healthcare is forecast to grow at a 24.20% CAGR through 2031, extending the crypto asset management market size into new workflows such as cross-border claims settlement. Solve. Care’s pilot with Boehringer Ingelheim cut prior-authorization cycles from 72 hours to under 10 minutes. Stablecoin corridors also help clinicians settle international invoices in minutes, avoiding correspondent-bank charges.
Retail and ecommerce firms process crypto payments to sidestep interchange fees, while media companies tokenize music royalties for fractional investment. Visa cleared over USD 3 billion in stablecoin settlements in 2024, confirming enterprise use cases beyond finance. By 2031, healthcare, travel, and public-sector clients are expected to diversify revenue streams for providers, making vertical specialization a strategic priority in the crypto asset management market.

By User Type:
Corporate Treasuries Accelerate Beyond SpeculationInstitutional investors controlled a 38.37% share in 2025, yet corporate treasuries are on track to grow at a 23.91% CAGR through 2031, outstripping the proportional rise of the crypto asset management market. MicroStrategy held 214,400 Bitcoin worth about USD 15 billion by December 2024, proving that balance-sheet allocations can be strategic, not opportunistic. Newly formed Strategy replicated the convertible-debt playbook, raising USD 2 billion in 2024 to acquire Bitcoin.
High-net-worth investors and family offices increased crypto ownership from 45% in 2023 to 67% in 2024, per Bitwise. As custody tools simplify tax reporting and audit workflows, these cohorts shift from small positions to diversified strategies, including staking and yield farming. The trend indicates that corporate treasury allocations will dampen price swings by extending average holding periods, deepening use cases for the crypto asset management market.
By Investment Strategy:
DeFi Yield Farming Outpaces Passive ProductsPassive index funds controlled 34.06% of the market in 2025, largely due to Bitcoin and Ethereum ETFs that simplify exposure for registered investment advisers. DeFi yield farming, however, is projected to grow at 24.59% CAGR through 2031, reflecting the pursuit of alpha in low-beta rate environments. Lido’s liquid-staking tokens provide Ethereum rewards while preserving liquidity. Aave processed more than USD 50 billion in institutional loans in 2024, proving that on-chain credit now matches mid-cap bank books.
Quantitative hedge funds arbitrage spreads across centralized and decentralized venues, yet shrinking basis points push them toward automated strategies. Coinbase facilitated USD 1 trillion in institutional trading volume in 2024, adding depth to derivatives hedging. Going forward, capital will likely migrate from passive buy-and-hold into actively managed and DeFi-linked products, broadening yield ladders inside the crypto asset management market.
By Asset Class:
Tokenized Securities Redefine Real-World AssetsBitcoin retained a 42.51% share in 2025 because of unmatched liquidity. Tokenized securities should climb at a 24.86% CAGR through 2031, widening the crypto asset management market size. BlackRock’s USD Build fund reached USD 520 million in six months by offering 24/7 settlement and programmable compliance. Franklin Templeton’s on-chain money-market fund surpassed USD 400 million in 2024, indicating a mainstream appetite for real-world assets on blockchain rails.
Stablecoins serve as the system’s cash leg, with Circle’s USDC logging USD 10 trillion in on-chain volume in 2024. Ethereum remains the dominant smart-contract network, underpinning DeFi, NFTs, and tokenized debt. Altcoins offer specialized niches, including privacy, cross-chain bridges, and gaming utilities. The expanding asset universe allows allocators to build multi-factor portfolios, enhancing diversification within the crypto asset management market.
Geography Analysis
North America Crypto Asset Management Market
North America accounted for 39.34% of 2025 revenue because spot Bitcoin and Ethereum ETF approvals funnelled USD 30 billion in new capital. Canadian and U.S. pension funds joined early, while custodians such as Anchorage won federal trust charters. As the Commodity Futures Trading Commission refines digital-asset risk rules, United States capital pools are expected to deepen further, anchoring liquidity for the crypto asset management market.
APAC Crypto Asset Management Market
Asia Pacific is projected to grow at a 24.79% CAGR through 2031. Japan’s Payment Services Act, effective April 2024, imposes segregated custody and 50% capital buffers for exchanges. South Korea’s July 2024 Virtual Asset User Protection Act requires insurance coverage and independent audits. Hong Kong granted 12 platform licenses in 2024, permitting retail trading under market-surveillance conditions that match equities. Singapore remains a regional lighthouse by licensing 20-plus digital payment token providers under strict anti-money-laundering standards. These measures collectively underpin institutional and consumer trust, propelling the region’s role in the crypto asset management market.
EMEA and South America Crypto Asset Management Market
Europe benefits from MiCA’s passporting regime, which cuts compliance costs by 40% for firms operating across multiple member states. The Middle East, led by the United Arab Emirates and Saudi Arabia, pulled in more than USD 5 billion in venture capital in 2024, establishing Dubai and Riyadh as crypto hubs. African adoption clusters around Nigeria, Kenya, and South Africa, where stablecoins stabilize cross-border payments. South American demand concentrates in Brazil and Argentina as citizens hedge inflation through stablecoin rails. Combined, these emerging regions diversify growth opportunities for the crypto asset management market.

Regulatory Landscape
The regulatory environment for crypto asset management is shifting toward formal licensing and supervisory convergence across major hubs, which affects where portfolio management, custody, and related advisory services can be offered at scale. In the European Union, Regulation (EU) 2023/1114 (MiCA) established a harmonized authorization regime for crypto-asset service providers, and ESMA said the MiCA transitional period for CASPs ended on 1 July 2026, requiring unauthorized firms to cease services or proceed under a wind-down plan.
In the United Kingdom, the Reporting Cryptoasset Service Providers (Due Diligence and Reporting Requirements) Regulations 2025 took effect on 1 January 2026, implementing the OECD Crypto-Asset Reporting Framework and increasing due-diligence and reporting obligations for platforms and intermediaries interacting with HMRC. In the United States, the SEC issued an interpretation effective 23 March 2026 clarifying the application of federal securities laws to certain crypto assets and digital transactions, which supports more standardized compliance approaches around token classification and transaction structures for registered market participants.
Competitive Landscape
The crypto asset management market shows moderate concentration: the top five custodians manage roughly 45% of institutional assets under custody. Coinbase widened its moat by acquiring Deribit in January 2025, adding options and futures to its institutional stack. Fidelity Digital Assets partnered with Charles Schwab in March 2025, embedding crypto into brokerage accounts that serve more than 30 million customers. These moves demonstrate how incumbents leverage distribution scale instead of pure technology to defend their share.
Technology differentiation is narrowing as MPC, hardware security modules, and proof-of-reserves audits become baseline features. Fireblocks processed USD 4 trillion in transfers during 2024, validating MPC at an institutional scale. Anchorage secured conditional U.S. bank status, positioning itself for federally supervised custody mandates. White-space remains in tokenized securities custody, hybrid deployments, and DeFi yield aggregation, where newer entrants can carve tailored niches.
Insurance capacity and regulatory licenses now form the hardest assets to replicate, creating high entry barriers. The convergence of trad-fi brands, exchange affiliates, and crypto-native specialists keeps pricing competitive, yet a clear shift toward service bundles over stand-alone software persists. Over the forecast horizon, suppliers that align with banking regulators and global insurers should outperform, confirming the strategic importance of compliance capital inside the crypto asset management market.
Crypto Asset Management Industry Leaders
BitGo, Inc.
Coinbase, Inc.
Gemini Trust Company, LLC
Cipher Technologies Management LP
Metaco SA
- *Disclaimer: Major Players sorted in no particular order
Crypto Asset Management Market Companies Covered in this Report
- Coinbase Global Inc.
- Fidelity Digital Assets
- BitGo Inc.
- Binance Holdings Ltd.
- Gemini Trust Company LLC
- Anchorage Digital
- Fireblocks Ltd.
- Metaco SA
- Crypto Finance AG
- Paxos Trust Company LLC
- Bakkt Holdings Inc.
- Ledger Enterprise Solutions
- Cipher Technologies Management LP
- Amberdata Inc.
- ICONOMI Ltd.
- CoinShares International Ltd.
- Galaxy Digital Holdings Ltd.
- Bitwise Asset Management
- Copper Technologies Ltd.
- Hex Trust Ltd.

Market Opportunities and Future Outlook
Regulatory hardening and institutional product broadening are creating whitespace in compliance-led service bundles, multi-asset portfolio construction, and cross-border settlement workflows adjacent to custody. With the end of MiCA transitional arrangements on 1 July 2026, the EU effectively moved to a license-or-exit environment, increasing demand for MiCA-ready operating models that pair crypto-asset portfolio management with controlled custody, reporting, and resilience practices aligned to supervised standards.
On the product side, the shift beyond single-token exposure shows up in 2026 launches, including T. Rowe Price's actively managed multi-token crypto ETF (TKNZ), which points to manager appetite for rotation, risk budgeting, and research-driven allocation rather than passive, single-asset positioning. Stablecoin-linked payment and treasury rails also create enterprise-oriented opportunities for asset managers and their vendors to package custody, compliance, and settlement tooling together, supported by 2026 partnerships that integrate stablecoin infrastructure into cross-border payments and settlements.
Recent Industry Developments in Crypto Asset Management Market
- June 2026: BitGo launched regulated electronic trading services in the Middle East and North Africa through BitGo MENA FZE under Dubai VARA oversight. The expansion moves BitGo beyond custody into a more complete regulated trading stack in a region positioning itself as a digital-asset hub, improving its coverage of institutional workflows end-to-end.
- April 2026: Gemini Olympus, LLC received a Derivatives Clearing Organization (DCO) license from the CFTC, enabling it to operate as a regulated clearinghouse for derivatives, including prediction markets. This expands Gemini's regulated market infrastructure footprint and supports more institutional-grade risk management and margining capabilities around crypto-linked derivatives.
- April 2025: Fidelity Digital Assets launched a managed Ethereum staking service that covers validator operations and tax reporting. By packaging staking operations and compliance administration, the offering reduces operational barriers for institutions seeking protocol rewards within governed investment programs.


Crypto Asset Management Market Report Scope and Research Methodology
Market Definition and Coverage
For this report, the crypto asset management market covers paid products and services used to manage, safeguard, and run portfolios of crypto assets for retail and institutional clients, including portfolio tools, custody, reporting, and related advisory support, across major regions.
Scope exclusions: We exclude pure crypto trading venues, crypto mining, and blockchain infrastructure that is sold without an asset management or custody use case.
Segments Covered in This Report
- By Type
- Solutions
- Custody Solutions
- Tokenisation Solutions
- Transfer and Remittance Solutions
- Trading Solutions
- Reporting and Analytics Solutions
- Services
- Consulting Services
- Managed Services
- Integration and Implementation Services
- Solutions
- By Deployment Mode
- Cloud
- On-premise
- Hybrid
- By End-User Industry
- BFSI
- Retail and Ecommerce
- Media and Entertainment
- Healthcare
- Travel and Hospitality
- Government and Public Sector
- Other End-User Industries (Energy and Logistics)
- By User Type
- Institutional Investors
- High Net-Worth Individuals
- Crypto Funds
- Retail Investors
- Family Offices
- Corporate Treasuries
- By Investment Strategy
- Passive Index Funds
- Actively Managed Funds
- DeFi Yield Farming
- Staking and Lending
- Arbitrage Strategies
- By Asset Class
- Bitcoin (BTC)
- Ethereum (ETH)
- Stablecoins
- Altcoins (ex-BTC and ETH)
- Tokenised Securities
- By Geography
- North America
- United States
- Canada
- Mexico
- Europe
- United Kingdom
- Germany
- France
- Italy
- Rest of Europe
- Asia-Pacific
- China
- Japan
- India
- South Korea
- Rest of Asia
- Middle East
- Israel
- Saudi Arabia
- United Arab Emirates
- Turkey
- Rest of Middle East
- Africa
- South Africa
- Egypt
- Rest of Africa
- South America
- Brazil
- Argentina
- Rest of South America
- North America
Data Sources, Market Sizing, and Validation
Desk Research
Desk research starts with mapping the addressable demand pool and the guardrails around it, since crypto markets can look bigger or smaller depending on what is counted. We used public sources such as SEC filings and guidance, FINRA notices, and selected central bank and financial regulator publications to understand custody expectations and investor protections that shape which services qualify as asset management.
To calibrate market drivers, we also referred to sources such as BIS papers, IMF financial stability notes, and selected digital asset policy and adoption publications from industry bodies. Alongside these, we reviewed company annual reports, quarterly updates, and investor presentations for revenue mixes and service scope, and we used paid databases for company financials and intelligence, news and financials, and patent databases to track product claims and the direction of security features. The sources mentioned here are illustrative and not exhaustive, and other public datasets and documents were also used for data collection, validation, and clarification.
Primary Interviews and Surveys
Primary work focused on confirming what buyers actually pay for and how providers bill it, since fee structures vary across custody, active management, and yield strategies. We spoke with asset managers, crypto funds, custodians, compliance specialists, and enterprise users across APAC, EMEA, and the Americas to close gaps on typical fee bands, client onboarding friction, and the timing of AUM shifts that do not show up cleanly in public sources.
Distribution of primary research fieldwork respondents
| Company type | Respondent position | Region |
|---|---|---|
| Top tier: 37% | CXOs: 15% | APAC: 43% |
| Mid tier: 46% | Functional/Unit leaders: 29% | EMEA: 34% |
| Smaller Players: 17% | Managers: 56% | Americas: 23% |
Market-Sizing & Forecasting
Our main model uses top-down logic that rebuilds revenue potential from the managed-asset base and expected fee capture, then filters it by which crypto assets and strategies are actively serviced by providers in each region. To keep totals realistic, we corroborated the output with selective bottom-up checks, such as sampled provider revenue disclosures, channel conversations on custody and management fees, and volume by client cohort multiplied by observed average pricing ranges.
Key inputs include managed AUM trends for crypto products, mix shifts by client type (institutional, HNW, retail, and corporate treasuries), fee-rate ranges by service line, share of assets held in custody-grade setups versus self-custody, and adoption of staking, lending, and DeFi yield programs that expand addressable revenues. We also tracked policy milestones, incident-driven security spending, and regional licensing progress, since these can change onboarding speed and service scope.
Where bottom-up data was missing for smaller providers, we used peer-group averages as starting assumptions, then adjusted them for regional client mix using interview feedback. For forecasting, scenario analysis was applied, since crypto AUM, pricing, and risk appetite can move quickly across market cycles. Growth paths were built for the demand pool and fee capture, then reconciled with primary feedback on likely product rollout timing, compliance costs, and expected customer acquisition pace.
Data Validation & Update Cycle
Validation is done through checks that can be repeated each time the model is updated. Outputs are compared against independent signals such as changes in crypto product AUM, reported fee income direction from public companies, and licensing activity that indicates whether services can be offered at scale.
Outliers are reviewed through variance checks on fee rates, client mix, and regional adoption, followed by an analyst review step so assumptions remain consistent across the dataset. When a major policy decision, security event, or AUM shock occurs, we re-contact selected experts to confirm the impact and adjust the near-term trajectory. Reports refresh annually, and before delivery a final pass is performed so clients receive the latest updated view.
Mordor Intelligence's Crypto Asset Management Market Size Versus Other Published Estimates
Published market sizes for crypto asset management often differ because the line between asset management, custody, and general crypto services is not drawn the same way by every publisher. Gaps can also come from how fee income is modeled, how fast AUM is assumed to expand, and whether the numbers reflect a point-in-time cycle peak or a steadier average.
AUM trend checks, fee-rate validation from interviews, and scope screening for custody and managed strategies are the evidence points that keep Mordor Intelligence's 2025 estimate anchored to paid asset management activity, rather than exchange revenues or general blockchain tooling.
Benchmark comparison
| Source | Market Size | Gaps in Research Methodology |
|---|---|---|
| Mordor Intelligence | USD 2.35 B (2025) | |
| Trade Journal A | USD 0.60 B (2023) | Uses an earlier base year and tends to reflect a narrower definition tied to platform-led crypto management tools, which can exclude custody-grade services and institutional advisory revenues. |
| Industry Blog B | USD 1.06 B (2024) | Often summarizes secondary figures without a clear split between asset management fees and adjacent crypto service revenues, and it is less explicit about fee-rate assumptions and currency timing. |
The comparison shows that year selection and scope boundaries explain most of the spread, followed by how fee capture is applied to AUM that can change quickly across cycles. By tying the model to observable managed-asset signals, realistic pricing ranges, and repeatable scope filters, the final market number stays transparent enough to be checked and updated as conditions shift.


Key Questions Answered in the Report
What is the current value of the crypto asset management market?
The crypto asset management market size reached USD 3.04 billion in 2026 and is projected to hit USD 8.47 billion by 2031.
How fast is the crypto asset management market expected to grow?
The market is forecast to register a 22.72% CAGR between 2026 and 2031.
Which deployment model is gaining the most traction with regulators?
Hybrid architectures are advancing at a 23.83% CAGR because they balance data sovereignty with cloud scalability mandates.
Why are corporate treasuries investing in digital assets?
Balance-sheet allocations are shifting from opportunistic buys to strategic hedges, leading corporate treasuries to grow at a 23.91% CAGR through 2031.
What asset class is growing fastest within managed portfolios?
Tokenized securities are projected to expand at a 24.86% CAGR as real-world assets migrate onto blockchain rails.
Which region offers the highest growth potential?
Asia Pacific is forecast to grow at a 24.79% CAGR, supported by Japan, South Korea, Hong Kong, and Singapore's evolving regulatory clarity.
Page last updated on:


 Your data is secure and never sold or shared.


