Market Overview
| Study Period | 2021 - 2031 |
|---|---|
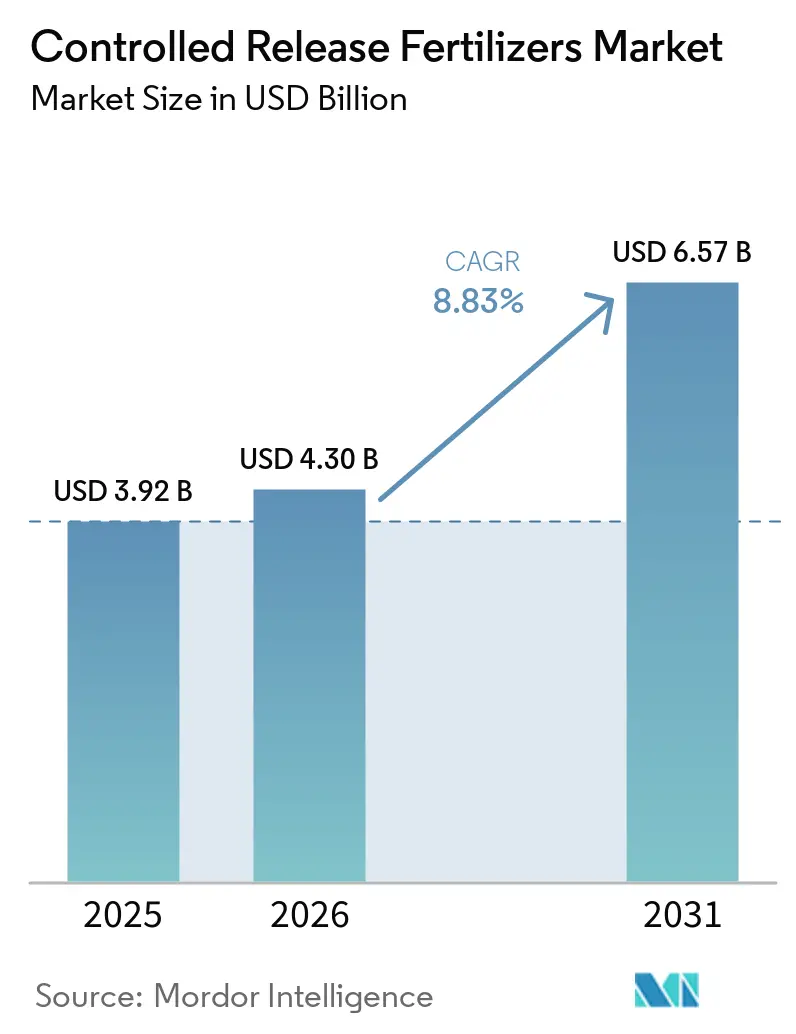
| Market Size (2026) | USD 4.30 Billion |
| Market Size (2031) | USD 6.57 Billion |
| Growth Rate (2026 - 2031) | 8.83% CAGR |
| Fastest Growing Market | Asia-Pacific |
| Largest Market | North America |
| Market Concentration | High |
Major Players *Disclaimer: Major Players sorted in no particular order Image © Mordor Intelligence. Reuse requires attribution under CC BY 4.0. | |
Controlled Release Fertilizers Market Analysis by Mordor Intelligence
The controlled release fertilizers market size was valued at USD 3.92 billion in 2025 and is projected to reach USD 4.30 billion in 2026, further expanding to USD 6.57 billion by 2031, registering a CAGR of 8.8% during the forecast period from 2026 to 2031. Heightened scrutiny of nutrient losses, resin inflation that rewards application efficiency, and new European Union rules on polymer biodegradability are accelerating product reformulation and demand. Growers are also turning to long-lasting granules to offset labor shortages because one or two basal applications replace four to six field visits. Precision farming platforms that match sensor data with variable-rate spreaders further expand the addressable acreage by providing a return on the price premium. Meanwhile, water-stressed regions are pairing slow-release granules with drip irrigation to shrink leaching and runoff. Tight supply of polyethylene and polyurethane feedstocks is nudging producers toward starch-polyester blends that comply with the 2028 biodegradability deadline and reduce exposure to petrochemical volatility.
Key Report Takeaways
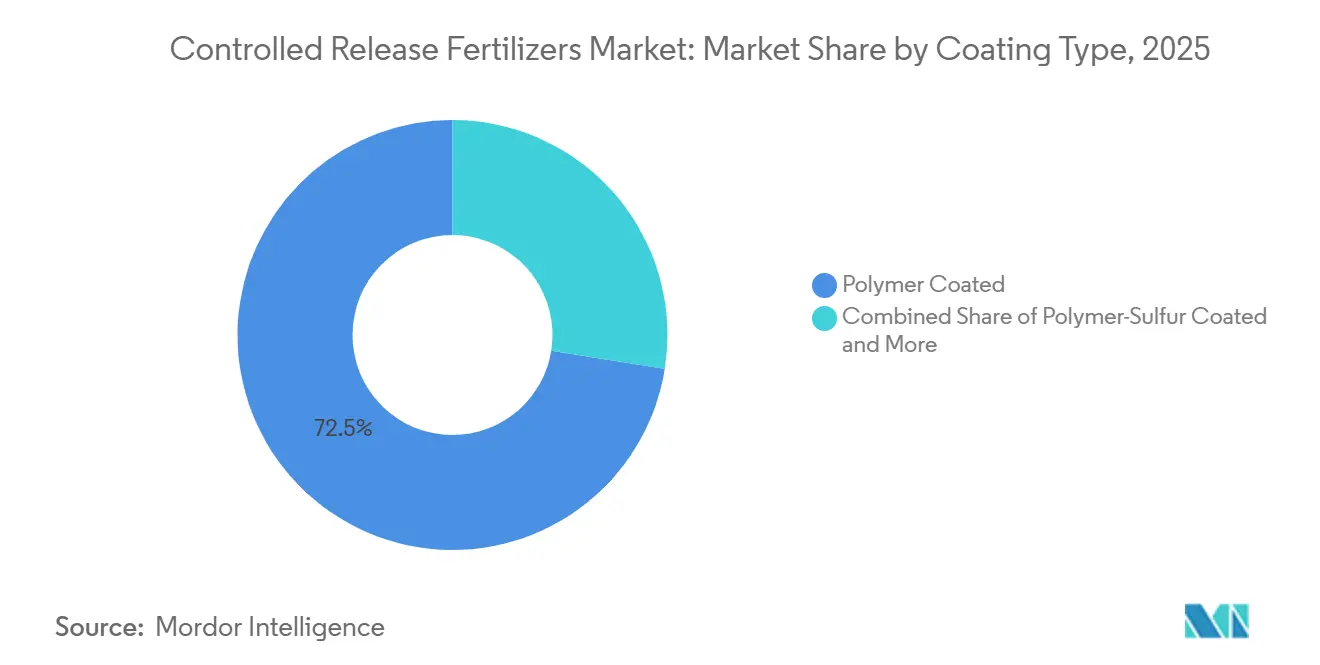
- By Coating Type, polymer-coated products held the largest 72.5% of the controlled release fertilizers market share in 2025 and are projected to fastest growing segment at a 7.4% CAGR during 2026 to 2031.
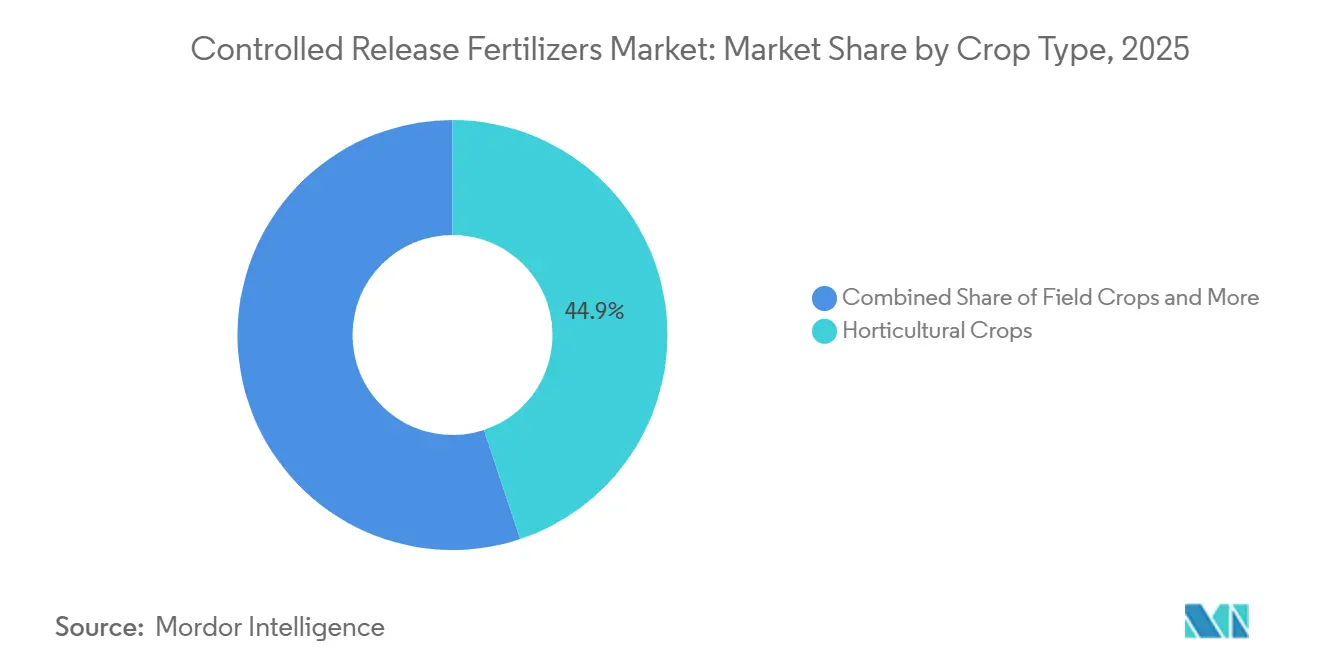
- By crop type, horticultural crops accounted for the largest share of the controlled-release fertilizers market size in 2025, contributing 44.9% of total market revenue, while turf and ornamental crops are forecast to expand the fastest, at a CAGR of 7.2% through 2031.
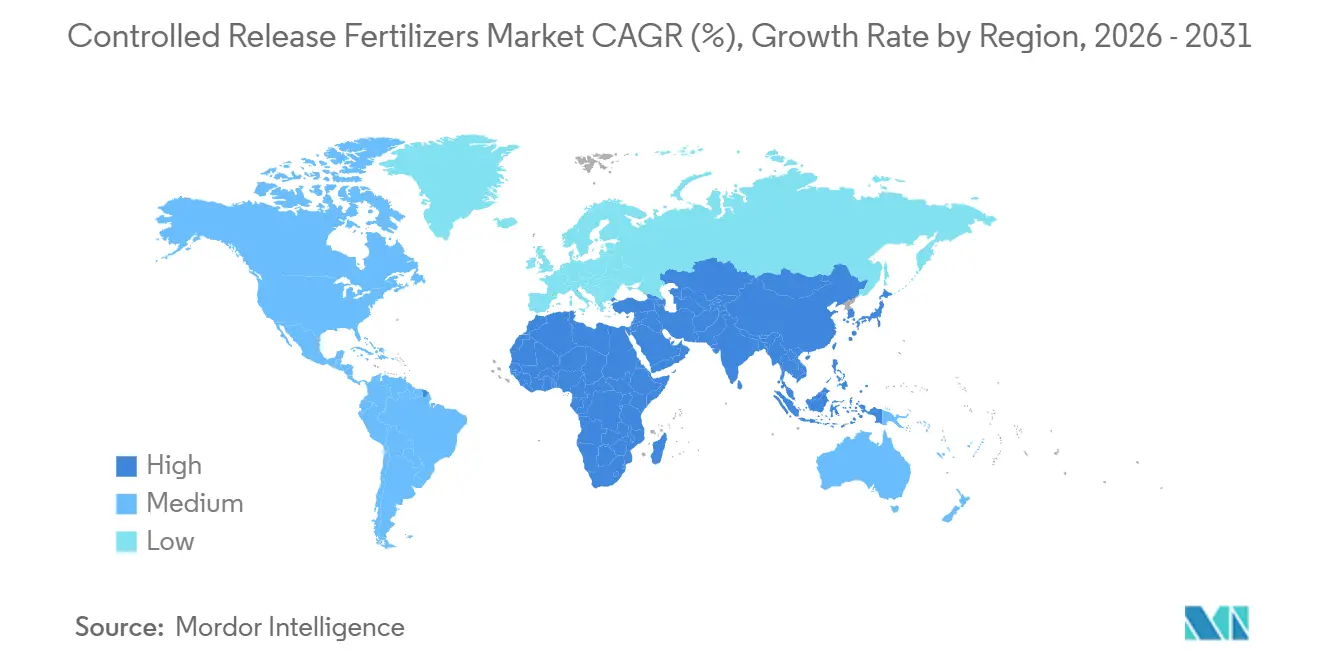
- By region, North America held the largest market share, at 31.2% in 2025, while Asia-Pacific is projected to be the fastest-growing region, expanding at a CAGR of 7.6% through 2031.
Note: Market size and forecast figures in this report are generated using Mordor Intelligence’s proprietary estimation framework, updated with the latest available data and insights as of 2026.
Global Controlled Release Fertilizers Market Trends and Insights
Drivers Impact Analysis*
| Driver | (~) % Impact on CAGR Forecast | Geographic Relevance | Impact Timeline |
|---|---|---|---|
| Precision agriculture technology integration | +1.2% | North America, Western Europe, and Australia | Medium term (2-4 years) |
| Environmental regulations and sustainability rules | +1.5% | Europe, North America, and accelerating in Asia-Pacific after 2027 | Long term (≥ 4 years) |
| Water scarcity and irrigation efficiency | +1.3% | Middle East and Africa, Mediterranean Europe, western United States, and northern China | Medium term (2-4 years) |
| Labor cost reduction and application convenience | +0.9% | North America, Western Europe, Japan, and peri-urban Asia-Pacific | Short term (≤ 2 years) |
| Climate change adaptation and crop resilience | +0.8% | Global, most salient in South Asia and drought-prone Sub-Saharan Africa | Long term (≥ 4 years) |
| Food security and productivity optimization | +1.1% | South Asia, Southeast Asia, and Sub-Saharan Africa | Medium term (2-4 years) |
| Source: Mordor Intelligence | |||


Precision Agriculture Technology Integration
Variable-rate spreaders now sync with soil-moisture probes and nutrient sensors, letting growers place coated granules only in zones that pay back the premium[1]Source: United States Department of Agriculture Agricultural Research Service, “Variable-Rate Nitrogen in the Corn Belt,” ars.usda.gov. Midwestern field trials cut total nitrogen use 20% to 40% without hurting yield, driving direct-sourcing deals where producers customize release curves to local rainfall. Equipment firms embed Internet-of-Things modules that log every application, a feature that meets new certification audits in North America and Europe. By linking nutrient prescriptions with seed and crop-protection packages, service providers create data-driven bundles that tie customers to their platforms. These digital touchpoints shorten the adoption curve for the controlled release fertilizers market by quantifying both yield lift and environmental compliance.
Environmental Regulations and Sustainability Rules
European Regulation 2024/2770 forces 90% biodegradation of coatings within 48 months plus the nutrient-release period, disqualifying legacy polyethylene shells[2]Source: European Chemicals Agency, “Regulation 2024/2770 on Biodegradability of Polymer Coatings,” echa.europa.eu. Multinationals have redirected research and development budgets toward starch blends and polycaprolactone, but field performance varies with temperature and moisture. California began regulating microplastics in 2025 through its existing Safer Consumer Products (SCP) program and new sector-specific laws. Additionally, other states in the United States have drafted similar statutes. ICL Group set aside USD 20 million in 2025 for bio-coating pilot lines, and Haifa Group teamed with a Dutch institute to validate starch-polyester films under greenhouse conditions[3]Source: ICL Group, “Annual Report 2025,” icl-group.com. These investments aim to hit the 2028 deadline without sacrificing release precision that underpins the controlled release fertilizers market.
Water Scarcity and Irrigation Efficiency
Rising water scarcity across arid and semi-arid regions is accelerating the adoption of Controlled-Release fertilizers (CRFs) that synchronize nutrient release with limited irrigation cycles. In greenhouse systems in Saudi Arabia, CRFs are paired with recirculating hydroponics to reduce water consumption compared to open-field fertigation. Israel’s subsurface drip irrigation increasingly integrates coated urea to maintain nutrient availability during extended dry periods, a model now expanding into Morocco and Jordan. In tree crops and vineyards, CRFs support deficit-irrigation strategies by ensuring a steady nutrient supply even when soil moisture is deliberately restricted. These agronomic and water-efficiency benefits strengthen CRFs’ positioning as a critical input for sustainable water management in water-stressed agricultural markets.
Labor Cost Reduction and Application Convenience
Growers substituting four split dressings with one coated basal pass shrink labor hours. Japanese nurseries adopt polymer-coated fertilizers to offset an aging workforce earning more than USD 11 per hour. Golf-course superintendents in Florida and Arizona rely on a single pre-season treatment to hold turf color through peak play, cutting staff overtime. In Kenyan maize trials, one coated application matched yields from neighbors using three urea visits, proving value to smallholders. This convenience advantage cements loyalty to the controlled release fertilizers market even when input prices climb.
Restraints Impact Analysis*
| Restraint | (~) % Impact on CAGR Forecast | Geographic Relevance | Impact Timeline |
|---|---|---|---|
| High production costs and price premium | -1.0% | South Asia, Southeast Asia, and Sub-Saharan Africa | Short term (≤ 2 years) |
| Limited farmer awareness and technical gaps | -0.7% | South Asia, Sub-Saharan Africa, and South America | Medium term (2-4 years) |
| Microparticle-shedding concerns and traceability lobbying | -0.5% | North America, Europe, Australia, and Japan | Medium term (2-4 years) |
| Inflation-driven polymer cost spikes squeezing margins | -0.9% | Global, most acute where producers lack vertical integration | Short term (≤ 2 years) |
| Source: Mordor Intelligence | |||
High Production Costs and Price Premium
Polymer-coated fertilizers are priced significantly higher than subsidized conventional urea, which limits their adoption among price-sensitive smallholders, despite their favorable long-term agronomic benefits. The high capital investment required, typically USD 10–15 million to establish a coating line, acts as a barrier to entry, contributing to concentrated market structures in several regions. Furthermore, currency depreciation in major agricultural economies, such as Brazil in 2025, increased import and raw material costs, further widening the price gap. Unless policy frameworks integrate the environmental efficiency benefits of these fertilizers into subsidy structures, the higher upfront costs of controlled-release fertilizers will likely continue to restrict their adoption and moderate overall market growth.
Limited Farmer Awareness and Technical Gaps
Surveys in Bangladesh and Ethiopia show fewer than 30% of growers understand release curves. Broadcast application on the soil surface, rather than incorporation, often halves efficiency gains, reinforcing skepticism. Extension agents juggling large caseloads lack time for demonstrations, and language barriers limit uptake of technical guides. Confusion between controlled-release granules and slow-release organics leads to under- or over-application. Closing this knowledge gap with field schools and mobile apps is pivotal for the controlled release fertilizers market.
*Our forecasts treat driver/restraint impacts as directional, not additive. The impact forecasts reflect baseline growth, mix effects, and variable interactions.
Segment Analysis
By Coating Type: Polymer Dominance Faces Bio-Based Disruption
Polymer coated fertilizers emerged as the largest coating type, capturing 72.5% of the controlled release fertilizers market size in 2025, and are projected to expand at a 7.4% CAGR through 2031, supported by their compatibility with automated applicators. Polyethylene and polyurethane lead because layer thickness and additive packages fine-tune permeability, yet the European Union biodegradability rule accelerates a pivot to polycaprolactone and starch-polyester films. Polymer–sulfur-coated fertilizers meet dual nitrogen and sulfur needs in the Great Plains and Canadian Prairies, giving row-crop growers value at a modest price lift. Wax and resin coatings linger in niche lawn and nursery channels where 6- to 12-month release is standard. Patents filed in 2025 describe temperature-responsive layers that speed nutrient flow in warm spells and slow it in cooler periods, aligning with crop uptake curves.
Regulatory overlap between European Regulation 2019/1009 and the 2024 biodegradability amendment favors vertically integrated suppliers able to re-engineer recipes at scale. Smaller regional coaters lacking research and development depth must partner with resin innovators or risk losing market share. Meanwhile precision planters with fertilizer hoppers demand free-flowing uniform granules, which is a trait firmly in polymer’s wheelhouse. These crosscurrents keep polymer coatings at the core of the controlled release fertilizers market, even as bio-based challengers stake new territory.


By Crop Type: Horticulture Anchors Revenue
Horticultural crops accounted for 44.9% of the controlled release fertilizers market size in 2025, representing the largest crop segment. This demand is driven by greenhouse vegetables, fruits, nurseries, and other high-value crops that benefit from prolonged nutrient release and enhanced nutrient-use efficiency. Consumer preference for locally produced, sustainably grown food continues to drive greenhouse expansion. Additionally, certification programs and nutrient stewardship initiatives further encourage the adoption of controlled release fertilizers in horticultural systems.
Turf and ornamental crops are projected to grow the fastest, with a CAGR of 7.2% through 2031. This growth is fueled by landscaping projects, golf courses, sports facilities, and urban green spaces, all of which require consistent nutrient availability with fewer fertilizer applications. Field crops also remain a significant segment, particularly in North America and Australia, where large-scale producers increasingly adopt controlled release fertilizers to minimize nutrient losses and enhance application efficiency over extended growing periods.
Geography Analysis
North America was the largest regional market, accounting for 31.2% of global revenue in 2025. Demand in the United States spans California vegetables, Florida citrus, Pacific Northwest berries, and Corn Belt water-quality programs that subsidize coated urea. Canada’s Prairie growers deploy polymer–sulfur blends to feed canola and wheat, aided by provincial extension field trials. Mexico’s greenhouse vegetable producers in Sinaloa and Baja California are increasingly adopting coated granules to meet sustainability requirements imposed by United States and Canadian retailers.
Asia-Pacific is anticipated to be the fastest-growing market, registering a CAGR of 7.6% through 2031. In China, the government promotes the adoption of coated fertilizers through nutrient-use efficiency targets. India supports the adoption of coated fertilizers through soil health initiatives, while labor shortages in Japan are driving demand for coated nutrient technologies. In Australia, the use of coated fertilizers is increasing in grain production systems to support compliance with environmental and runoff management requirements.
In the Middle East, the use of coated fertilizers is advancing through greenhouse horticulture and hydroponic farming initiatives in countries such as Saudi Arabia, United Arab Emirates, and Qatar. In Africa, adoption is progressing through pilot projects in Kenya and Tanzania, while South African vineyards and orchards are increasingly using coated fertilizers to comply with nutrient stewardship requirements for export markets. Europe is focusing on the development of biodegradable coating technologies, while South America is expanding coated fertilizer use in sugarcane, coffee, and greenhouse vegetable production despite challenges related to currency volatility and import costs.

Competitive Landscape
The controlled release fertilizers market remains highly concentrated because the leading five suppliers Grupa Azoty S.A. , ICL Group Ltd., Kingenta Ecological Engineering Group Co., Ltd., Florikan ESA LLC, and Nutrien Ltd. Vertical integration into potash, phosphate, or polymer feedstocks lets these companies buffer resin price swings and fund rapid compliance with European biodegradability rules, advantages that independent coaters lack. Patent filings for starch-polyester and polycaprolactone shells climbed sharply in 2024 and 2025, giving material-science startups fresh leverage when courting nutrient blenders that need bio-based solutions. As a result, long-established players are striking technology alliances to keep portfolios current while guarding their distribution footprints in North America and Europe. Consolidation pressure is visible in Asia-Pacific, where smaller formulators either partner with resin innovators or risk ceding share to integrated rivals that can undercut them on cost and compliance speed.
Strategic investment confirms this shift. Nutrien Ltd tested Internet-connected dispensers across fifty Canadian farms in March 2025, proving 15% to 20% nitrogen savings that tighten user lock-in to its retail channel. Haifa Group has invested USD 35.61 million in a new production facility. In September 2025, Kingenta Ecological Engineering Group, a leading Chinese specialty fertilizer company, completed the acquisition of a majority stake in a prominent Vietnamese agricultural distributor. This acquisition provided tariff-reduced access to Southeast Asia and included plans to establish a domestic coating line by 2027, highlighting the company's strategy to enhance regional cost efficiency and logistics control.
Competitive edges are now forged at the intersection of digital agronomy and nutrient fortification. Suppliers that embed QR-coded labels feed application data directly into farm-management platforms, helping growers document carbon footprints and satisfy food-chain audits. Micronutrient-enriched controlled release blends carrying zinc, boron, or iron open fresh demand in the Indo-Gangetic Plain and Sub-Saharan maize belts where hidden hunger constrains yield. Bio-coatings that degrade within forty-eight months satisfy looming polymer rules while sidestepping microplastic concerns in California and in the European Union, giving first movers a regulatory head start. These dynamics ensure that service breadth, traceability innovation, and resin agility will decide the next round of market share shifts inside the controlled release fertilizers market.
Controlled Release Fertilizers Industry Leaders
Kingenta Ecological Engineering Group Co., Ltd.
Nutrien Ltd.
Grupa Azoty S.A.
ICL Group Ltd.
Florikan ESA LLC
- *Disclaimer: Major Players sorted in no particular order


Recent Industry Developments
- March 2025: Haifa Group has invested USD 35.61 million in a new production facility. This plant will focus on producing Controlled-Release Fertilizers (CRFs) featuring a biodegradable coating designed to meet upcoming EU regulations and cater to the premium Mediterranean market.
- January 2025: Nutrien Ltd. completed a significant expansion of its ESN (Environmentally Smart Nitrogen) production capacity at its Rocanville, Saskatchewan facility, which became fully operational in early 2025. This upgrade added 150,000 metric tons per year of biodegradable polymer-coated urea production capacity and incorporated advanced spectroscopy for real-time quality control.
- January 2024: Pursell Agritech and Yara have joined forces, with Yara incorporating Pursell's cutting-edge controlled-release fertilizer coating technology into its offerings. As a result of this partnership, Yara unveiled PurMidas, a novel controlled-release fertilizer (CRF) tailored for turf applications.


Global Controlled Release Fertilizers Market Report Scope
Controlled-release fertilizers are granulated nutrients encapsulated in a semi-permeable coating that regulates the release of minerals over several months based on soil temperature and moisture. The controlled release fertilizers market report is segmented by coating type (polymer-coated, polymer-sulfur-coated, and others), crop type (field crops, horticultural crops, and turf and ornamental), and geography (Asia-Pacific, Europe, the Middle East and Africa, North America, and South America). The market forecasts are provided in terms of value (USD) and volume (metric tons).
By Coating Type
| Polymer Coated |
| Polymer-Sulfur Coated |
| Others |
By Crop Type
| Field Crops |
| Horticultural Crops |
| Turf and Ornamental |
By Geography
| Asia-Pacific | Australia |
| Bangladesh | |
| China | |
| India | |
| Indonesia | |
| Japan | |
| Pakistan | |
| Philippines | |
| Thailand | |
| Vietnam | |
| Rest of Asia-Pacific | |
| Europe | France |
| Germany | |
| Italy | |
| Netherlands | |
| Russia | |
| Spain | |
| Ukraine | |
| United Kingdom | |
| Rest of Europe | |
| Middle East & Africa | Nigeria |
| Saudi Arabia | |
| South Africa | |
| Turkey | |
| Rest of Middle East & Africa | |
| North America | Canada |
| Mexico | |
| United States | |
| Rest of North America | |
| South America | Argentina |
| Brazil | |
| Rest of South America |
| By Coating Type | Polymer Coated | |
| Polymer-Sulfur Coated | ||
| Others | ||
| By Crop Type | Field Crops | |
| Horticultural Crops | ||
| Turf and Ornamental | ||
| By Geography | Asia-Pacific | Australia |
| Bangladesh | ||
| China | ||
| India | ||
| Indonesia | ||
| Japan | ||
| Pakistan | ||
| Philippines | ||
| Thailand | ||
| Vietnam | ||
| Rest of Asia-Pacific | ||
| Europe | France | |
| Germany | ||
| Italy | ||
| Netherlands | ||
| Russia | ||
| Spain | ||
| Ukraine | ||
| United Kingdom | ||
| Rest of Europe | ||
| Middle East & Africa | Nigeria | |
| Saudi Arabia | ||
| South Africa | ||
| Turkey | ||
| Rest of Middle East & Africa | ||
| North America | Canada | |
| Mexico | ||
| United States | ||
| Rest of North America | ||
| South America | Argentina | |
| Brazil | ||
| Rest of South America | ||


Market Definition
- MARKET ESTIMATION LEVEL - Market Estimations for various types of fertilizers has been done at the product-level and not at the nutrient-level.
- NUTRIENT TYPES COVERED - Urea & Complex
- AVERAGE NUTRIENT APPLICATION RATE - This refers to the average volume of nutrient consumed per hectare of farmland in each country.
- CROP TYPES COVERED - Field Crops: Cereals, Pulses, Oilseeds, and Fiber Crops Horticulture: Fruits, Vegetables, Plantation Crops and Spices, Turf Grass and Ornamentals
| Keyword | Definition |
|---|---|
| Fertilizer | Chemical substance applied to crops to ensure nutritional requirements, available in various forms such as granules, powders, liquid, water soluble, etc. |
| Specialty Fertilizer | Used for enhanced efficiency and nutrient availability applied through soil, foliar, and fertigation. Includes CRF, SRF, liquid fertilizer, and water soluble fertilizers. |
| Controlled-Release Fertilizers (CRF) | Coated with materials such as polymer, polymer-sulfur, and other materials such as resins to ensure nutrient availability to the crop for its entire life cycle. |
| Slow-Release Fertilizers (SRF) | Coated with materials such as sulfur, neem, etc., to ensure nutrient availability to the crop for a longer period. |
| Foliar Fertilizers | Consist of both liquid and water soluble fertilizers applied through foliar application. |
| Water-Soluble Fertilizers | Available in various forms including liquid, powder, etc., used in foliar and fertigation mode of fertilizer application. |
| Fertigation | Fertilizers applied through different irrigation systems such as drip irrigation, micro irrigation, sprinkler irrigation, etc. |
| Anhydrous Ammonia | Used as fertilizer, directly injected into the soil, available in gaseous liquid form. |
| Single Super Phosphate (SSP) | Phosphorus fertilizer containing only phosphorus which has lesser than or equal to 35%. |
| Triple Super Phosphate (TSP) | Phosphorus fertilizer containing only phosphorus greater than 35%. |
| Enhanced Efficiency Fertilizers | Fertilizers coated or treated with additional layers of various ingredients to make it more efficient compared to other fertilizers. |
| Conventional Fertilizer | Fertilizers applied to crops through traditional methods including broadcasting, row placement, ploughing soil placement, etc. |
| Chelated Micronutrients | Micronutrient fertilizers coated with chelating agents such as EDTA, EDDHA, DTPA, HEDTA, etc. |
| Liquid Fertilizers | Available in liquid form, majorly used for application of fertilizers to crops through foliar and fertigation. |


Research Methodology
Mordor Intelligence follows a four-step methodology in all our reports.
- Step-1: IDENTIFY KEY VARIABLES: In order to build a robust forecasting methodology, the variables and factors identified in Step-1 are tested against available historical market numbers. Through an iterative process, the variables required for market forecast are set and the model is built on the basis of these variables.
- Step-2: Build a Market Model: Market-size estimations for the forecast years are in nominal terms. Inflation is not a part of the pricing, and the average selling price (ASP) is kept constant throughout the forecast period for each country.
- Step-3: Validate and Finalize: In this important step, all market numbers, variables and analyst calls are validated through an extensive network of primary research experts from the market studied. The respondents are selected across levels and functions to generate a holistic picture of the market studied.
- Step-4: Research Outputs: Syndicated Reports, Custom Consulting Assignments, Databases & Subscription Platforms


