Bioremediation Market Size and Share
Market Overview
| Study Period | 2019 - 2030 |
|---|---|
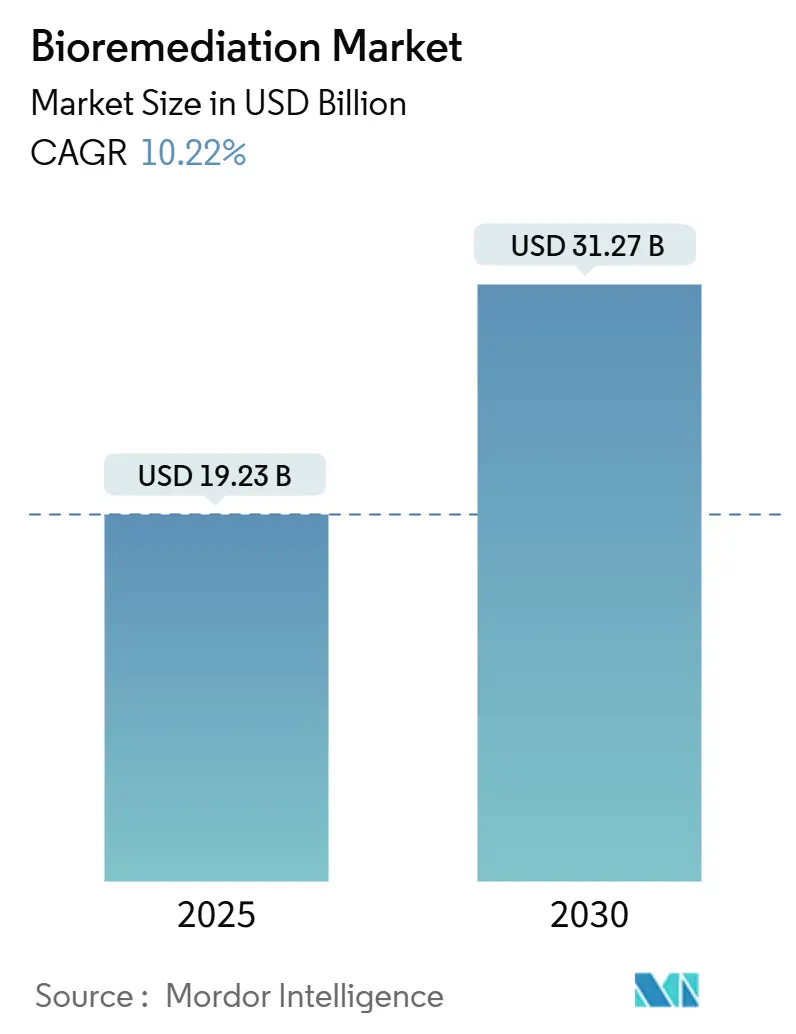
| Market Size (2025) | USD 19.23 Billion |
| Market Size (2030) | USD 31.27 Billion |
| Growth Rate (2025 - 2030) | 10.22% CAGR |
| Fastest Growing Market | Asia Pacific |
| Largest Market | North America |
| Market Concentration | Low |
Major Players *Disclaimer: Major Players sorted in no particular order Image © Mordor Intelligence. Reuse requires attribution under CC BY 4.0. | |
Bioremediation Market Analysis by Mordor Intelligence
The bioremediation market size is valued at USD 19.23 billion in 2025 and is projected to reach USD 31.27 billion by 2030, reflecting a 10.22% CAGR in the period under review. Rapid regulatory tightening, rising ESG-linked financing, and breakthroughs in microbial engineering underpin this expansion, pushing the bioremediation market toward mainstream adoption across multiple industrial verticals. Digital-twin monitoring platforms now allow operators to validate remediation performance in real time, a shift that improves project economics while satisfying stricter disclosure requirements. At the same time, the accelerating retirement of oil and gas infrastructure in the Gulf of Mexico and North Sea is generating multi-year project pipelines that favor solutions able to treat complex hydrocarbon, PFAS, and mixed-metal contaminations. Collectively these forces position the bioremediation market as an essential pillar of global environmental restoration efforts.
Key Report Takeaways
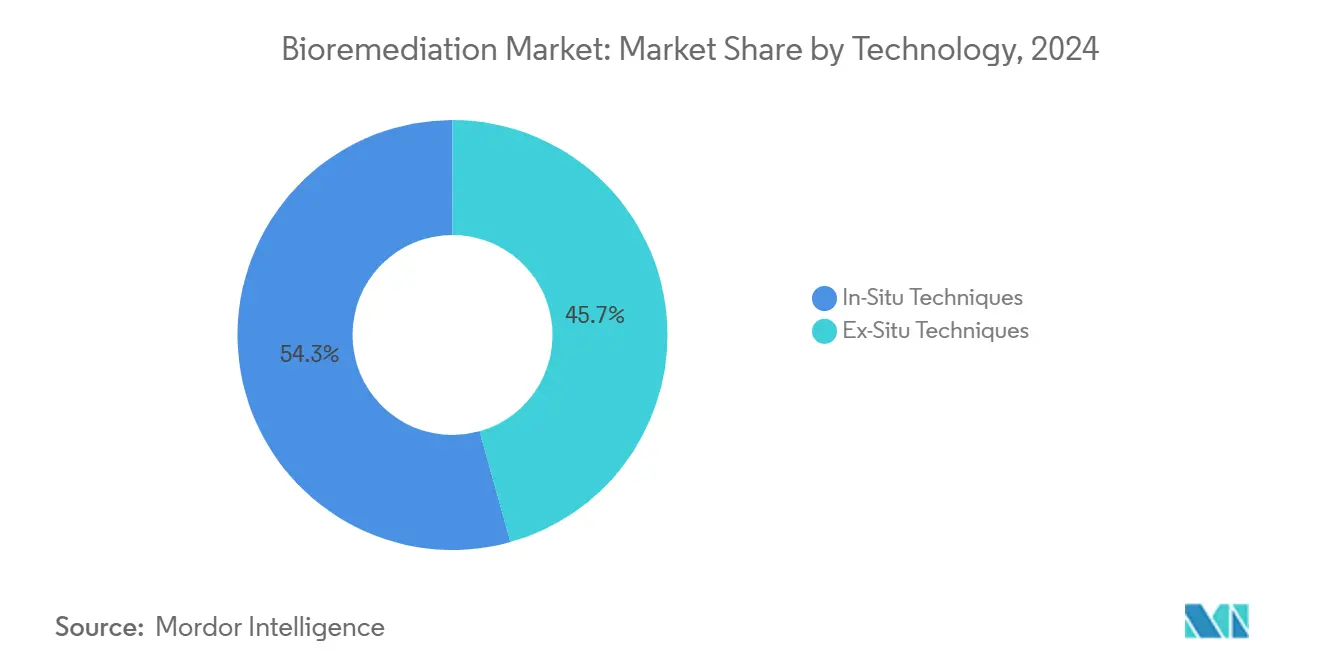
- By technology, in-situ techniques held 54.34% revenue share in 2024 while ex-situ techniques are forecast to expand at a 14.27% CAGR through 2030.
- By pollutant type, petroleum hydrocarbons accounted for 37.55% of the bioremediation market share in 2024, whereas PFAS and emerging contaminants are advancing at a 13.39% CAGR toward 2030.
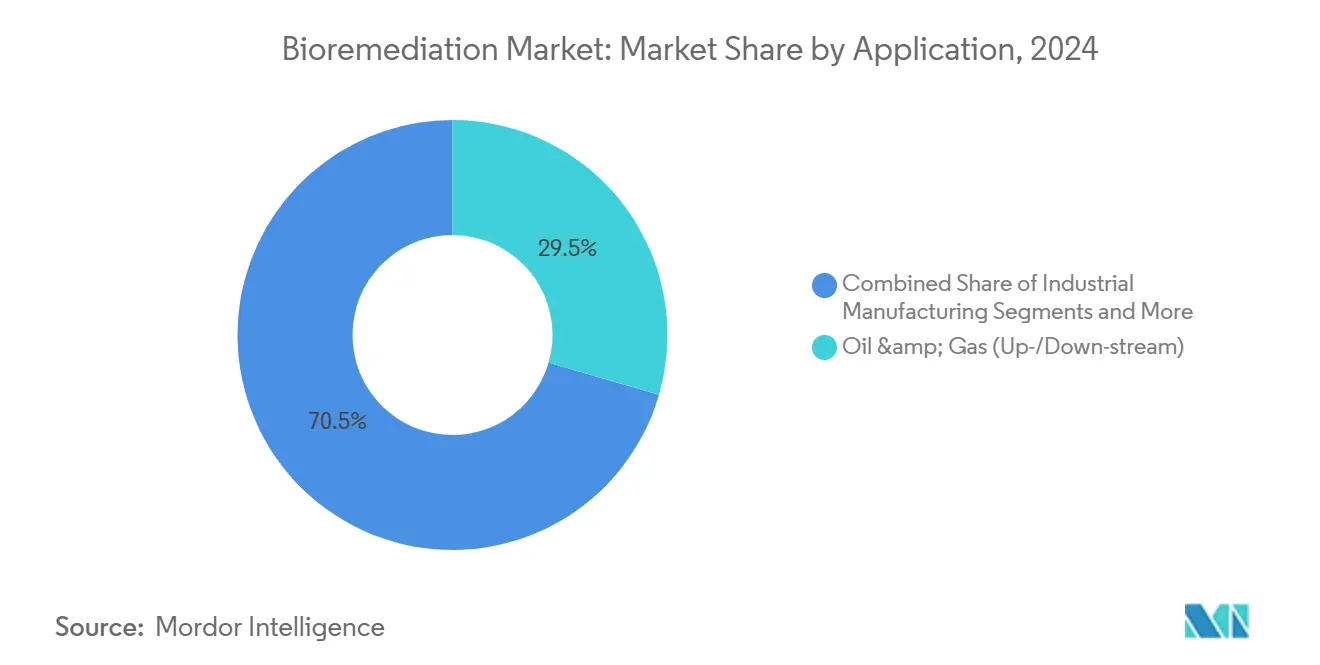
- By application, oil & gas sites captured 29.48% of the bioremediation market size in 2024 and biopharmaceutical wastewater is expected to grow at a 14.66% CAGR through 2030.
- By medium, solid bio-process waste represented 61.22% of the bioremediation market size in 2024, while liquid effluents lead growth at a 14.02% CAGR to 2030.
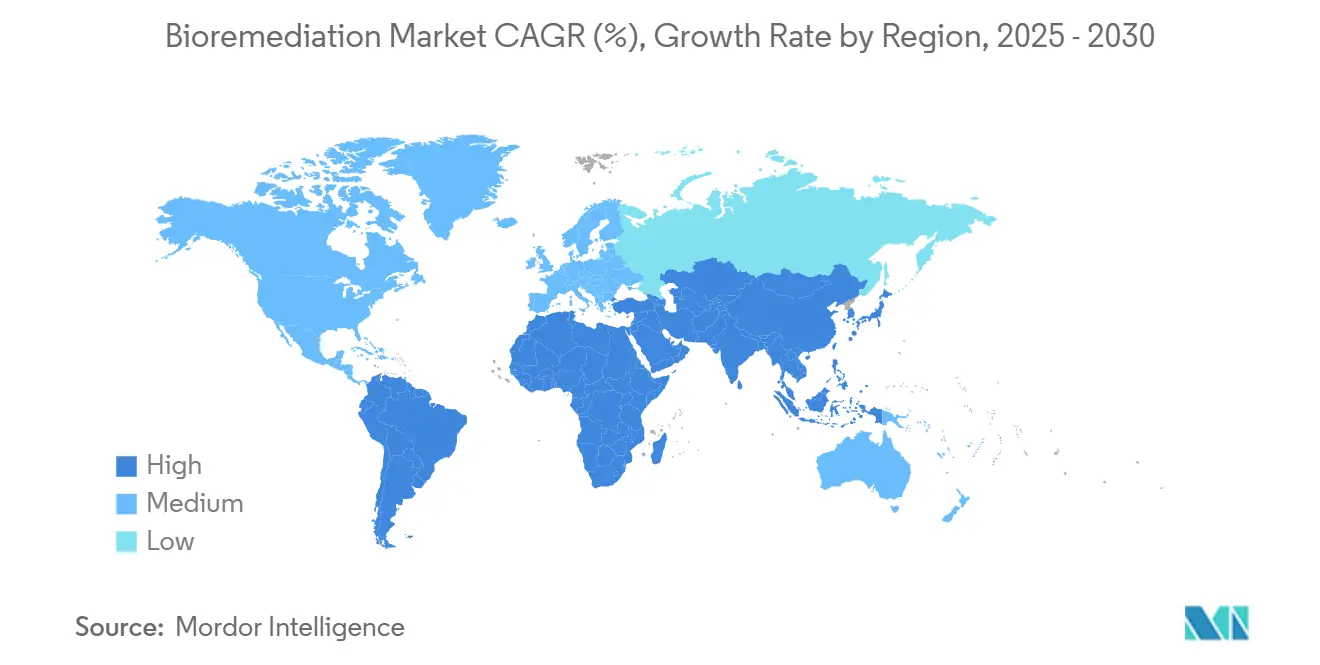
- By geography, North America contributed 39.47% of the bioremediation market share in 2024, with Asia-Pacific projected to post the fastest 12.79% CAGR through 2030.
Global Bioremediation Market Trends and Insights
Drivers Impact Analysis*
| Driver | (~) % Impact on CAGR Forecast | Geographic Relevance | Impact Timeline |
|---|---|---|---|
| Stringent GMP effluent-discharge limits for biologics plants | +2.1% | North America & EU, expanding to APAC | Medium term (2-4 years) |
| Rapid Decline In Cost Of In-Situ Bio-Stimulation Kits | +1.8% | Global, with early adoption in North America | Short term (≤ 2 years) |
| Oil & Gas Brownfield Decommissioning Wave (2025-30) | +2.3% | North America, North Sea, expanding globally | Long term (≥ 4 years) |
| Emergence Of AI-Enabled "Digital Twin" For Remediation Site Monitoring | +1.5% | North America & EU core, spill-over to APAC | Medium term (2-4 years) |
| Industrial Adoption Of Circular-Economy Bio-Products | +1.2% | Global, with concentration in developed markets | Long term (≥ 4 years) |
| Rise Of ESG-Linked Financing Tied To Verified Remediation Outcomes | +1.3% | Global, led by institutional investors in developed markets | Medium term (2-4 years) |
| Source: Mordor Intelligence | |||
Stringent GMP effluent-discharge limits for biologics plants
Enhanced Clean Water Act test methods require biologics manufacturers to detect PFAS and PCB compounds at far lower thresholds, prompting rapid upgrades to membrane bioreactor systems that integrate AI oversight for predictive maintenance. Facilities adopting these systems have reported 90% cost reductions alongside 99% contaminant removal efficiency. Because effluent streams from monoclonal antibody production contain novel proteins and solvents, the regulatory changes are creating an inelastic demand for advanced treatment that favors microbial solutions over chemical oxidants. As regulators expand audits to Asia-Pacific, multinational drug makers are standardizing corporate water stewardship policies to secure license renewals. The shift converts compliance from a sunk cost into a strategic lever for brand reputation, accelerating purchases across the bioremediation market.
Rapid decline in cost of in-situ bio-stimulation kits
Korean advances in activated-carbon recycling now cut energy needs for vapor-phase treatment by 70% while retaining 90% adsorption capacity. Combined with simplified bacterial-concentration protocols that eliminate specialized reactors at field sites, mid-tier industrial operators can deploy bio-stimulation within days instead of weeks. The falling capital intensity lowers the entry barrier for regional consultancies, widening the supplier pool and encouraging competitive pricing across the bioremediation market. These kits also enable remote mining camps and small municipalities to meet environmental mandates without importing large volumes of equipment. As a result, global adoption curves are steepening during the next two fiscal years.
Oil & gas brownfield decommissioning wave (2025-30)
The Government Accountability Office reports that 75% of Gulf of Mexico platforms remain past lease deadlines, creating an urgent backlog that favors biological soil and sediment treatment.[1]U.S. Government Accountability Office, “Offshore Oil and Gas: Interior Needs to Improve Decommissioning Enforcement,” gao.gov Europe follows suit, with more than 100 North Sea platforms slated for dismantlement where biological approaches simplify logistics compared to dredging. Chevron’s reef-conversion pilots demonstrate that integrating in-situ bioremediation with habitat creation can lower remediation outlays while delivering biodiversity co-benefits. Long-lived decommissioning programs alter procurement dynamics, encouraging contractors to lock in multi-year microbial reagent supply agreements. Consequently, the bioremediation market gains a stable revenue base insulated from broader commodity cycles.
Emergence of AI-enabled digital twin for remediation site monitoring
Sensor arrays linked to convolutional neural networks can now predict activated-carbon replacement cycles with 92% accuracy, cutting monitoring costs materially.[2]Simona Popescu et al., “AI and IoT for Pollution Monitoring,” frontiersin.orgDigital twins feed continuous pH, redox, and microbial-population data into cloud dashboards that technicians use to refine nutrient injections within hours. Adoption improves treatment yields while offering transparent metrics for lenders underwriting ESG-linked performance bonds. The technology further democratizes expertise as smaller field teams manage larger project portfolios, thereby lifting service margins. Over the medium term, digital twins will distinguish premium service providers inside the bioremediation market.
Restraints Impact Analysis*
| Restraint | (~) % Impact on CAGR Forecast | Geographic Relevance | Impact Timeline |
|---|---|---|---|
| Low Awareness Among Mid-Tier Industrial Sites Outside OECD | -1.4% | Emerging markets, particularly Southeast Asia and Latin America | Short term (≤ 2 years) |
| Site Heterogeneity Inflates Pilot-To-Full-Scale Cost Ratio | -1.8% | Global, with higher impact in complex industrial sites | Medium term (2-4 years) |
| Persistent PFAS & Mixed-Contaminant Complexity | -2.1% | Global, concentrated in industrialized regions | Long term (≥ 4 years) |
| Slow Regulatory Approvals For Gene-Edited Microbes | -1.6% | North America & EU primarily, expanding globally | Medium term (2-4 years) |
| Source: Mordor Intelligence | |||
Persistent PFAS & mixed-contaminant complexity
Decades of fluorochemical use have produced soil and groundwater plumes where PFAS co-occurs with hydrocarbons and heavy metals, creating chemical synergies that suppress microbial metabolism. Although Italian researchers isolated 20 bacterial strains that degrade PFAS by more than 30%, full-scale success remains limited to controlled settings.[3]Catholic University of the Sacred Heart, “PFAS-Eating Bacteria Discovered,” phys.org New plant-based lignocellulosic frameworks eliminate 98% PFOA and PFOS in laboratory columns, but field deployment requires specific hydrological conditions that seldom align across sites. Consequently, remediation budgets inflate as contractors layer multiple technologies, delaying project close-out and dampening demand growth within the bioremediation market.
Slow regulatory approvals for gene-edited microbes
Jurisdictional overlap among the EPA, USDA, and FDA adds three-to-five years to clearance timelines, increasing development costs for engineered strains capable of detoxifying recalcitrant compounds. While Chinese institutes have proven Vibrio natriegens can neutralize biphenyl and naphthalene in saline environments, commercial scale-up stalls in the absence of predictable approval pathways. Smaller biotech firms struggle to finance prolonged review cycles, tilting competitive advantage toward chemical oxidant vendors that operate under clearer rules. The hesitation constrains the most disruptive segment of the bioremediation industry and tempers near-term market acceleration.
*Our forecasts treat driver/restraint impacts as directional, not additive. The impact forecasts reflect baseline growth, mix effects, and variable interactions.
Segment Analysis
By Technology: In-situ techniques anchor market leadership
In-situ approaches delivered 54.34% of 2024 revenue, underpinned by their ability to minimize excavation costs while allowing ongoing site operations. Bioventing and biosparging enhancements that improve oxygen delivery are lifting degradation rates by up to 60%, reinforcing customer preference. Ex-situ systems, though smaller, record the strongest 14.27% CAGR as AI-optimized membrane bioreactors reach 99% removal efficiency, positioning them for process-intensive effluents. Together these dynamics sustain technology diversity inside the bioremediation market.
The ex-situ surge is supported by bio-reactor modularization, enabling factory-built skids to be shipped globally. Landfarming units fortified with biochar reach 76.6% hydrocarbon removal when paired with plant-microbe consortia, elevating soil fertility post-treatment. Such measurable co-benefits encourage regulators to phase out disposal-oriented dig-and-dump practices, expanding the addressable bioremediation market size at the technology level.


By Pollutant Type: PFAS drives innovation momentum
Petroleum hydrocarbons remain the volume leader at 37.55% of 2024 demand, reflecting mature metabolic pathways and decades of field validation. However, PFAS and emerging contaminants outpace every other category, advancing at a 13.39% CAGR because global directives now require virtually zero PFAS discharge into surface waters. Plant-derived sorbents that capture PFAS for subsequent biodegradation are commanding premium contract prices, lifting revenue quality across the bioremediation market.
Heavy-metal cleanups benefit from Bacillus subtilis biosorption methods that achieve complete lead removal along with 92.3% cadmium adsorption in bench trials. Industry uptake of these biological chelating agents is cutting chemical sludge generation, supporting circular-economy messaging. Pesticide remediation relies on hexa-bacterial consortia reaching 99.33% degradation of chlorantraniliprole, a development that resonates with agro-exporters seeking pesticide-free certification. The broadening pollutant portfolio enlarges the bioremediation market size across developing economies.
By Application: Biopharmaceutical wastewater surges
Oil & gas facilities delivered 29.48% of 2024 contract value, reflecting pipeline and platform retirements across mature basins. Yet, biopharmaceutical wastewater enjoys the fastest 14.66% CAGR as GMP tightening compels biologics plants to install advanced microbial reactors. These systems align with corporate net-zero water targets, making the procurement decision strategic rather than merely compliance driven. Mining & metallurgy sites adopt sulfate-reducing bioreactors that also recover nickel and copper, showcasing value-add potential.
Municipal landfills and life-science laboratories add diversified revenue streams by tapping into engineered bio-filters that metabolize volatile organic compounds at ambient temperatures. As each vertical internalizes the cost of legacy contamination, the bioremediation market expands laterally, reinforcing its resilience to cyclical downturns in any single industry.

By Medium: Liquid effluents set the technical frontier
Solid bioprocess waste accounted for 61.22% of 2024 spending, owing largely to extensive soil and sediment liabilities. Liquid effluents, however, are scaling at 14.02% CAGR because AI-driven membrane systems now integrate sensor feedback loops that keep microbial populations within optimal growth ranges. These closed-loop controls slash downtime and chemical dosing costs, factors that resonate with pharmaceutical and semiconductor fabs.
Airborne VOC treatment is benefiting from low-temperature activated-carbon recycling, lowering life-cycle energy consumption by 70%. The growing diversity of media-specific solutions broadens the bioremediation market share among specialist service providers while spurring cross-licensing of innovations between soil and water treatment vendors.
Geography Analysis
North America retained 39.47% of 2024 revenue, leveraging a mature regulatory landscape and the multibillion-dollar federal budget allocated to PFAS remediation in military bases. The United States Air Force’s new umbrella contract positions suppliers with proven in-situ thermal and biological systems for steady order flow. Canada’s mining sector, facing stricter tailings-closure rules, is likewise channeling demand toward sulfate-reducing bio-reactors.
Asia-Pacific produces the fastest 12.79% CAGR as China, India, and Southeast Asian economies tighten discharge permits for industrial parks. Chinese synthetic-biology hubs are piloting engineered Vibrio natriegens that thrive in saline aquifers, expanding feasible service areas along coastal zones. India’s state governments have begun including biological remediation credits inside smart-city tenders, multiplying municipal opportunities across the bioremediation market.
Europe maintains a robust pipeline of PFAS site assessments under REACH regulations. Scandinavian oil-platform retirements and German brownfield redevelopment reinforce steady business, while the EU taxonomy’s definition of “sustainable investment” now explicitly favors biological over chemical remediation. These drivers collectively uphold a diversified revenue base that shields the global bioremediation market from regional volatility.

Competitive Landscape
The market exhibits moderate fragmentation: global engineering majors such as AECOM, Clean Harbors, and Veolia dominate large infrastructure projects, yet niche biotechnology firms supply proprietary microbial consortia for specialized contaminants. Strategic partnerships are proliferating, with service integrators acquiring minority stakes in microbe-design startups to secure exclusive reagent access. Digital-twin software vendors are forming joint ventures with sensor manufacturers to bundle hardware, analytics, and biology into turnkey packages.
White-space exists where engineered microbes meet AI-based monitoring. Early movers such as Shimizu Corporation achieved 99% PFAS removal in pilot tests, positioning themselves for premium pricing in defense and semiconductor remediation. Investors reward firms capable of delivering verifiable outcome data, an advantage for those integrating cloud dashboards. Concurrently, low-cost regional consultancies leverage falling equipment prices to compete on execution speed in developing markets, exerting downward price pressure on commoditized hydrocarbon projects.
Overall, the top five players account for nearly 45% of global revenue, reflecting a balanced landscape that offers room for consolidation. Vendors that can certify environmental performance for ESG-linked bonds are likely to accelerate share gains, potentially lifting market-wide margins above historical averages over the forecast period.
Bioremediation Industry Leaders
AECOM
Clean Harbors
WSP-Golder
Tetra Tech
Veolia Environment
- *Disclaimer: Major Players sorted in no particular order


Recent Industry Developments
- May 2025: Arcadis secured a USD 1.5 billion contract with the U.S. Air Force for global environmental services emphasizing thermal in-situ sustainable remediation.
- August 2024: BQE Water won a mandate to design and supply a metals-treatment plant for a Yukon tailings-closure program.
- June 2024: Shimizu Corporation verified 99% PFAS removal in Texas lab testing, advancing toward commercial rollout.


Global Bioremediation Market Report Scope
| In-Situ Techniques | Biostimulation |
| Bioaugmentation | |
| Bioventing & Biosparging | |
| Ex-Situ Techniques | Landfarming |
| Biopiles & Composting | |
| Bioreactors |
| Petroleum Hydrocarbons |
| Heavy Metals |
| Pesticides & Agro-chemicals |
| Industrial Solvents & VOCs |
| PFAS & Emerging Contaminants |
| Oil & Gas (Upstream & Downstream) |
| Mining & Metallurgy |
| Industrial Manufacturing |
| Agriculture & Soil Health Services |
| Municipal Waste & Landfills |
| Biopharmaceutical Manufacturing Wastewater |
| Life-Science Research Labs & CRO Facilities |
| Medical Device & Diagnostics Production Effluents |
| Hospital & Clinical Trial Sites |
| Liquid Effluents |
| Solid Bio-process Waste |
| Airborne VOC Emissions |
| North America | United States |
| Canada | |
| Mexico | |
| Europe | Germany |
| United Kingdom | |
| France | |
| Italy | |
| Spain | |
| Rest of Europe | |
| Asia-Pacific | China |
| Japan | |
| India | |
| Australia | |
| South Korea | |
| Rest of Asia-Pacific | |
| Middle East and Africa | GCC |
| South Africa | |
| Rest of Middle East and Africa | |
| South America | Brazil |
| Argentina | |
| Rest of South America |
| By Technology | In-Situ Techniques | Biostimulation |
| Bioaugmentation | ||
| Bioventing & Biosparging | ||
| Ex-Situ Techniques | Landfarming | |
| Biopiles & Composting | ||
| Bioreactors | ||
| By Pollutant Type | Petroleum Hydrocarbons | |
| Heavy Metals | ||
| Pesticides & Agro-chemicals | ||
| Industrial Solvents & VOCs | ||
| PFAS & Emerging Contaminants | ||
| By Application / End-use Sector | Oil & Gas (Upstream & Downstream) | |
| Mining & Metallurgy | ||
| Industrial Manufacturing | ||
| Agriculture & Soil Health Services | ||
| Municipal Waste & Landfills | ||
| Biopharmaceutical Manufacturing Wastewater | ||
| Life-Science Research Labs & CRO Facilities | ||
| Medical Device & Diagnostics Production Effluents | ||
| Hospital & Clinical Trial Sites | ||
| By Medium | Liquid Effluents | |
| Solid Bio-process Waste | ||
| Airborne VOC Emissions | ||
| By Geography | North America | United States |
| Canada | ||
| Mexico | ||
| Europe | Germany | |
| United Kingdom | ||
| France | ||
| Italy | ||
| Spain | ||
| Rest of Europe | ||
| Asia-Pacific | China | |
| Japan | ||
| India | ||
| Australia | ||
| South Korea | ||
| Rest of Asia-Pacific | ||
| Middle East and Africa | GCC | |
| South Africa | ||
| Rest of Middle East and Africa | ||
| South America | Brazil | |
| Argentina | ||
| Rest of South America | ||


Key Questions Answered in the Report
What is the projected value of the bioremediation market in 2030?
The bioremediation market is forecast to reach USD 31.27 billion by 2030, reflecting a 10.22% CAGR between 2025 and 2030.
Which technology segment currently leads spending?
In-situ techniques lead with 54.34% revenue share because they treat contamination on site while avoiding soil excavation and transport.
Why is PFAS remediation gaining traction?
Regulatory mandates for near-zero PFAS discharge and emerging plant-based sorbents are driving a 13.39% CAGR for PFAS and other emerging contaminants.
Which region is growing fastest?
Asia-Pacific is expanding at a 12.79% CAGR, propelled by stricter industrial discharge rules and rising investment in biotechnology.
How are digital twins used in remediation projects?
Sensor networks feed real-time data into cloud-based models that predict microbial performance, helping operators optimize nutrient dosing and reduce monitoring costs.
What restrains adoption of gene-edited microbes?
Overlapping EPA, USDA, and FDA requirements extend approval timelines by up to five years, increasing development costs and delaying commercialization.
Page last updated on:


