
Biometrics-as-a-Service Market Size and Share
Market Overview
| Study Period | 2020 - 2031 |
|---|---|
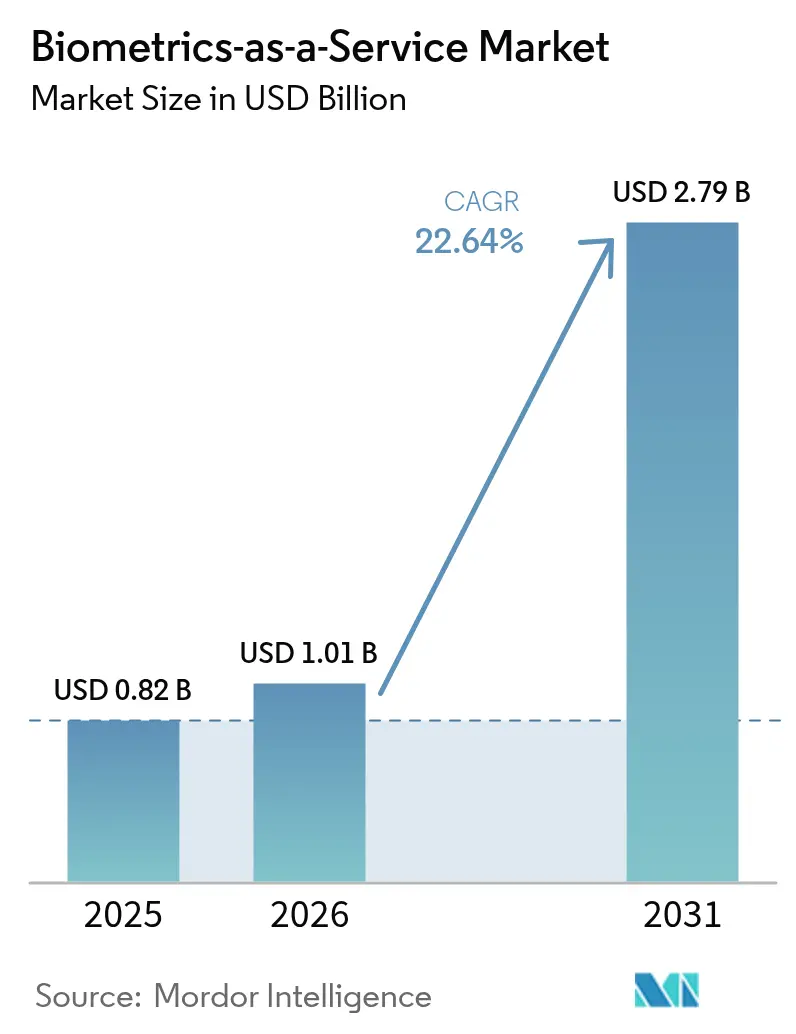
| Market Size (2026) | USD 1.01 Billion |
| Market Size (2031) | USD 2.79 Billion |
| Growth Rate (2026 - 2031) | 22.64 % |
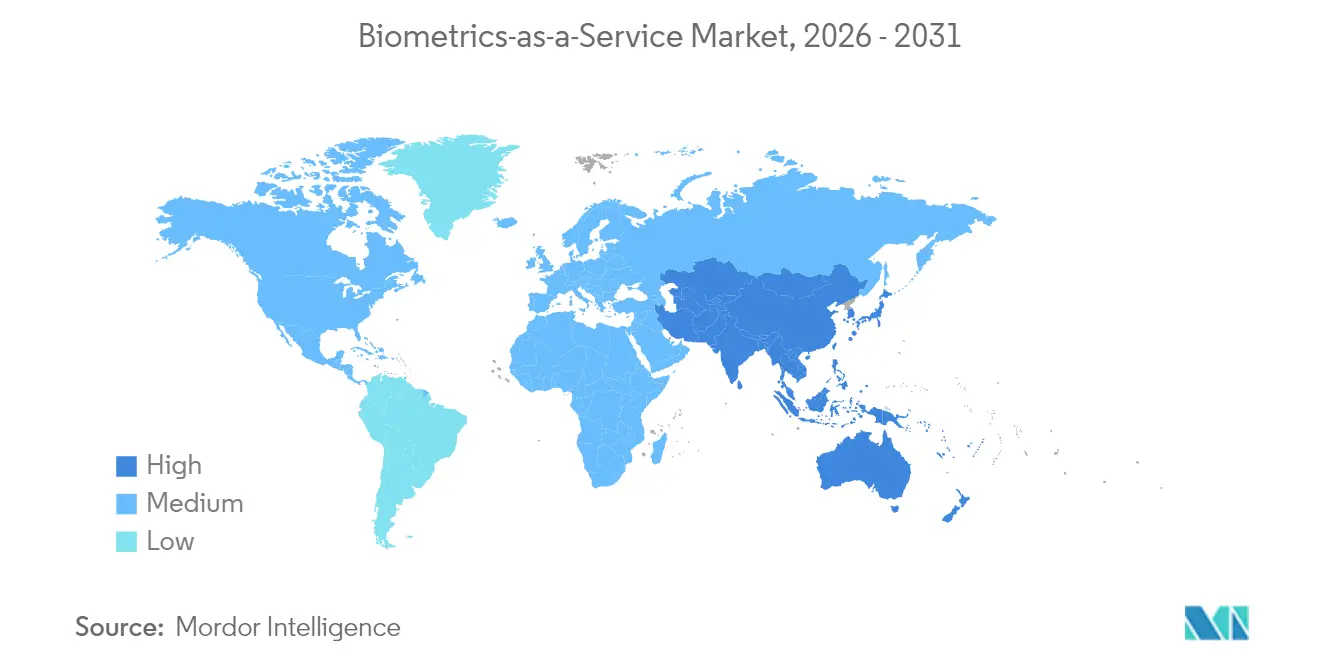
| Fastest Growing Market | Asia Pacific |
| Largest Market | North America |
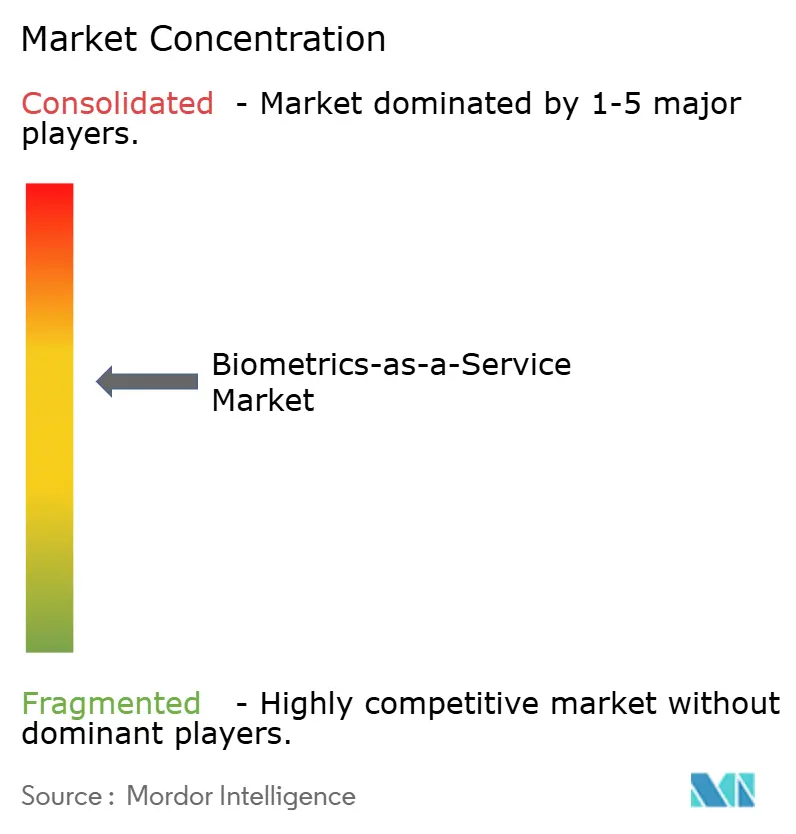
| Market Concentration | Medium |
Major Players *Disclaimer: Major Players sorted in no particular order Image © Mordor Intelligence. Reuse requires attribution under CC BY 4.0. | |
Biometrics-as-a-Service Market Analysis by Mordor Intelligence
The Biometrics-as-a-Service market size was valued at USD 0.82 billion in 2025 and estimated to grow from USD 1.01 billion in 2026 to reach USD 2.79 billion by 2031, at a CAGR of 22.64% during the forecast period (2026-2031). Momentum stems from enterprises shifting identity verification workloads to the cloud to trim on-premises infrastructure costs and to counter sophisticated fraud attempts.[1]Microsoft Corporation, “Microsoft Entra ID—Identity and Access Management,” microsoft.com Public-sector digital-ID programs across emerging economies, rising smartphone-native biometric adoption, and WebAuthn password-less rollouts further reinforce demand. Multimodal authentication advances, hyperscalers’ compliance certifications, and post-quantum encryption alignment are expanding commercial use cases. Meanwhile, regulatory pressure to detect deepfakes and mitigate bias is shaping solution roadmaps and regional deployment choices.
Key Report Takeaways
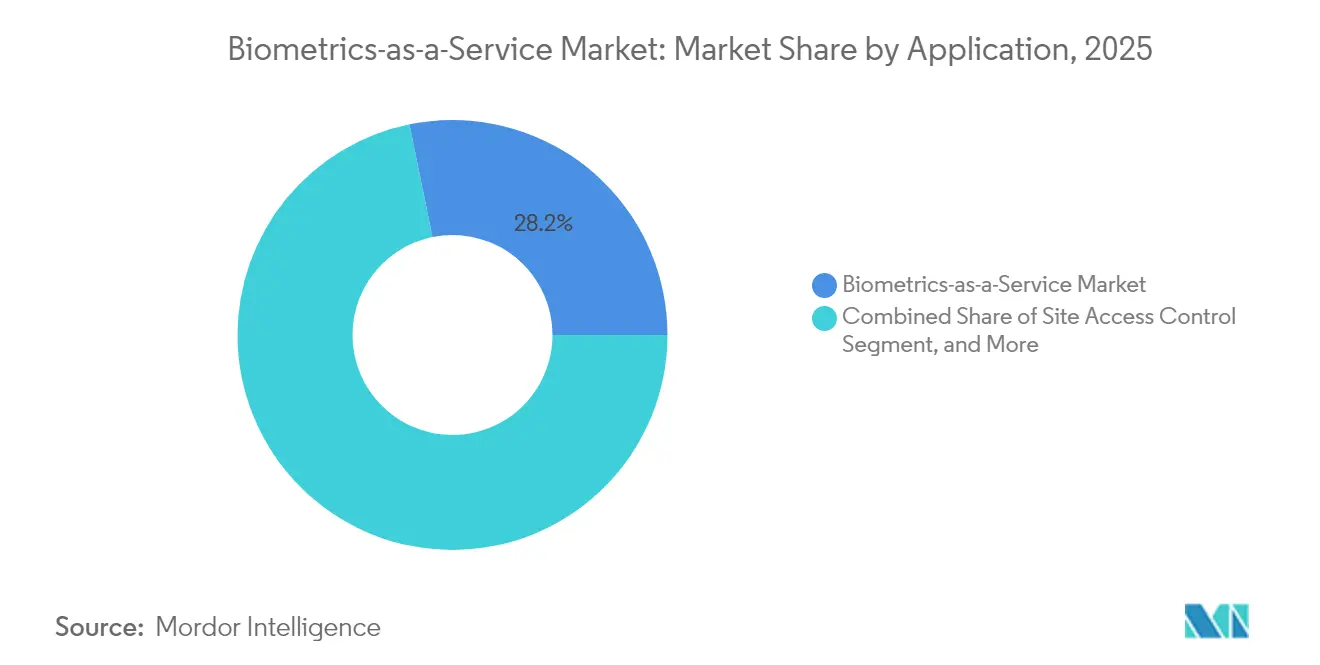
- By application, mobile authentication led with 28.21% revenue share in 2025 in the Biometrics-as-a-Service market; border and immigration control is projected to expand at a 22.96% CAGR through 2031.
- By biometric modality, fingerprint recognition held 31.12% Biometrics-as-a-Service market share in 2025, while multimodal solutions are growing at a 22.97% CAGR to 2031.
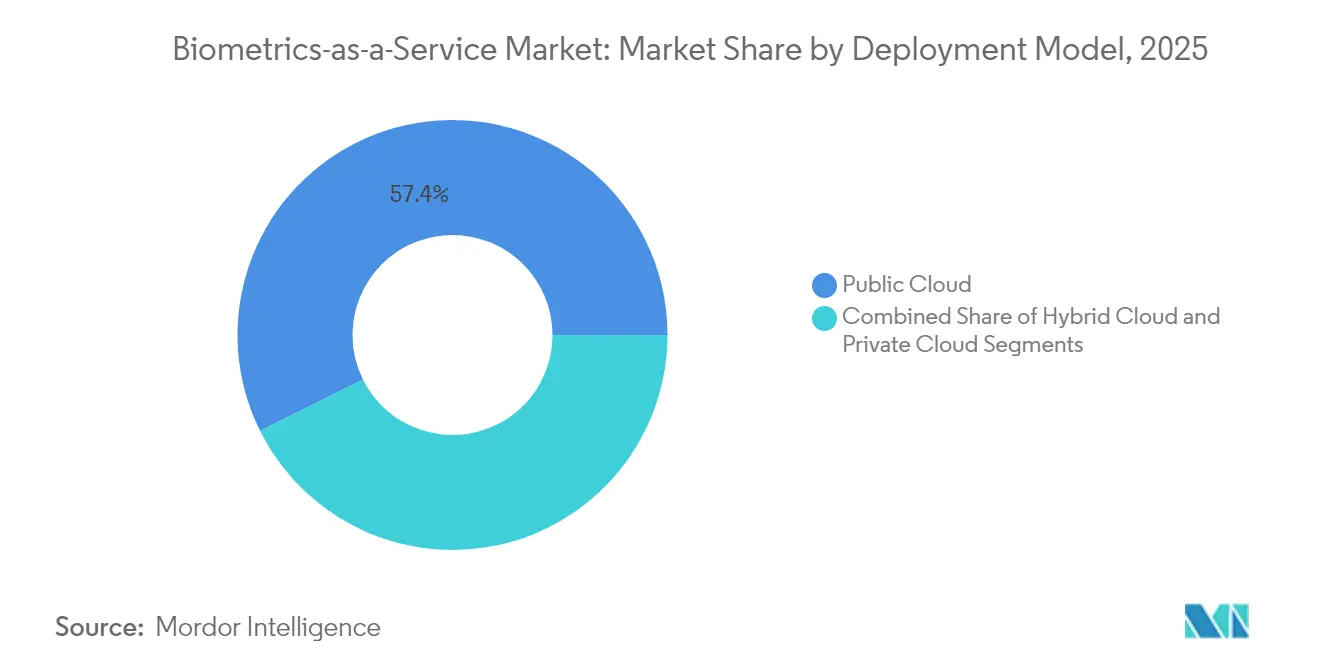
- By deployment model, public cloud accounted for 57.35% share of the Biometrics-as-a-Service market size in 2025 and hybrid cloud is advancing at a 23.41% CAGR through 2031.
- By end-user, government and public sector commanded 28.55% share of the Biometrics-as-a-Service market size in 2025, whereas BFSI is forecast to grow at a 23.09% CAGR to 2031.
- By geography, North America held 38.29% revenue share in 2025 in the Biometrics-as-a-Service market; Asia-Pacific is poised for a 23.06% CAGR between 2026 and 2031
Note: Market size and forecast figures in this report are generated using Mordor Intelligence’s proprietary estimation framework, updated with the latest available data and insights as of 2026.
Market Trends and Insights
Drivers Impact Analysis of Biometrics-as-a-Service Market*
| Driver | (~) % Impact on CAGR Forecast | Geographic Relevance | Impact Timeline |
|---|---|---|---|
| Rising volume and value of online transactions | +4.2% | Global, with concentration in APAC and North America | Medium term (2-4 years) |
| Explosion of deep-fake mitigation mandates | +3.8% | Global, led by EU and North America regulatory frameworks | Short term (≤ 2 years) |
| Cloud-native IAM suites embedding biometrics | +5.1% | North America and Europe, expanding to APAC | Medium term (2-4 years) |
| Post-quantum cryptography complementarity | +2.9% | Global, with early adoption in government and BFSI | Long term (≥ 4 years) |
| National digital-ID roll-outs (G2P and G2C) | +4.7% | APAC core, expanding to South America and Africa | Medium term (2-4 years) |
| WebAuthn-based password-less workspaces | +3.6% | North America and Europe enterprise markets | Short term (≤ 2 years) |
| Source: Mordor Intelligence | |||
Rising Volume and Value of Online Transactions
Digital payment volumes hit 1.86 trillion transactions in 2024, overwhelming password systems and elevating demand for cloud-scale biometric verification. Banks moving from on-premises biometrics to SaaS models report 67% lower authentication latency, enabling real-time fraud analytics. The Biometrics-as-a-Service market answers these scalability needs by auto-provisioning compute during transaction spikes. Lower latency also improves user experience, which lifts conversion rates for high-frequency mobile payments. As cross-border e-commerce expands, merchants prefer unified APIs that streamline KYC across jurisdictions, reinforcing market uptake.
Explosion of Deep-fake Mitigation Mandates
The EU AI Act compels financial institutions to deploy technical defenses against synthetic media by December 2025.[2]European Commission, “European Approach to Artificial Intelligence,” europa.eu Deepfake tools can create convincing facial videos from single images, challenging single-factor checks. Biometrics-as-a-Service market providers now bundle liveness detection that tracks micro-expressions, pupillary response, and voice harmonics harder to spoof. Continuous authentication during video calls or remote onboarding deters synthetic identity fraud. Compliance deadlines accelerate procurement cycles, while insurers increasingly require deepfake safeguards in cyber-risk policies, further stimulating adoption.
Cloud-native IAM Suites Embedding Biometrics
Microsoft Entra ID alone handled over 30 billion authentications per month in 2024, with biometrics constituting 43% of logins. IAM vendors embed biometric APIs into single sign-on flows, removing the need for separate infrastructure and trimming total cost of ownership. The integrated approach aligns user provisioning, MFA orchestration, and audit trails, giving CISOs centralized visibility. As more SaaS apps federate through SAML- or OIDC-based IdPs, the embedded biometric channel becomes the default. This convergence is expanding the Biometrics-as-a-Service market beyond traditional security budgets into broader digital-workplace initiatives.
Post-quantum Cryptography Complementarity
NIST finalized quantum-resistant algorithms in August 2024.[3]National Institute of Standards and Technology, “First Post-Quantum Encryption Standards,” nist.gov Enterprises pairing these protocols with biometric verification create layers that remain secure when quantum decryption becomes viable. Early trials in defense and capital-markets show hybrid models where a biometric check unlocks a quantum-safe private key, preserving zero-trust posture. Vendors are redesigning SDKs to sign biometric templates with lattice-based signatures, bolstering chain-of-custody. These innovations future-proof deployments and add a strategic dimension that differentiates full-service providers in the Biometrics-as-a-Service market.
Restraints Impact Analysis of Biometrics-as-a-Service Market*
| Restraint | (~) % Impact on CAGR Forecast | Geographic Relevance | Impact Timeline |
|---|---|---|---|
| Third-party cloud data-sovereignty concerns | -2.8% | Europe and APAC, driven by GDPR and local regulations | Medium term (2-4 years) |
| Bias and demographic performance gaps | -1.9% | Global, with heightened scrutiny in North America and EU | Long term (≥ 4 years) |
| Fragmented certification and liability regimes | -2.1% | Global, with varying standards across jurisdictions | Medium term (2-4 years) |
| Synthetic identity fraud arms-race | -1.6% | Global, concentrated in digital-first economies | Short term (≤ 2 years) |
| Source: Mordor Intelligence | |||
Third-party Cloud Data-sovereignty Concerns
The European Data Protection Board requires sensitive biometrics to stay within approved jurisdictions, complicating multi-region SaaS rollouts. Organizations often resort to regional clouds or edge appliances, inflating deployment complexity. Some governments ban outbound template transfers entirely, restricting federated identity projects. Vendors respond by offering country-specific shards and customer-managed encryption keys, but such controls raise cost, trimming Biometrics-as-a-Service market growth where sovereignty rules are strict.
Bias and Demographic Performance Gaps
Studies show facial recognition error rates vary up to 34% across demographic groups. Litigation risk plus upcoming algorithm-accountability laws in the U.S. and EU deter adoption in consumer-facing scenarios. Vendors invest in diverse datasets and bias dashboards, yet flawless parity remains elusive. Clients in regulated sectors may postpone rollouts until models improve, tempering Biometrics-as-a-Service market expansion in sensitive applications.
*Our forecasts treat driver/restraint impacts as directional, not additive. The impact forecasts reflect baseline growth, mix effects, and variable interactions.
Biometrics-as-a-Service Market Segment Analysis
By Application:
Mobile Authentication Extends Lead Amid Border Control SurgeMobile authentication accounted for 28.21% of the Biometrics-as-a-Service market in 2025 as smartphone sensors and WebAuthn turn devices into security tokens. Enterprises cite shorter login times and 73% fewer password resets after embedding device-native biometrics in MDM workflows. Consumers likewise accept fingerprint or facial unlock for fintech and e-commerce, translating into high daily transaction volumes. The Biometrics-as-a-Service market benefits because service providers manage sensor heterogeneity, firmware updates, and liveness checks through a single cloud endpoint.
Border and immigration control is the fastest-rising subsegment, set for a 22.96% CAGR through 2031 as governments automate entry/exit systems. Cloud orchestration simplifies scalability for airports handling seasonal passenger peaks, while edge caching keeps processing within sovereign zones. Vendors now bundle multimodal capture kiosks with SaaS back-ends, reducing procurement cycles. The interplay of security mandates and traveler experience goals ensures sustained spending, with growth particularly strong in Asia-Pacific smart-airport projects.



By Biometric Modality:
Multimodal Solutions Gain Traction for Anti-spoofingFingerprint technology held a 31.12% Biometrics-as-a-Service market share in 2025 thanks to mature sensors, ISO template standards, and entrenched user familiarity. Large installed bases in mobile devices and ATMs keep capture costs low, ensuring ongoing volume. Yet synthetic fingerprints and silicone molds raise spoofing risk. Providers therefore pair fingerprints with passive facial or voice checks, increasing assurance without noticeable friction.
Multimodal systems will expand at a 22.97% CAGR as enterprises seek defense-in-depth against deepfakes. SaaS platforms unify risk scoring across face, voice, and behavioral signals, enabling adaptive MFA. Machine-learning ensembles weigh modalities based on context, improving throughput for low-risk events and stepping up scrutiny where anomalies surface. This balance of security and UX is propelling multimodal adoption across BFSI, healthcare, and remote-work use cases, further enlarging the Biometrics-as-a-Service market.
By Deployment Model:
Hybrid Cloud Blends Sovereignty with ElasticityPublic clouds captured 57.35% of the market in 2025, reflecting hyperscalers’ ISO 27001 certifications, hardware HSMs, and privacy tooling. Enterprises leverage serverless architectures that ingest biometric payloads, run ML inferences, and return verdicts within 300 milliseconds. Pricing aligns to volume, lowering barriers for mid-tier customers entering the Biometrics-as-a-Service market.
Hybrid models are surging at a 23.41% CAGR as data-protection rules tighten. Organizations store templates on-premises or in private clouds while calling public endpoints for inference during peak loads. Containerized inference engines allow “bring-your-own-compute” on edge clusters in regulated zones. This duality preserves data control and auditability yet scales elastically, making hybrid the preferred blueprint for new government tenders and multinational rollouts.
By End-user Industry:
Government Validation Spurs Commercial UptakeGovernment and public agencies claimed 28.55% of 2025 spending, driven by national-ID, border security, and welfare disbursement programs. State validation builds population-level familiarity, lowering resistance when banks and telcos deploy similar flows. Multi-agency frameworks further reduce duplication by sharing biometric back-ends across departments, reinforcing vendor lock-in and recurring SaaS revenue.
BFSI spend is climbing at 23.09% CAGR as regulators enforce strong customer authentication. Banks integrate biometrics with risk-based transaction analysis, throttling challenges for trusted sessions and escalating for high-value transfers. Insurers deploy voice-print IVRs to cut call-center fraud and improve average handle time. Healthcare, retail, and travel verticals follow suit, seeking patient ID accuracy, card-not-present fraud reduction, and frictionless guest experiences, respectively, enlarging the Biometrics-as-a-Service industry footprint.
Geography Analysis
North America Biometrics-as-a-Service Market
North America dominated the Biometrics-as-a-Service market with a 38.29% share in 2025, underpinned by cloud maturity, venture funding, and clear biometric privacy statutes. Federal programs such as the U.S. biometric entry-exit system handle over 400 million annual verifications, stress-testing SaaS scalability. Canadian interoperability pilots link provincial services to a national wallet, while Mexican financial inclusion drives biometric onboarding of the previously unbanked. Together these dynamics ensure robust contract renewals and upsells.
APAC Biometrics-as-a-Service Market
Asia-Pacific is the fastest-advancing region, forecast at a 23.06% CAGR to 2031. National digital-ID schemes from India’s Aadhaar extensions to Singapore’s Singpass normalize biometric logins, stimulating cross-sector adoption. Japan’s My Number card expansion into healthcare and social security increases daily verification volume, while China’s mobile-payment ecosystem fuels behavioral biometrics innovation. ASEAN’s effort to harmonize trust-frameworks could unlock cross-border verification, enlarging the addressable Biometrics-as-a-Service market.
EMEA Biometrics-as-a-Service Market
Europe shows steady but regulation-heavy growth. GDPR and the forthcoming AI Act impose algorithmic transparency, favoring providers with bias-mitigation credentials. Automotive OEMs employ in-cabin facial and iris recognition for personalization. Industrial firms deploy palm-vein stations for shop-floor access, citing hygiene and gloves compatibility. Meanwhile, the Middle East and Africa see early-stage pilots in digital banking and border management. Data-residency clauses often necessitate local hosting partners, shaping go-to-market strategies.

Regulatory Landscape
Biometrics-as-a-Service deployments are being shaped by converging AI governance, biometric data protection, and interoperability standards. In the European Union, the AI Act (Regulation (EU) 2024/1689) becomes fully applicable on August 2, 2026, and many biometric identification uses fall into a high-risk category with requirements around risk management, logging, accuracy, and human oversight. This, in turn, affects provider documentation, auditability, and customer procurement checklists.
Standards updates are also tightening technical baselines for cross-organization exchange and security evaluation. ISO/IEC 19792:2025 formalizes principles for security evaluation of biometric systems, while NIST published ANSI/NIST-ITL 1-2025 (SP 500-290e4) for biometric data interchange (including newer capture formats), requiring Baas vendors and integrators to maintain format compatibility across border, law-enforcement, and enterprise identity workflows. In the United States, USCIS rulemaking on the collection and use of biometrics also signals continued expansion of biometric collection scope in immigration-related processes.
Value Chain Analysis
The value chain runs from sensor and capture-device ecosystems, including mobile OEM sensors as well as kiosk and gate hardware, to biometric algorithm and SDK developers covering face, fingerprint, iris, voice, behavioral, and liveness. Cloud delivery layers then expose APIs for enrollment, matching, and risk scoring. Hyperscalers and identity platforms act as orchestration and distribution points, embedding biometrics into IAM and customer identity workflows, while specialist biometrics firms package modality engines, liveness, and template protection into SaaS offerings for regulated buyers.
Downstream, systems integrators and managed service providers operationalize deployments for government, BFSI, and travel use cases. They handle integration into IdPs, KYC stacks, and border or airport systems, along with ongoing monitoring and compliance reporting. Partnerships reflect this chain: Fingerprint Cards AB and Anonybit partnered (December 2024) to build privacy-centric enterprise authentication, and then integrated with Ping Identity PingOne DaVinci (April 2025). This illustrates how biometric IP is increasingly commercialized through identity-orchestration marketplaces. BIO-keys partnership with VaporVM (November 2025) also highlights the role of regional delivery and support layers in scaling deployments across the Middle East and Africa.
Competitive Landscape
The Biometrics-as-a-Service market is moderately concentrated, with identity giants, device OEMs, and cloud hyperscalers converging. Microsoft, Amazon, and Google embed biometric APIs into IAM suites, leveraging subscription footprints for rapid adoption. Specialized vendors such as NEC and IDEMIA deepen multimodal R&D and pursue government tenders where accuracy and sovereignty outweigh price.
M&A remains active: Thales’ 2025 acquisition of a liveness-detection start-up for USD 340 million augments anti-spoofing depth. NEC’s multimodal SaaS launch targets hybrid-work authentication, while Fujitsu markets palm-vein services to healthcare providers seeking contactless patient-ID. Edge inference and client-side template encryption differentiate emerging players attacking data-sovereignty pain points.
Partnerships flourish around standards. Ping Identity secured SOC 2 Type II for its biometric cloud, courting regulated enterprises. Daon’s FIDO Alliance certification signals password-less alignment. Suprema’s mobile SDK accelerates developer integration, reinforcing network effects. Competitive intensity revolves around template-less architectures, API richness, and global customer-support footprints, factors that will shape vendor rankings through 2030.
Biometrics-as-a-Service Industry Leaders
M2SYS Technology - KernellÓ Inc.
Fujitsu Limited
NEC Corporation
Thales Group (Gemalto NV)
Leidos Holdings Inc.
- *Disclaimer: Major Players sorted in no particular order
Biometrics-as-a-Service Market Companies Covered in this Report
- Thales Group
- IDEMIA France SAS
- NEC Corporation
- Fujitsu Limited
- Leidos Holdings Inc.
- Aware Inc.
- ImageWare Systems Inc.
- BIO-key International Inc.
- M2SYS Technology (Kernel LLC)
- Mobbeel Solutions S.L.L.
- BioEnable Technologies Pvt Ltd.
- Clearview AI Inc.
- HID Global Corporation
- Suprema Inc.
- Veridium IP Ltd.
- Cognitec Systems GmbH
- Precise Biometrics AB
- Daon Inc.
- Microsoft Corporation
- Amazon Web Services Inc.
- Google LLC (Google Cloud)
- Ping Identity Holding Corp.
- LexisNexis Risk Solutions Inc.

Market Opportunities and Future Outlook
Interoperability and assurance standards are creating whitespace for API-first vendors that can plug into heterogeneous identity and security stacks without bespoke integration. ISO/IEC 30108-1:2026 for biometric services within service-based frameworks and the ANSI/NIST-ITL 1-2025 data interchange update by NIST support procurement language that prioritizes standard-aligned data structures, repeatable audit trails, and modality portability across border control, law-enforcement, and enterprise IAM deployments. This expands opportunities for vendors that can certify and operationalize these requirements across regions.
New workload categories are also emerging at the intersection of biometrics, passkeys, and autonomous or delegated transactions. The FIDO Alliance formed an Agentic Authentication Technical Working Group (April 2026), and Mastercard and Google introduced a Verifiable Intent framework aligned with FIDO concepts, indicating product opportunities for Baas providers to support continuous, high-assurance user verification and liveness under machine-mediated transaction flows. Adjacent standardization in cloud security ecosystems, such as ONVIF Profile V for cloud-based video surveillance (July 2026), supports vendor-neutral integrations where biometric analytics and identity signals can be operationalized within broader cloud security and surveillance architectures.
Recent Industry Developments in Biometrics-as-a-Service Market
- April 2026: Leidos advanced airport checkpoint modernization efforts by aligning biometric-enabled eGates and credential authentication workflows with an industrial security screening push tied to its Analogic-related joint venture activity. This strengthens Leidos positioning in end-to-end airport security programs where biometrics are integrated with screening hardware and operational software, expanding routes to large multi-airport deployments.
- November 2025: BIO-keys partnered with VaporVM to deliver regional biometric delivery and support layers in scaling deployments across the Middle East and Africa. The partnership signals expansion of local capability and service coverage for enterprise and government programs.
- December 2024: Amazon Web Services released biometric authentication APIs for third-party developers. By lowering integration friction through cloud-native interfaces, the release broadened access to biometric capabilities for application teams and accelerated marketplace-style distribution of biometric authentication components.


Biometrics-as-a-Service Market Report Scope and Research Methodology
Market Definition and Coverage
This market covers revenues from cloud-delivered biometric enrollment, matching, and authentication that are sold on a subscription or usage basis, where the biometric service is hosted and managed by the provider. We count spending tied to biometric software services and the supporting service layer required to run these workflows.
Scope exclusions: We exclude on-premise biometric deployments that are licensed and operated mainly within the customer environment, as well as general identity tools that do not provide biometric matching as a service.
Segments Covered in This Report
- By Application
- Site Access Control
- Time and Attendance Recording
- Mobile Authentication
- Web and Workplace Login
- e-Payments and Transaction Authentication
- Border and Immigration Control
- Law-Enforcement and Surveillance
- Other Applications
- By Biometric Modality
- Fingerprint Recognition
- Multi-fingerprint Fusion
- Facial Recognition
- Iris Recognition
- Palm and Vein Recognition
- Voice Recognition
- Behavioural Biometrics
- Multimodal Biometrics
- Other Modalities
- By Deployment Model
- Public Cloud
- Private Cloud
- Hybrid Cloud
- By End-user Industry
- Government and Public Sector
- BFSI
- Healthcare
- Retail and E-commerce
- IT and Telecom
- Travel and Hospitality
- Education
- Other End-user Industries
- By Geography
- North America
- United States
- Canada
- Mexico
- South America
- Brazil
- Argentina
- Rest of South America
- Europe
- United Kingdom
- Germany
- France
- Italy
- Spain
- Netherlands
- Rest of Europe
- Asia-Pacific
- China
- Japan
- South Korea
- India
- ASEAN
- Rest of Asia-Pacific
- Middle East and Africa
- Middle East
- Saudi Arabia
- United Arab Emirates
- Turkey
- Rest of Middle East
- Africa
- South Africa
- Nigeria
- Kenya
- Rest of Africa
- Middle East
- North America
Data Sources, Market Sizing, and Validation
Desk Research
Desk work starts by mapping what buyers purchase under biometrics as a service, and then linking it to measurable demand signals in identity verification and digital access. For grounding, we referenced public sources such as NIST biometric evaluations, ISO and IEC standards for biometric data interchange, U.S. FCC and FTC notices that influence consent and authentication practices, and the World Bank and OECD data that helps explain digital adoption patterns.
We also reviewed company filings, earnings decks, product documentation, and reputable press to understand packaging (API usage pricing versus subscription tiers) and adoption timing by end users. To reduce gaps in private company visibility, we supplemented with paid subscriptions focused on company financials and intelligence, patent databases, and general news and financials, which supported cross-checks on product breadth and investment signals. These examples are not exhaustive, and many other public and paid sources were used for data collection, validation, and clarification.
Primary Interviews and Surveys
Primary inputs were gathered from cloud security teams, digital identity owners, integrators, and product leaders who sell or deploy biometric APIs, with coverage across APAC, EMEA, and the Americas to reflect privacy and procurement differences. The interviews helped confirm what buyers count as BaaS spend, validate adoption timing by vertical, and test assumptions such as active verification volumes, re-verification frequency, and pricing movement over time.
Distribution of primary research fieldwork respondents
| Company type | Respondent position | Region |
|---|---|---|
| Top tier: 35% | CXOs: 12% | APAC: 42% |
| Mid tier: 45% | Functional/Unit leaders: 29% | EMEA: 32% |
| Smaller Players: 20% | Managers: 59% | Americas: 26% |
Market-Sizing & Forecasting
The core model starts with a top-down demand pool build that links digital onboarding and authentication activity to the share that uses biometric checks, and then converts that activity into revenue using typical pricing structures. To keep totals realistic, selective bottom-up checks are used, such as sampling published price ranges, mapping likely volumes by use case, and comparing implied revenue per deployed customer against what interviews describe.
Inputs used in the model include, for example, cloud adoption and identity verification penetration by industry, the modality mix used in production (fingerprint, face, voice, iris), active verification volumes and re-verification frequency, average price per authentication or per enrolled identity, and regional compliance drag where consent and data residency rules are strict. When a direct number is not available, gaps are handled through proxies like digital transaction growth, device capability trends, and changes in provider packaging, which are then reviewed with experts for realism. Forecasts are built using scenario analysis that is anchored on adoption drivers and restraint factors, and then tuned where interview feedback points to faster or slower rollouts.
Data Validation & Update Cycle
Outputs are checked against independent signals such as cloud security spend direction, published authentication traffic indicators, and the implied revenue intensity per active customer, and then outliers are investigated before totals are finalized. If a region or use case shows unusual jumps, we re-check pricing assumptions, penetration rates, and currency conversions, and then complete a second review with another analyst.
The report is refreshed annually, and interim updates are made when material events occur, such as major regulatory shifts, sharp pricing moves, or sudden demand shocks in digital onboarding. Before delivery, a final verification pass is completed so clients receive the latest view that matches the most current inputs available.
Mordor Intelligence's Biometrics As A Service Market Size Compared With Other Published Estimates
Published market sizes for biometrics as a service can look far apart, even when similar wording is used, because the underlying scope and revenue counting rules are not aligned across sources. Differences usually come from whether adjacent identity categories are blended in, how usage-based pricing is annualized, and whether estimates are anchored to deployment activity or to broad IT spend ratios.
Hardware scanners and capture devices sit outside Mordor Intelligence's scope for this market, which removes a pool of one-time equipment revenue that some sources may mix into BaaS totals. Gaps also appear when models assume fast jumps in biometric transaction volumes without validating re-verification frequency, or when one global ASP trend is applied without separating regulated markets from faster-moving regions.
Benchmark comparison
| Source | Market Size | Gaps in Research Methodology |
|---|---|---|
| Mordor Intelligence | USD 1.01 B (2026) | |
| Industry Research Publisher A | USD 2.85 B (2025) | May reflect a wider identity and access stack that can blend device and platform revenues into the service figure, and it can rely on vendor revenue groupings that are not limited to hosted biometric matching. |
| Advisory Firm B | USD 0.84 B (2025) | Can stay conservative by using slower enterprise rollout assumptions and heavier price smoothing, which may understate usage-based growth where verification volumes scale quickly. |
Across the table, the spread is mainly explained by what is counted as service revenue versus adjacent identity and device spending, and by how transaction volumes and pricing are translated into annual totals. Our checks keep the figure traceable to clear inputs, and the same steps can be repeated as new adoption signals emerge.


Key Questions Answered in the Report
What is the projected value of the Biometrics-as-a-Service market in 2031?
The Biometrics-as-a-Service market is expected to reach USD 2.79 billion by 2031.
Which application currently leads spending?
Mobile authentication leads spending, holding 28.21% share in 2025.
Why are hybrid deployments gaining popularity?
Hybrid models balance data sovereignty with cloud scalability, growing at a 23.41% CAGR.
Which region will grow fastest through 2031?
Asia-Pacific is forecast to register the quickest expansion at a 23.06% CAGR.
How are deepfakes influencing adoption?
Regulatory mandates to detect synthetic media are pushing enterprises toward multimodal biometrics with liveness detection.
Page last updated on:





