
Bioanalytical Testing Services Market Size and Share
Market Overview
| Study Period | 2020 - 2031 |
|---|---|
| Market Size (2026) | USD 4.68 Billion |
| Market Size (2031) | USD 7.23 Billion |
| Growth Rate (2026 - 2031) | 9.08 % |
| Fastest Growing Market | Asia-Pacific |
| Largest Market | North America |
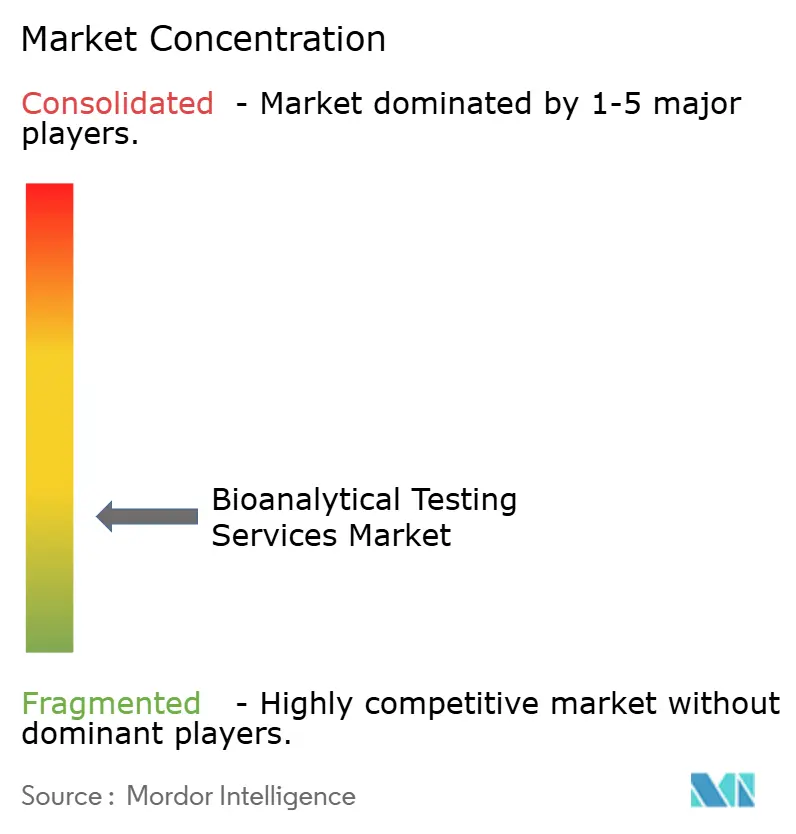
| Market Concentration | Low |
Major Players *Disclaimer: Major Players sorted in no particular order Image © Mordor Intelligence. Reuse requires attribution under CC BY 4.0. | |
Bioanalytical Testing Services Market Analysis by Mordor Intelligence
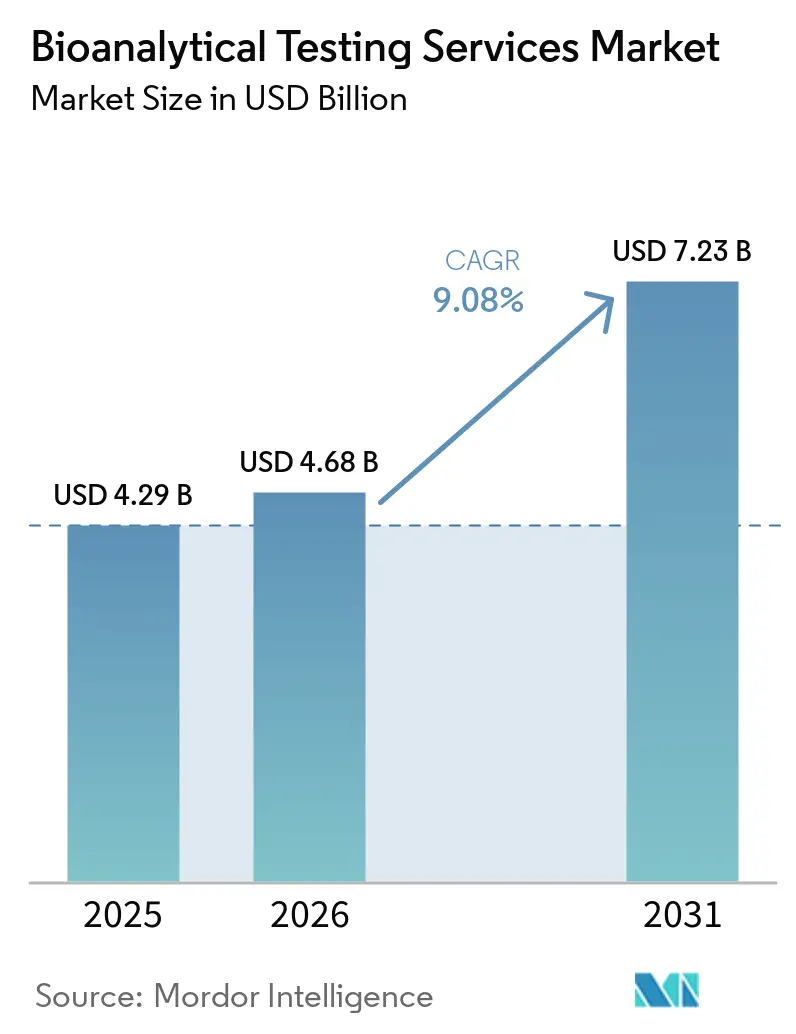
Bioanalytical Testing Services market size in 2026 is estimated at USD 4.68 billion, growing from 2025 value of USD 4.29 billion with 2031 projections showing USD 7.23 billion, growing at 9.08% CAGR over 2026-2031.
The acceleration reflects the sector’s transition from a support function to a strategic driver of precision-medicine programs, regulatory filings, and faster drug-development cycles. Outsourcing now underpins more than 50% of clinical study analytics as sponsors trim fixed laboratories and lean on specialist contract research organizations (CROs) for high-throughput capacity. Biologics, biosimilars, and complex modalities demand high-resolution instrumentation that few sponsors keep in-house, prompting multiyear service contracts for ligand-binding assays, high-resolution mass spectrometry, and immunogenicity testing. Meanwhile, the global push toward harmonized guidelines such as ICH M10 is encouraging a uniform validation approach that reduces repeat testing while simultaneously raising the technical bar for laboratories. Supply-chain disruptions during the COVID-19 pandemic further reinforced outsourcing decisions and hastened adoption of automated platforms that cut assay turn-around times.
Key Report Takeaways
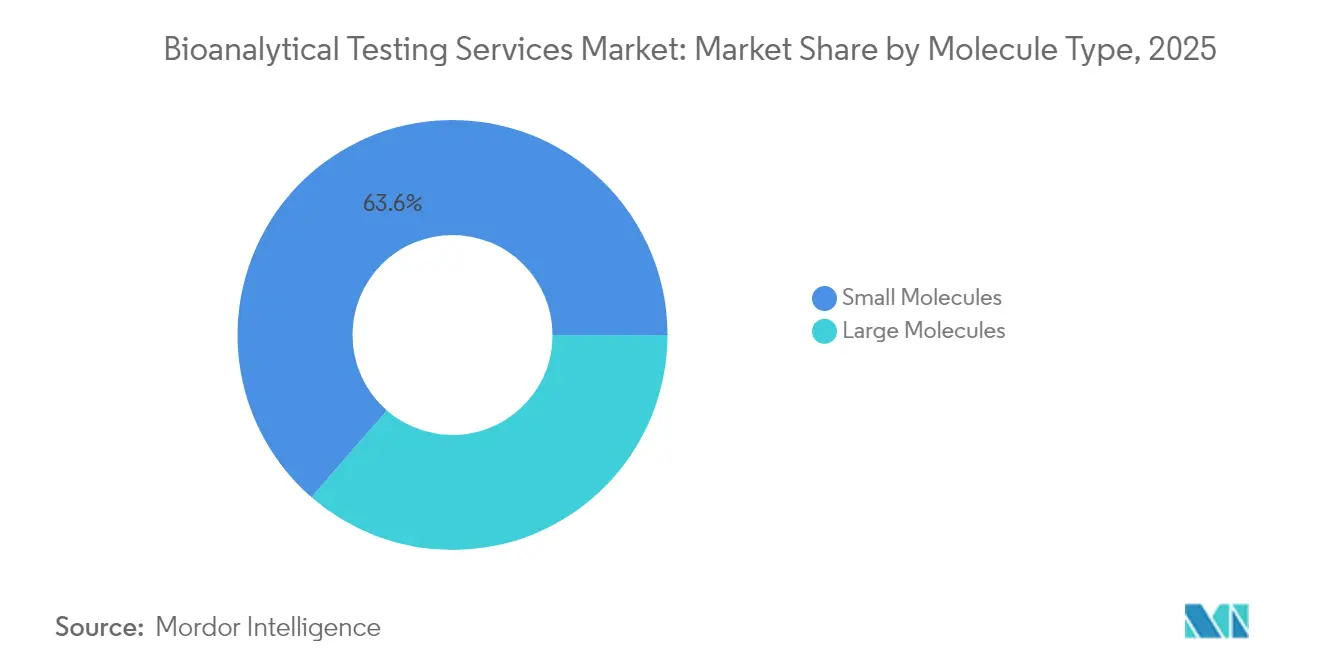
- By molecule type, small molecules retained 63.62% of the bioanalytical testing services market share in 2025, while large molecules are forecast to post an 11.12% CAGR through 2031.
- By test type, bioavailability and bioequivalence held 36.10% revenue share in 2025; biomarker assays are projected to expand at a 12.31% CAGR to 2031.
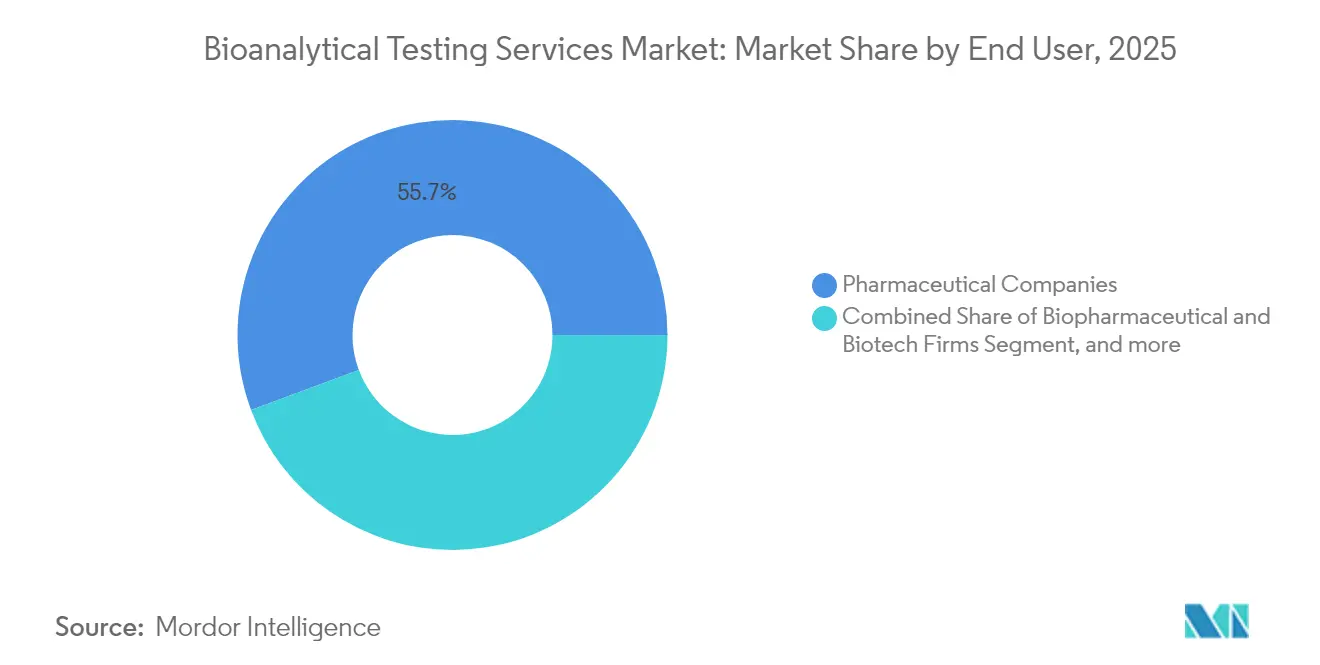
- By end user, pharmaceutical companies commanded 55.68% share of the bioanalytical testing services market size in 2025, whereas CDMOs are on course for a 13.03% CAGR between 2026-2031.
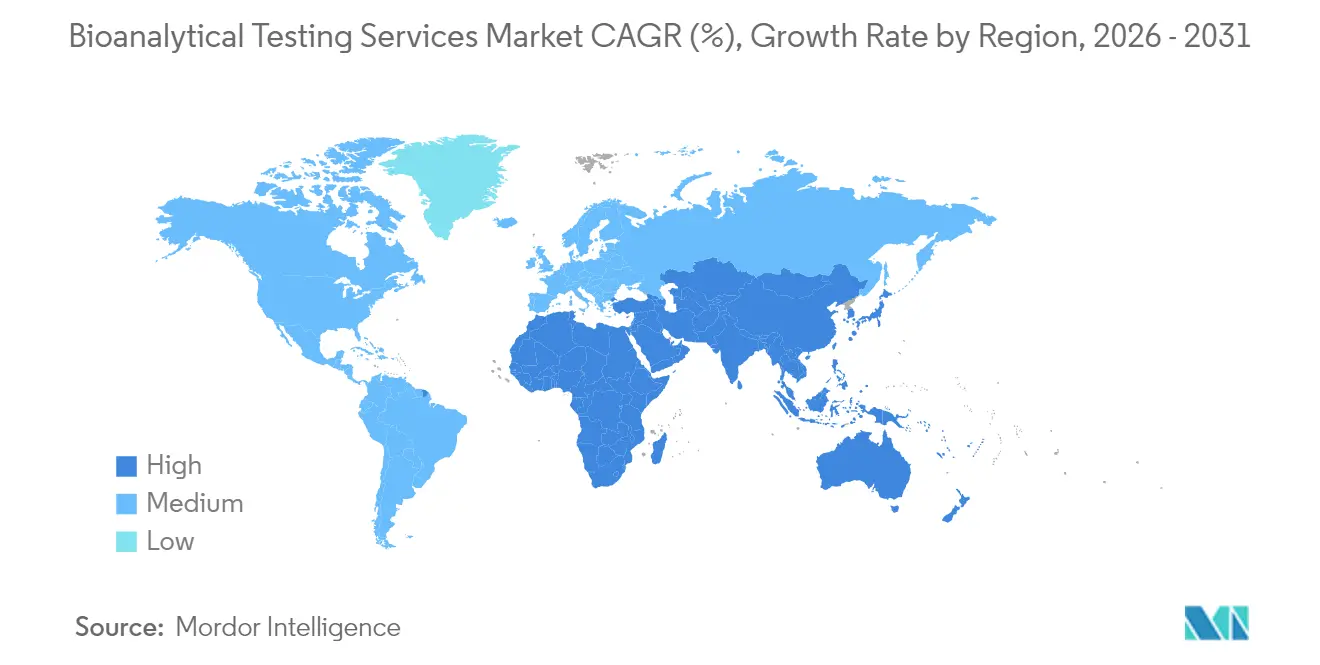
- By geography, North America led with 41.92% revenue share in 2025; Asia-Pacific is set to grow at 11.74% CAGR through 2031.
Note: Market size and forecast figures in this report are generated using Mordor Intelligence’s proprietary estimation framework, updated with the latest available data and insights as of 2026.
Market Trends and Insights
Drivers Impact Analysis of Bioanalytical Testing Services Market*
| Driver | (~)% Impact on CAGR Forecast | Geographic Relevance | Impact Timeline |
|---|---|---|---|
| Rising Outsourcing of Analytical Testing | +2.1% | Global, with North America & EU leading adoption | Medium term (2-4 years) |
| Expansion of Biologics & Biosimilars Pipeline | +1.8% | Global, concentrated in US, EU, and emerging APAC markets | Long term (≥ 4 years) |
| Growing Global Clinical-Trial Volumes | +1.5% | APAC core, spill-over to MEA and Latin America | Medium term (2-4 years) |
| Stringent PK/PD & BE Regulatory Mandates | +1.2% | Global, with harmonization across FDA, EMA, and PMDA | Long term (≥ 4 years) |
| Adoption of Microsampling & DBS in Decentralized Trials | +0.9% | North America & EU, expanding to APAC | Short term (≤ 2 years) |
| AI-Driven Analytics Cutting Assay Turnaround Time | +0.7% | Global, with early adoption in developed markets | Short term (≤ 2 years) |
| Source: Mordor Intelligence | |||
Rising outsourcing of analytical testing
Pharmaceutical sponsors are reallocating capital from fixed laboratories to flexible, tech-enabled partnerships, lifting outsourcing penetration to unprecedented levels. Biologics workflows requiring sub-ppm impurity detection and multiplex ligand-binding assays now sit almost entirely with CROs. Pandemic restrictions intensified the shift as in-house labs shut down while CRO networks stayed operational through disaster-recovery protocols.[1]PMC Authors, “COVID-19 Impact on Laboratory Outsourcing,” ncbi.nlm.nih.gov Access to high-resolution mass spectrometers costing USD 500,000 per unit and automated sample-preparation robots remains a decisive factor for smaller biotech firms seeking rapid data readouts.
Expansion of biologics & biosimilars pipeline
Large-molecule approvals comprised 46% of FDA clearances in 2025, propelled by monoclonal antibodies, fusion proteins, and antibody-drug conjugates that require orthogonal assays to evaluate potency, glycosylation, and host-cell-protein content. [2]ACM Global Laboratories, “Large-Molecule Analysis Trends,” acmgloballabs.com Over 240 biosimilars are in active development, reinforcing demand for comparative analytics that focus on molecular similarity rather than expensive efficacy trials. Regulators such as the UK MHRA signal readiness to waive certain efficacy studies when analytical evidence is compelling, accelerating uptake of advanced biophysical techniques and multivariate statistics.
Growing global clinical-trial volumes
Asia-Pacific investigators logged double-digit trial growth as sponsors pursued cost-efficient enrollment, ethnically diverse cohorts, and streamlined approvals in South Korea, Taiwan, and Japan. CROs such as Novotech now process roughly 34,000 samples per month across new APAC facilities, feeding regional demand for PK, PD, and immunogenicity assays. Western geopolitical uncertainties, capacity bottlenecks, and inflationary pressures further motivate trial migration eastward.
Stringent PK/PD & BE regulatory mandates
ICH M10 harmonizes validation templates yet introduces cross-validation and parallelism checks that stretch existing quality-management systems. The FDA’s 2024 draft guidance on data integrity mandates risk-based electronic records and expands audit-trail scrutiny, prompting investments in laboratory information-management software and robotic data review pipelines able to cut manual steps by up to 86%.[3]Federal Register, “Data Integrity in Bioequivalence Studies,” federalregister.gov Labs with global submissions must now navigate differing thresholds for highly variable drugs, NTI compounds, and microsampling protocols, adding overhead to multinational projects.
Restraints Impact Analysis of Bioanalytical Testing Services Market*
| Restraint | (~) % Impact on CAGR Forecast | Geographic Relevance | Impact Timeline |
|---|---|---|---|
| Complex & Rapidly-Evolving Global Regulations | -1.4% | Global, with particular complexity in FDA-EMA harmonization | Long term (≥ 4 years) |
| Shortage of Skilled Bioanalytical Scientists | -0.9% | North America & EU primarily, emerging in APAC | Medium term (2-4 years) |
| High Capex for HR-Mass-Spectrometry Platforms | -0.7% | Global, with higher impact on smaller laboratories | Medium term (2-4 years) |
| Sample-Integrity Risks in At-Home Collections | -0.5% | North America & EU leading decentralized trials | Short term (≤ 2 years) |
| Source: Mordor Intelligence | |||
Complex & rapidly-evolving global regulations
Differing regional expectations continue to generate multi-protocol validation plans, inflating development budgets by 15-20%. Potential FDA oversight of laboratory-developed tests (LDTs) will pull clinical labs into drug-style GMP systems, demanding capital upgrades in documentation, change control, and data-integrity architecture. Smaller providers lacking embedded regulatory teams face competitive headwinds as compliance overhead rises.
Shortage of skilled bioanalytical scientists
High-resolution mass-spectrometry, data science, and regulatory affairs skills remain scarce, as academic programs lag industry technology cycles. Pandemic-era lab closures curtailed hands-on training for new graduates, widening the expertise gap. Some providers counter with “dark labs” deploying robotics and AI to deliver 24-hour throughput with minimal human intervention.
*Our forecasts treat driver/restraint impacts as directional, not additive. The impact forecasts reflect baseline growth, mix effects, and variable interactions.
Bioanalytical Testing Services Market Segment Analysis
By Molecule Type:
Large Molecules Drive InnovationLarge molecule bioanalytical testing services generated rapid momentum, even though small molecules still held 63.62% of the bioanalytical testing services market share in 2025. The large-molecule segment is expanding at an 11.12% CAGR due to monoclonal antibodies, fusion proteins, and peptide therapeutics that necessitate ligand-binding assays, cell-based potency tests, and immunogenicity evaluations. This demand compels laboratories to install high-throughput Gyrolab immunoassay platforms and multi-attribute-method mass-spectrometry workflows that identify structural variants within minutes.
Investment intensity continues to rise. WuXi AppTec, for example, lifted peptide-manufacturing capacity to 32,000 L of solid-phase synthesis reactors, underpinning a surge in comparative analytical requests from biosimilar developers. Sponsors favor analytical similarity packages over long efficacy studies, pushing advanced orthogonal techniques into routine service. As the pipeline diversifies, the bioanalytical testing services market will rely heavily on cross-disciplinary skillsets spanning biochemistry, statistics, and automation to match rising complexity.



By Test Type:
Biomarker Assays Lead InnovationBioavailability and bioequivalence work accounted for 36.10% revenue in 2025, safeguarding regulatory compliance for generics. Yet, biomarker assays headline growth with a 12.31% CAGR, mirroring precision-medicine strategies that appear in more than 40% of recent FDA approvals. Sponsors increasingly request multi-omics panels that combine proteomics, metabolomics, and lipidomics to stratify patients, a capability pioneered by firms such as Dalton Bioanalytics through single-run assays that lower cost and boost data depth.
AI-powered analytics shorten turnaround windows, allowing near real-time dose adjustments in adaptive trials. Immunogenicity and neutralizing-antibody assays also display robust demand as biologics volumes climb, requiring ultralow detection limits and confirmatory workflows. ADME studies remain fundamental, but high-resolution platforms increase metabolite mapping efficiency, anchoring their relevance within the broader service mix of the bioanalytical testing services industry.
By End User:
CDMOs Accelerate Partnership ModelsPharmaceutical companies controlled 55.68% of 2025 revenue, yet contract development and manufacturing organizations are on track for a 13.03% CAGR as integrated research-to-manufacture partnerships gain traction. BioDuro’s CRDMO model illustrates the appeal: unified discovery, analytical, and GMP manufacturing reduce tech-transfer risks and compress timelines. CDMOs are scaling bioanalytical labs to support biologics pipelines and, in turn, capturing multi-year master service agreements.
WuXi Biologics reported non-COVID service revenue growth, evidencing the stickiness of integrated engagements. Academic and public research institutes remain steady but slower growth users, focused on translational research rather than commercial submissions. Overall, the bioanalytical testing services market size tied to CDMOs will widen as sponsors consolidate vendors for end-to-end accountability.
Geography Analysis
North America Bioanalytical Testing Services Market
North America generated 41.92% of global revenue in 2025, underpinned by concentrated pharmaceutical headquarters, FDA proximity, and extensive GLP infrastructure. Major providers such as Labcorp deploy more than 14,000 employees across domestic labs that underpin top-selling drug programs. Yet, talent shortages and elevated labor costs pressure margins and drive selective outsourcing to lower-cost regions. Canadian facilities complement US capacity with bilingual submissions, while Mexico’s near-shoring momentum is prompting fresh investment in GLP sites aligned with US import rules.
Europe and APAC Bioanalytical Testing Services Market
Europe ranks second due to cohesive EMA frameworks and leadership in biosimilars. Germany, France, and the United Kingdom host clusters of CRO and CDMO facilities that collaborate with academic hubs, and Eurofins Scientific alone runs over 900 European laboratories performing 450 million tests annually. Post-Brexit, the UK fast-tracked biosimilar pathways to sustain competitiveness, demonstrating a flexible regulatory posture that continues to attract biopharma analytical work. EU investments in biopharmaceutical manufacturing hubs and Horizon Europe R&D grants will keep demand buoyant. Asia-Pacific represents the fastest-growing zone at 11.74% CAGR, driven by clinical-trial migration, expanding manufacturing capacity, and supportive government incentives. China leads sample volumes as local CROs scale capacity, while Japan’s status as the third-largest pharmaceutical market ensures a steady flow of complex submissions requiring bilingual documentation. South Korea and Taiwan leverage tax credits and expedited reviews, luring multinationals searching for efficient enrollment and cost controls. India’s national push for GLP compliance and Australia’s biotechnology cluster diversify regional capabilities. As a result, the bioanalytical testing services market will see APAC revenue converge with Western levels during the second half of the decade.

Regulatory Landscape
Bioanalytical testing services operate under a tightening, increasingly harmonized validation regime anchored by ICH M10, which became effective in January 2023 and sets an international baseline for bioanalytical method validation and study sample analysis for both chemical and biological drug quantification. In the European Union, EMA actions such as the CHMP-adopted implementation strategy (April 2024) formalized how ICH M10 is applied for Marketing Authorisation submissions, shaping CRO qualification, cross-validation expectations, and the documentation packages used for multi-region filings.
In the United States, the FDA published the M10 Bioanalytical Method Validation and Study Sample Analysis guidance in June 2024, reinforcing expectations around method validation and sample analysis practices used to support regulatory decisions. The FDA also issued Bioanalytical Method Validation for Biomarkers guidance in April 2026, raising the rigor for biomarker assays tied to precision medicine programs and increasing the compliance premium for laboratories that can demonstrate robust validation, data integrity controls, and audit-ready records across regulated studies.
Competitive Landscape
The market shows moderate fragmentation yet increasing consolidation as scale and technology investments differentiate leaders. High-resolution mass-spectrometry systems above USD 500,000, coupled with expert staffing, create substantial entry barriers. Eurofins Scientific exemplifies scale leverage, offering more than 200,000 validated assays across 61 countries and completing 450 million tests per year. Acquisition activity centers on complementary biophysical platforms; Bruker’s purchase of Sierra Sensors and Waters’s takeover of Wyatt Technology extend service breadth for complex biotherapeutics.
Strategic direction favors vertical integration and regional expansion. Providers are linking discovery screening to regulated bioanalysis and commercial QC under one contract to eliminate tech-transfer friction. Robotics-driven dark labs promise 24-hour workflows that mitigate scientist shortages and lower error rates. White-space remains in multi-omics and AI-assisted data-mining niches where early movers such as Dalton Bioanalytics operate. Overall, competition hinges on marrying regulatory fluency, global logistics, and automated analytics to support sponsors navigating a more intricate therapeutic landscape.
Bioanalytical Testing Services Industry Leaders
SGS SA
Syneos Health
Charles River Laboratories
Labcorp Drug Development (Covance)
ICON plc
- *Disclaimer: Major Players sorted in no particular order
Bioanalytical Testing Services Market Companies Covered in this Report
- LabCorp
- Charles River
- Thermo Fisher – PPD
- Eurofins
- ICON
- Syneos Health
- SGS
- Intertek Group
- WuXi App Tec
- Medpace Holdings
- BioAgilytix Labs
- Frontage Labs
- Toxikon Corp.
- Covance-Monogram
- Altasciences
- SGS Vitrology
- Eurofin-Advinus
- Analytical Bio-Clear

Market Opportunities and Future Outlook
Capacity additions and footprint moves in 2026 point to whitespace for providers that can deliver GLP-compliant bioanalysis alongside biomarker and omics capabilities near major biopharma hubs. Thermo Fisher Scientifics PPD opened a new bioanalytical and biomarker laboratory in Gothenburg, Sweden (May 2026), Ardena brought an operational GLP-compliant bioanalytical lab online in Somerset, New Jersey (April 2026), and Celerion expanded its bioanalytical laboratory in Zurich, Switzerland (June 2026). These investments align with sponsor priorities for shorter logistics chains, faster sample-to-data cycles, and local scientific collaboration, while keeping submission readiness aligned with ICH M10.
Instrumentation-led scaling and integrated service models also support growth for differentiated providers, particularly in high-throughput mass spectrometry and complex-modality testing that many sponsors do not run in-house. Veloxity Labs added a SCIEX 6500+ system in Peoria, Illinois (April 2026) and Eurofins Viracor BioPharma integrated St. Charles bioanalytical operations into its Lenexa, Kansas, facility with enhanced capabilities (February 2026), reflecting consolidation of capacity and expansion of advanced testing menus. With FDA biomarker-validation guidance released in April 2026, laboratories that can validate biomarker assays while maintaining robust electronic records and audit trails have a clearer route to regulated biomarker-heavy programs alongside traditional PK, BE, and immunogenicity work.
Recent Industry Developments in Bioanalytical Testing Services Market
- June 2026: SGS acquired CMIC, INC., adding a 27,000 square foot GLP-compliant bioanalytical facility in Chicago focused on biologics and therapeutics. The deal expands SGS capacity and breadth in regulated bioanalysis, improving its ability to absorb higher study volumes and consolidate services for North American sponsors.
- May 2026: SGS acquired Keystone Bioanalytical in Philadelphia, a specialist in GLP-compliant quantitative LC-MS/MS method development, validation, and analysis. The acquisition deepens small-molecule and targeted quantitative capabilities and supports end-to-end drug development testing workflows under one provider network.
- January 2026: Labcorp signed an agreement with Roche to implement the cobas Mass Spec solution in U.S. clinical laboratories, with initial deployment planned in Burlington, North Carolina. Moving toward fully automated mass spectrometry supports higher-throughput, standardized testing and can improve operational consistency for programs relying on mass spectrometry-based analytics.


Bioanalytical Testing Services Market Report Scope and Research Methodology
Market Definition and Coverage
For this study, the market covers outsourced bioanalytical testing work used to measure drugs, metabolites, and biomarkers in biological samples, along with the supporting method development and validation activities needed for regulated studies across preclinical and clinical trials.
Scope exclusions: We exclude routine clinical diagnostic testing and hospital laboratory services that are not performed as part of regulated bioanalysis for drug development.
Segments Covered in This Report
- By Molecule Type
- Small Molecules
- Large Molecules
- By Test Type
- Bioavailability & Bioequivalence
- Pharmacokinetics
- Pharmacodynamics
- Absorption-Distribution-Metabolism-Excretion
- Immunogenicity & Neutralizing-Antibody Assays
- Biomarker & Omics-Based Assays
- Other Tests
- By End User
- Pharmaceutical Companies
- Biopharmaceutical & Biotech Firms
- Contract Development & Manufacturing Organizations
- Academic & Government Institutes
- By Geography
- North America
- United States
- Canada
- Mexico
- Europe
- Germany
- United Kingdom
- France
- Italy
- Spain
- Rest of Europe
- Asia-Pacific
- China
- Japan
- India
- Australia
- South Korea
- Rest of Asia-Pacific
- Middle East & Africa
- GCC
- South Africa
- Rest of Middle East & Africa
- South America
- Brazil
- Argentina
- Rest of South America
- North America
Data Sources, Market Sizing, and Validation
Desk Research
We start by grounding the model in public facts that show demand volume and research intensity, and then translate those into service revenues using interview-led assumptions. Common inputs include regulators and public registries, such as FDA and EMA guidance and drug approval disclosures, ClinicalTrials.gov trial activity, OECD and World Bank health and R&D indicators, and bibliographic sources such as PubMed for assay and biomarker research direction.
To pressure-test scale, we also review company filings and investor decks for outsourced R&D spending cues, association websites and conference materials that describe assay adoption, and reputed press coverage of capacity expansions. Where helpful, a paid subscription for company financials and a patent database are used to quickly map service footprints and emerging technology themes without relying on any single source. The sources listed here are illustrative, and many other public references were also used for data collection, cross-checks, and clarification.
Primary Interviews and Surveys
Primary work is used to convert activity signals into market values and to validate practical pricing and outsourcing behavior. We speak with lab leaders, quality and regulatory managers, BD teams, and sponsor-side study owners across major regions, and then recheck key assumptions where responses show wide spreads across molecule types and trial phases.
Distribution of primary research fieldwork respondents
| Company type | Respondent position | Region |
|---|---|---|
| Top tier: 32% | CXOs: 17% | APAC: 51% |
| Mid tier: 50% | Functional/Unit leaders: 38% | EMEA: 29% |
| Smaller Players: 18% | Managers: 45% | Americas: 20% |
Market-Sizing & Forecasting
Market sizing is built using a top-down approach where clinical and preclinical activity, molecule mix, and outsourcing share are used to reconstruct the annual testing demand pool, which is then converted to revenue using typical study volumes and service pricing bands. In parallel, we corroborate totals with selective bottom-up checks, such as sampled price per assay panel times estimated sample throughput for key workflows, and then adjust for gaps where small labs do not disclose enough information.
Key model inputs include trial starts by phase, the share of biologics versus small molecules in pipelines, sampling intensity per protocol (including repeat sampling for PK and immunogenicity), average turnaround and re-run rates that impact capacity, and region-level pricing differences driven by compliance requirements and labor costs. Forecasts are developed using scenario analysis supported by regression-style relationships between trial activity, R&D funding trends, and outsourcing penetration, and then aligned to what interviewees expect for assay complexity, biomarker adoption, and capacity build-outs over the next five years.
Data Validation & Update Cycle
We validate outputs by comparing implied revenues per trial and per sample against interview ranges and publicly visible signals like trial counts, approvals, and outsourcing intensity comments in filings. Outliers are investigated through assumption audits (for example, unusual price jumps, unrealistic throughput, or double counting across workflows) and are then reviewed in a second analyst pass before sign-off.
The report is refreshed annually, and interim updates are triggered when material events occur, such as regulatory shifts, major capacity additions, or sharp changes in clinical trial activity. Before delivery, we run a final check so the market view reflects the most current data available at that time.
Mordor Intelligence's Bioanalytical Testing Services Market Size Compared Against Other Published Estimates
Published market sizes for bioanalytical testing services can look far apart because each publisher chooses a different mix of services, end users, and study stages, and they also use different base years and pricing logic. Some models lean more on pipeline narratives, while others anchor more tightly to measurable study activity and conversion factors, which changes the final revenue total.
Clinical trial activity, molecule mix, and interview-validated pricing bands are the evidence checks that tie Mordor Intelligence to USD 4.68 B (2026) without inflating the number using adjacent lab services that are not required for regulated bioanalysis. The biggest gaps usually come from whether method development is counted separately or bundled, how biomarker and immunogenicity work is treated, what share of in-house testing is assumed to be outsourced, and how currency timing is handled in multi-region rollups.
Benchmark comparison
| Source | Market Size | Gaps in Research Methodology |
|---|---|---|
| Mordor Intelligence | USD 4.68 B (2026) | |
| Global Consultancy A | USD 4.80 B (2024) | Uses a 2024 base and may include a broader set of lab support services around bioanalysis, which can lift totals when converted to revenue at blended pricing. |
| Life Sciences Publisher B | USD 5.38 B (2026) | Likely applies a wider workflow and technology scope and a higher outsourced share assumption across regions, which pushes the 2026 value above activity-linked pricing ranges. |
The comparison shows that the spread is mostly explained by scope boundaries and the way outsourcing and pricing are applied, rather than by disagreement on growth direction. By keeping the demand pool traceable to study activity and then checking the price-volume math with interviews, the final number stays repeatable and easy to audit year to year.


Key Questions Answered in the Report
What is the current size of the bioanalytical testing services market?
The market generated USD 4.68 billion in 2026 and is projected to reach USD 7.23 billion by 2031.
Which geographic region is growing the fastest?
Asia-Pacific leads with a forecast 11.74% CAGR, driven by clinical-trial migration and regulatory reforms.
Why are biomarker assays expanding so rapidly?
Precision-medicine strategies require multi-omics profiling, pushing biomarker assay demand at a 12.31% CAGR through 2031.
How are CDMOs influencing the market?
CDMOs integrate discovery to manufacturing, enabling 13.03% CAGR growth by offering single-contract accountability.
What are the main regulatory challenges?
Divergent global validation standards and tighter data-integrity rules raise compliance costs and prolong project timelines.
How is automation addressing workforce shortages?
Robotics-driven “dark labs” and AI analytics deliver 24-hour throughput, reducing reliance on scarce specialist scientists.
Page last updated on:


 Your data is secure and never sold or shared.


