Market Overview
| Study Period | 2025 - 2030 |
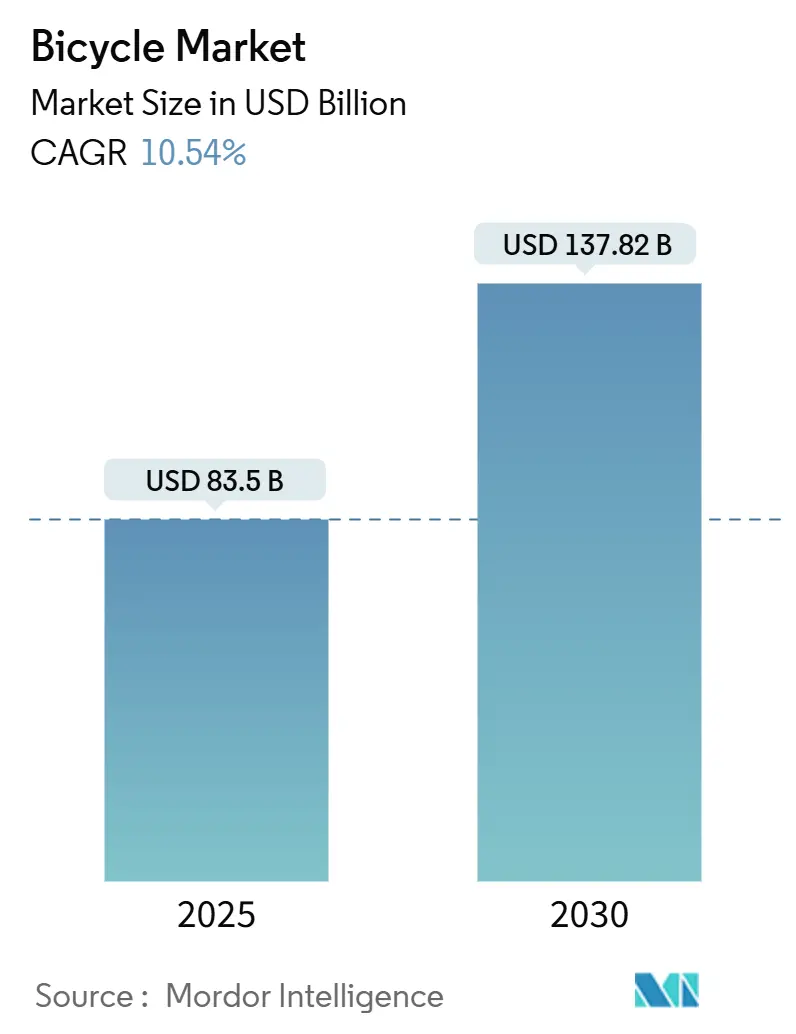
| Market Size (2025) | USD 83.5 Billion |
| Market Size (2030) | USD 137.82 Billion |
| Growth Rate (2025 - 2030) | 10.54% CAGR |
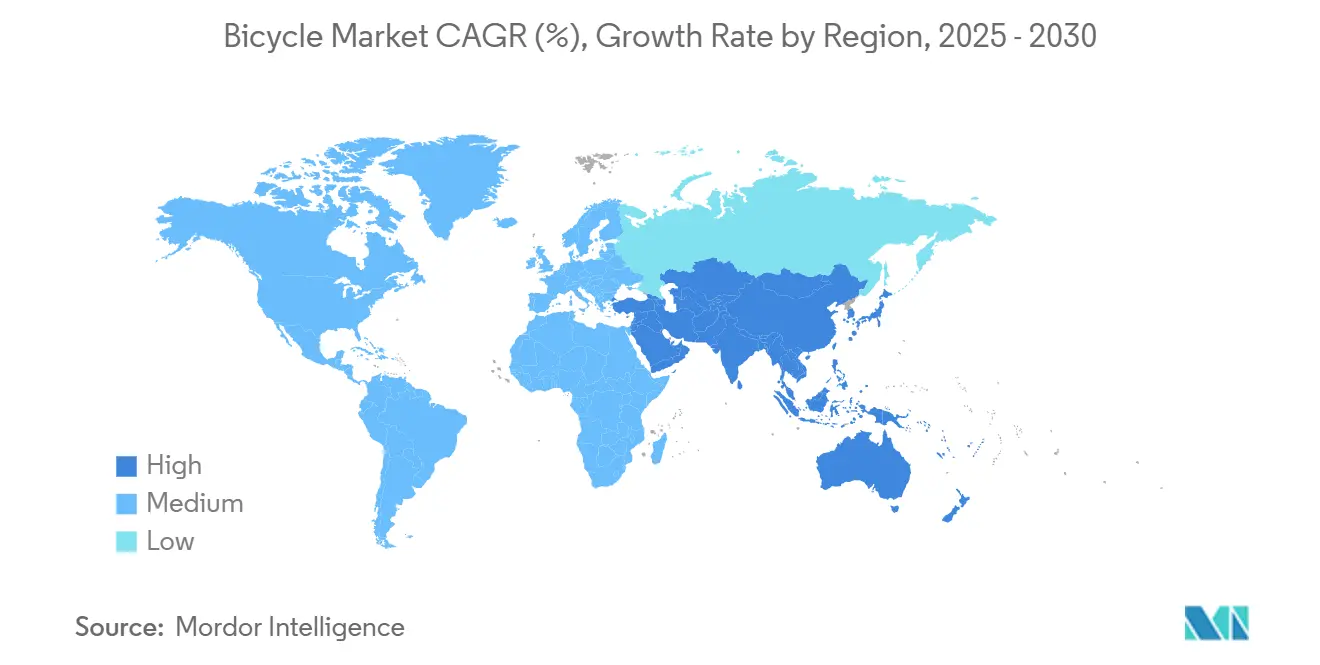
| Fastest Growing Market | Asia-Pacific |
| Largest Market | Asia-Pacific |
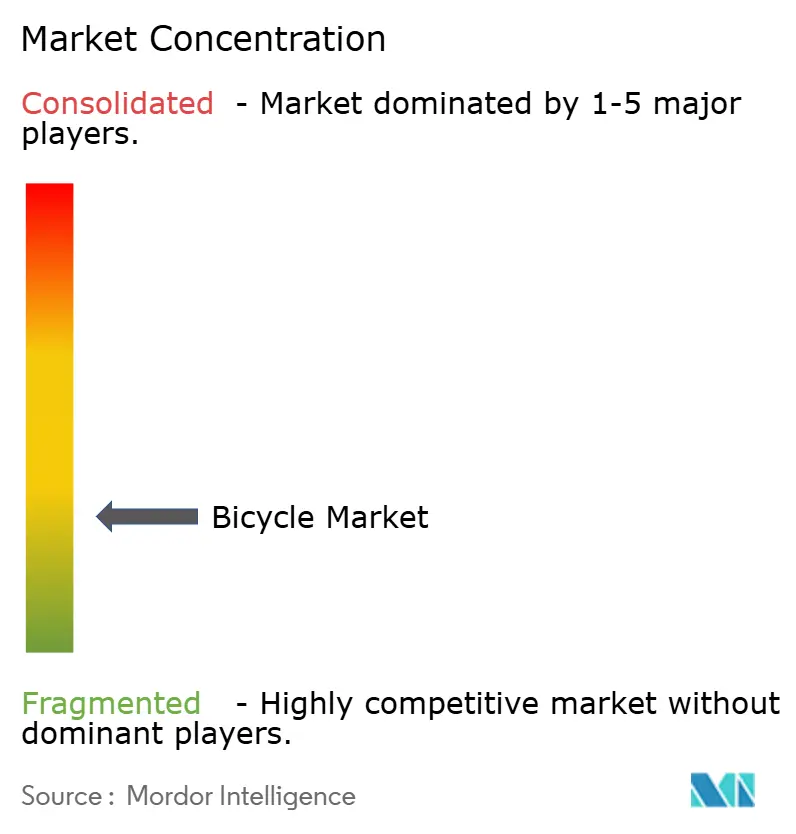
| Market Concentration | Low |
Major Players*Disclaimer: Major Players sorted in no particular order Image © Mordor Intelligence. Reuse requires attribution under CC BY 4.0. |
|
Bicycle Market Analysis by Mordor Intelligence
The bicycle market size is estimated at USD 83.50 billion in 2025, and is expected to reach USD 137.82 billion by 2030, at a CAGR of 10.54% during the forecast period (2025-2030). Urban centers are increasingly implementing congestion charges, while employers are incorporating bicycle incentives into wellness programs, driving sustained demand for bicycles. This demand is further reinforced by significant government investments in infrastructure, which have already exceeded projections, alongside stricter climate policies aimed at reducing carbon emissions. Additionally, ongoing advancements in battery safety technology are expanding the potential consumer base by addressing safety concerns. The emergence of direct-to-consumer brands and the integration of software-enabled fleet services are redefining the retail landscape, optimizing operational efficiencies, and enhancing customer accessibility. Rising fuel prices are further amplifying the cost advantage of bicycles over motorized vehicles, making them a more economically viable option. Overall, the bicycle market continues to experience growth, supported by favorable regulatory frameworks, technological progress, and a shift in urban lifestyles toward sustainable and active mobility solutions.
Key Report Takeaways
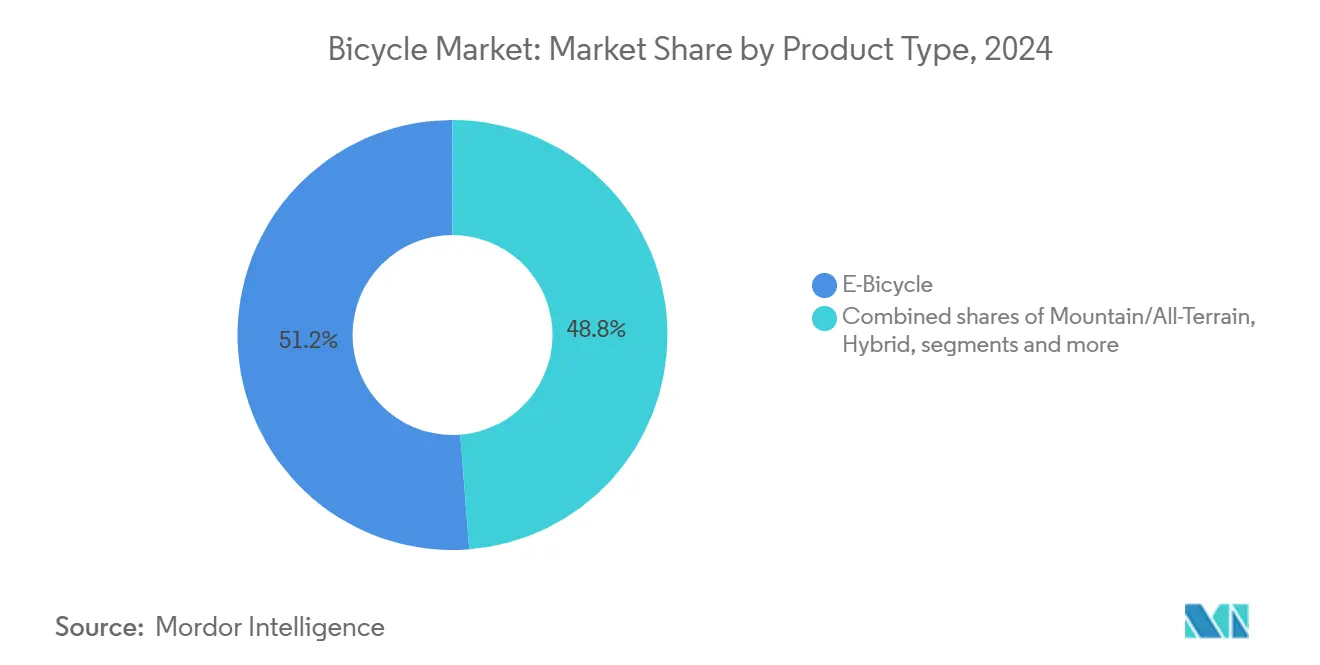
- By product type, e-bicycles led with 51.25% revenue share in 2024, and are projected to rise at a 12.76% CAGR to 2030.
- By design, regular bikes captured an 85.78% share of the bicycle market size in 2024, whereas folding bikes are expected to expand at an 11.43% CAGR through 2030.
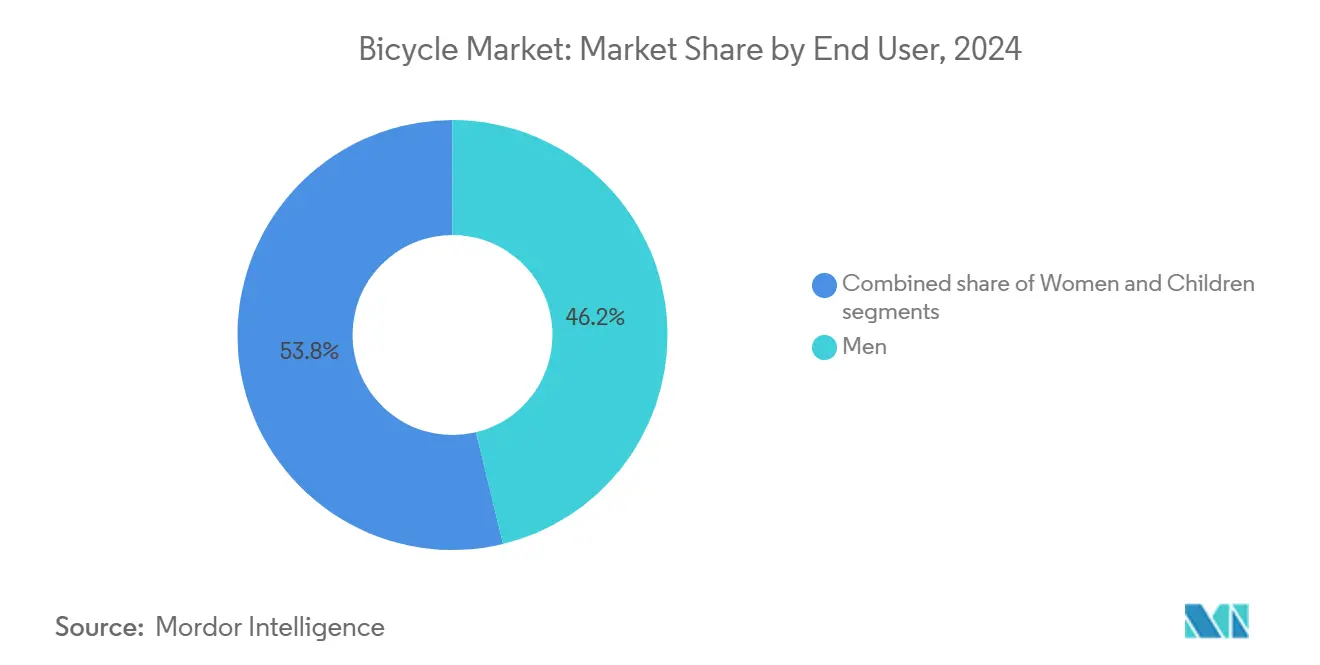
- By end-user, the men segment held 46.23% of the bicycle market share in 2024, while the children segment recorded the fastest growth at 10.61% CAGR.
- By distribution channel, offline retail stores retained 81.23% revenue share in 2024; online channels represent the fastest-growing route to market, advancing at a 13.55% CAGR.
- By geography, Asia-Pacific commanded 48.11% of global revenues in 2024 and is projected to remain the growth engine with a 13.33% CAGR through 2030.
Global Bicycle Market Trends and Insights
Drivers Impact Analysis
| Driver | ( ~ ) % Impact on CAGR Forecast | Geographic Relevance | Impact Timeline |
|---|---|---|---|
| Urban congestion boosts bicycle usage for daily commute | +2.1% | Global; strongest in Asia-Pacific megacities | Medium term (2–4 years) |
| Fitness trends increase popularity of cycling activities | +1.8% | North America and Europe | Short term (≤ 2 years) |
| Government support encourages eco-friendly transportation methods | +2.7% | Global; led by Europe and North America | Long term (≥ 4 years) |
| Environmental awareness and sustainability drives bicycle usage among consumers | +1.9% | Global; strongest in developed markets | Medium term (2–4 years) |
| Workplace wellness programs encourage employee bicycle usage | +0.8% | Global; led by Europe and North America | Medium term (2–4 years) |
| Rising fuel prices make bicycles cost-effective alternatives | +0.6% | Africa | Short term (≤ 2 years) |
Source: Mordor Intelligence
Understand The Key Trends Shaping This Market
Download PDF
Government support encourages eco-friendly transportation methods
Governments worldwide are increasingly recognizing cycling as a critical element of climate infrastructure rather than merely a recreational activity. This shift is evident in the European Union's adoption of the European Declaration on Cycling in April 2024, which outlines 36 binding commitments for member states to enhance cycling infrastructure and promote its integration into sustainable transport systems [1]Source: European Cyclists’ Federation, “European Declaration on Cycling,” ecf.com. Similarly, in the United States, the Active Transportation Infrastructure Investment Program provides USD 44.5 million annually to develop connected cycling networks, fostering greater accessibility and safety for cyclists. On a state level, California has committed USD 930 million over four years to build 265 miles of new bike paths, further emphasizing the importance of cycling in urban planning [2]Source: U.S. Department of Transportation, “Bipartisan Infrastructure Law Funding for Active Transportation,” transportation.gov. These comprehensive policy measures are driving sustained demand for cycling-related products and services, encouraging manufacturers to scale up production capacities and motivating retailers to increase their inventory levels to meet the growing market needs.
Urban congestion boosts bicycle usage for daily commute
As urban density pressures rise, especially in Asia-Pacific megacities facing traffic congestion's economic and social costs, the need for cycling solutions is critical. Congestion pricing and low-emission zones further promote cycling over private vehicles. Hybrid work models have also reshaped commuting, making cycling ideal for shorter, flexible trips. The Netherlands exemplifies successful cycling integration with cycling highways linked to rail networks, creating a multimodal transport system that rivals car ownership while addressing environmental and mobility challenges. Corporations are increasingly adopting cycling, driven by employee wellness initiatives and sustainability reporting mandates. Investments in cycling infrastructure help attract talent and meet carbon reduction goals, aligning with environmental and social governance (ESG) objectives.
Fitness trends increase popularity of cycling activities
Post-pandemic, cycling has shifted from transportation to a multifaceted activity, driven by health and wellness trends. In 2024, 42.47 million Americans participated in road cycling, according to the Sports and Fitness Industry Association [3]Source: Sports and Fitness Industry Association, "Fitness, and Leisure Activities Topline Participation Report", www.sfia.org. Fitness tracking technologies have enhanced engagement through data-driven feedback loops. Gravel bikes are gaining popularity among younger riders, combining fitness with adventure tourism and expanding cycling beyond urban commuting. Connected devices and mobile apps are fostering a tech-driven community spirit. For children, cycling is becoming a core lifestyle element. Corporate wellness programs are boosting participation by integrating cycling infrastructure and incentives, supporting market growth.
Environmental awareness and sustainability drives bicycle usage among consumers
As climate consciousness grows, cycling stands out as an accessible and impactful personal climate action with immediate benefits. Corporate sustainability mandates are driving organizations to adopt bicycles to cut scope 3 emissions and improve employee commuting. In China, mandatory lithium-ion battery recycling for e-bikes addresses lifecycle environmental concerns, easing adoption for eco-conscious consumers. Cycling Industries Europe's circular economy framework gives brands a competitive edge by reducing environmental impact. Additionally, cycling infrastructure is becoming integral to corporate carbon accounting and net-zero strategies, boosting demand for bicycle fleets and related infrastructure.
Restraints Impact Analysis
| RESTRAINT | ( ~ ) % IMPACT ON CAGR FORECAST | GEOGRAPHIC RELEVANCE | IMPACT TIMELINE |
|---|---|---|---|
| Availability of substitute like bikes, and other faster transport modes discourages the use of bicycle | -1.4% | Global; strongest in car-dependent regions | Medium term (2–4 years) |
| High e-bike cost restricts wider adoption globally | -1.8% | Global; peak impact in emerging markets | Short term (≤ 2 years) |
| Presence of counterfeit bicycles hinders market growth | -0.4% | Global | Short term (≤ 2 years) |
| Poor road conditions in rural areas hinder smooth bicycle experience | -0.8% | Africa | Medium term (2–4 years) |
Source: Mordor Intelligence
Availability of substitute like bikes, and other faster transport modes discourages the use of bicycle
Competition among transport modes is intensifying as electric scooters, ride-sharing services, and autonomous vehicle pilots address short-distance mobility. In urban areas, e-bike ownership costs now rival those of electric scooters and ride-sharing subscriptions, heightening pricing competition. Integrated transport apps, driven by micromobility platform consolidation, have made bicycles one of many transport options. In Asia-Pacific cities with extensive metro systems, public transportation advancements have reduced cycling's appeal for longer commutes. While regulations for alternative transport modes advance quickly, cycling infrastructure faces delays. For instance, electric scooter-sharing programs receive rapid approvals, whereas cycling projects take longer. However, cycling's health and environmental benefits limit substitution threats, ensuring its market presence.
High e-bike cost restricts wider adoption globally
High e-bike prices hinder their adoption, especially in emerging markets and among budget-conscious consumers. Batteries, accounting for 30-40% of e-bike manufacturing costs, play a pivotal role in this pricing challenge. Supply chain constraints, fueled by competition from the automotive sector and energy storage needs, further inflate these costs. Urban planners and governments champion e-bikes and high-performance bicycles to curb car dependency. However, these initiatives often price out key demographics, students, daily wage earners, and low-income urbanites, who would benefit most. Moreover, premium e-bikes demand specialized components, professional maintenance, and essential accessories like helmets, locks, and lights. These added expenses elevate the total cost of ownership, deterring first-time buyers and those sensitive to price.
Segment Analysis
By Product Type: E-Bicycles Drive Market Transformation
E-bicycles held 51.25% of the bicycle market in 2024, and the segment is forecast to post a 12.76% CAGR to 2030. The bicycle market size for e-bicycles is therefore on track to more than double within the decade, propelled by safety certifications such as UL 2849 that boost consumer trust. Batteries are now removable and airline-compliant, widening use cases. Meanwhile, conventional road and city bikes preserve large sales volumes, sustaining economies of scale for component suppliers.
Technology convergence defines competitive edges: integrated navigation, theft-tracking, and predictive maintenance enrich the rider experience and push premium price points. Asia-Pacific producers benefit from cost-efficient capacity, while European assemblers leverage proximity to capture premium niches. Battery recycling mandates in China set a template other regions may follow, adding after-sales service revenue for compliant brands. Market entry remains open for software-native firms bundling bikes with fleet analytics, providing asset-light access to mobility budgets.
Note: Segment shares of all individual segments available upon report purchase
By Design: Regular Bikes Dominate Despite Folding Innovation
In 2024, regular frames continue to dominate the bicycle market, accounting for a substantial 85.78% market share. This dominance highlights the strong appeal of mass-produced geometries, cost-effective pricing, and seamless compatibility with existing infrastructure, which collectively make regular frames a preferred choice among consumers. On the other hand, folding designs are projected to experience a robust growth trajectory, registering an impressive 11.43% CAGR through 2030. This growth rate, which is double that of the overall bicycle market, is primarily driven by the rising demand for compact and space-efficient solutions, particularly in response to challenges such as limited urban housing space and the growing need for efficient last-mile connectivity with rail networks.
Material advances in magnesium hinges and quick-release clamps now limit weight premiums, and warranty parity with regular bikes removes past hesitations. In the bicycle industry, corporations also favor foldables for employee fleets because units store safely under desks and in small lockers. European policy supporting combined rail-bike commutes, notably in Germany and the Netherlands, gives folding models regulatory tailwinds. Yet the bulk of annual volume will still come from regular bikes until folding retail prices close the gap.
By End-User: Men Lead, Children Accelerate
In 2024, men represent 46.23% of the cycling market, reflecting established cycling demographics and commuting trends. Conversely, the children's segment demonstrates significant growth, with a 10.61% CAGR projected through 2030, indicating a generational shift that supports long-term market expansion. Women's participation is increasing due to infrastructure advancements that focus on safety and accessibility, such as protected bike lanes and secure parking solutions. The growth in the children's segment is driven by government initiatives, including France's strategy to train 850,000 children in cycling skills and the integration of cycling into school programs, fostering early adoption and lifestyle integration.
Demographic trends are increasingly favorable for cycling adoption, as urbanization concentrates populations in areas conducive to cycling and environmental awareness influences transportation preferences. Additionally, corporate wellness programs are emphasizing the benefits of cycling and related infrastructure, driving institutional demand and encouraging adult participation. The sustained momentum in the children's segment indicates long-term growth potential, as cycling becomes an ingrained transportation behavior rather than a skill acquired later in life.
Note: Segment shares of all individual segments available upon report purchase
By Distribution Channel: Online Growth Transforms Retail
In 2024, brick-and-mortar stores continue to dominate the market, contributing 81.23% of total sales. This dominance is driven by value-added services such as test-rides, personalized fittings, and after-sales support. However, online platforms are projected to experience significant growth, with a compound annual growth rate (CAGR) of 13.55% anticipated through 2030. This trend highlights the growing preference for direct-to-consumer business models. Digital-native brands are strategically eliminating dealer mark-ups and reallocating these cost savings to enhance customer support services, including innovative solutions like mobile mechanics.
The adoption of advanced 3-D bike-fit tools and augmented-reality product explorers is significantly mitigating the perceived risks associated with remote purchasing. These technologies enable consumers to make more informed decisions by providing personalized and interactive experiences. Furthermore, the implementation of European and Japanese quality-route certifications has established consistent and reliable standards, fostering greater buyer confidence across international markets. Established retailers are capitalizing on omnichannel strategies that integrate online research with in-store services. This approach not only expands their market reach but also strengthens customer trust by combining the convenience of digital platforms with the personalized support of physical retail locations.
Geography Analysis
In 2024, the Asia-Pacific region solidified its position as a key revenue contributor, accounting for 48.11% of the global market. The region is forecasted to achieve a strong compound annual growth rate (CAGR) of 13.33% through 2030, driven by several factors. In China, the bicycle market is experiencing significant growth due to the widespread adoption of e-bikes, the enforcement of mandatory battery-recycling initiatives, and urban traffic policies that actively encourage the use of two-wheelers as a sustainable mode of transportation. Japan, on the other hand, is strategically aligning its certification frameworks with European standards, thereby simplifying export procedures and enhancing the global competitiveness of its domestic brands.
In North America and Europe, large-scale infrastructure investment programs are creating a stable and sustained demand for bicycles. The market's geographic distribution underscores a concentration of manufacturing activities in Asia, while developed markets are witnessing growth driven by favorable policy measures. This dynamic fosters trade flows that not only reinforce the dominance of established Asian manufacturers but also create opportunities for premium product positioning in Western markets, catering to a consumer base that values high-quality and innovative offerings.
The bicycle market in the Middle East and Africa is experiencing robust growth, with e-bike adoption accelerating at double-digit rates and traditional bicycles maintaining steady demand. Urban consumers in key cities such as Dubai, Cape Town, Nairobi, and Tel Aviv are increasingly perceiving bicycles, particularly e-bikes, as modern, eco-conscious alternatives to conventional vehicles like cars and motorbikes. However, the lack of standardized safety regulations, insurance frameworks, and traffic rights continues to pose challenges, hindering the rapid formalization of the bicycle market in several African nations.
Competitive Landscape
The bicycle market is fragmented, led by established players like Giant Manufacturing Co. Ltd, Accell Group NV, Merida Industry Co. Ltd, Trek Bicycle Corporation, and Pon Holdings BV, who have built strong brand recognition through decades of market presence. The largest bicycle companies are heavily investing in product innovation, particularly in the e-bike segment, with advanced features and sustainable manufacturing practices becoming key differentiators.
The industry is witnessing a significant push towards technological integration, with companies developing smart bikes equipped with connectivity features and digital capabilities. Operational agility has become crucial as bicycle manufacturers expand their distribution networks through both offline and online channels, while strategic partnerships with technology providers and component manufacturers help strengthen their market positions. Geographic expansion remains a key focus, with companies establishing manufacturing facilities and research and development centers across multiple regions to better serve local markets and reduce supply chain dependencies.
European manufacturers are scaling back production, creating opportunities for Asian OEMs to expand their presence by taking on contract-manufacturing roles. Concurrently, U.S. tariffs are driving the retention of certain final assembly operations within domestic borders to mitigate cost implications. While the lower tiers of the market remain highly competitive and price-sensitive, the premium utility and cargo segments present significant opportunities for profitable growth. This growth potential is particularly evident among corporate fleet providers, who are strategically differentiating themselves by offering comprehensive service bundles that include leasing, maintenance, and advanced telematics solutions.
Bicycle Industry Leaders
-
Trek Bicycle Corporation
-
Pon Holdings BV
-
Giant Manufacturing Co. Ltd.
-
Accell Group N.V.
-
Merida Industry Co. Ltd
- *Disclaimer: Major Players sorted in no particular order
Need More Details on Market Players and Competitors?
Download PDF
Recent Industry Developments
- May 2025: ENYRING GmbH partnered with Swobbee to deploy a swappable battery platform across Berlin and Amsterdam, boosting urban micromobility infrastructure
- April 2025: Ampler unveiled the Nova and Nova Pro electric bicycles featuring USB-C charging compatibility. These models incorporate advanced battery technology and offer riders the convenience of charging their devices through integrated USB-C ports.
- April 2025: Gabriel India Limited entered the European bicycle market by introducing suspension solutions for city, cargo, SUV, and mountain bikes. The company focuses on providing suspension forks for specific bicycle categories.
- June 2024: Trek Bicycle has introduced the Madone Gen 8, its latest high-performance race bike, designed as an innovative combination of features from two renowned superbikes. This launch underscores Trek's commitment to pushing the boundaries of cycling technology and delivering cutting-edge solutions for professional and competitive cyclists.
Global Bicycle Market Report Scope
A bicycle is a vehicle with two wheels in tandem, usually propelled by pedals connected to the rear wheel by a chain, having handlebars for steering and a saddle-like seat. The bicycle market has been segmented by type, distribution channel, and geography. By type, the market is segmented into road bicycles, hybrid bicycles, all-terrain bicycles, e-bicycles, and other types. By distribution channel, the market is segmented into offline retail stores and online retail stores. The report also provides a regional analysis of North America, Europe, Asia-Pacific, South America, and Middle East and Africa. The report offers the market size in value terms in USD for all the abovementioned segments.
| By Product Type | Road/City | ||
| Mountain/All-Terrain | |||
| Hybrid | |||
| E-Bicycle | |||
| Other Types | |||
| By Design | Regular | ||
| Folding | |||
| By End-User | Men | ||
| Women | |||
| Children | |||
| By Distribution Channel | Offline Retail Stores | ||
| Online Retail Stores | |||
| By Geography | North America | United States | |
| Canada | |||
| Mexico | |||
| Rest of North America | |||
| Europe | Germany | ||
| United Kingdom | |||
| Italy | |||
| France | |||
| Spain | |||
| Netherlands | |||
| Poland | |||
| Belgium | |||
| Sweden | |||
| Rest of Europe | |||
| Asia-Pacific | China | ||
| India | |||
| Japan | |||
| Australia | |||
| Indonesia | |||
| South Korea | |||
| Thailand | |||
| Singapore | |||
| Rest of Asia-Pacific | |||
| South America | Brazil | ||
| Argentina | |||
| Colombia | |||
| Chile | |||
| Peru | |||
| Rest of South America | |||
| Middle East and Africa | South Africa | ||
| Saudi Arabia | |||
| United Arab Emirates | |||
| Nigeria | |||
| Egypt | |||
| Morocco | |||
| Turkey | |||
| Rest of Middle East and Africa | |||
By Product Type
| Road/City |
| Mountain/All-Terrain |
| Hybrid |
| E-Bicycle |
| Other Types |
By Design
| Regular |
| Folding |
By End-User
| Men |
| Women |
| Children |
By Distribution Channel
| Offline Retail Stores |
| Online Retail Stores |
By Geography
| North America | United States |
| Canada | |
| Mexico | |
| Rest of North America | |
| Europe | Germany |
| United Kingdom | |
| Italy | |
| France | |
| Spain | |
| Netherlands | |
| Poland | |
| Belgium | |
| Sweden | |
| Rest of Europe | |
| Asia-Pacific | China |
| India | |
| Japan | |
| Australia | |
| Indonesia | |
| South Korea | |
| Thailand | |
| Singapore | |
| Rest of Asia-Pacific | |
| South America | Brazil |
| Argentina | |
| Colombia | |
| Chile | |
| Peru | |
| Rest of South America | |
| Middle East and Africa | South Africa |
| Saudi Arabia | |
| United Arab Emirates | |
| Nigeria | |
| Egypt | |
| Morocco | |
| Turkey | |
| Rest of Middle East and Africa |
Need A Different Region or Segment?
Customize Now
Key Questions Answered in the Report
What is the current size of the bicycle market and how fast is it growing?
The bicycle market is worth USD 83.50 billion in 2025 and is projected to reach USD 137.82 billion by 2030, advancing at a 10.54% CAGR.
Which product category holds the largest share of the bicycle market?
E-bicycles lead with 51.25% revenue share in 2024 and are set to grow at a 12.76% CAGR through 2030.
Why is Asia-Pacific considered the growth engine for bicycles?
Asia-Pacific accounts for 48.11% of global revenues and benefits from massive installed e-bike bases, strong government subsidies, and cost-efficient manufacturing, driving a 13.33% CAGR.
How are governments supporting bicycle adoption?
Policies include the EU’s 36-point cycling declaration, USD 1.32 billion in U.S. federal funding for bike infrastructure, and India’s e-mobility subsidy program.
Page last updated on: July 3, 2025

