Beverage Contract Bottling And Canning Services Market Size and Share
Market Overview
| Study Period | 2020 - 2031 |
|---|---|
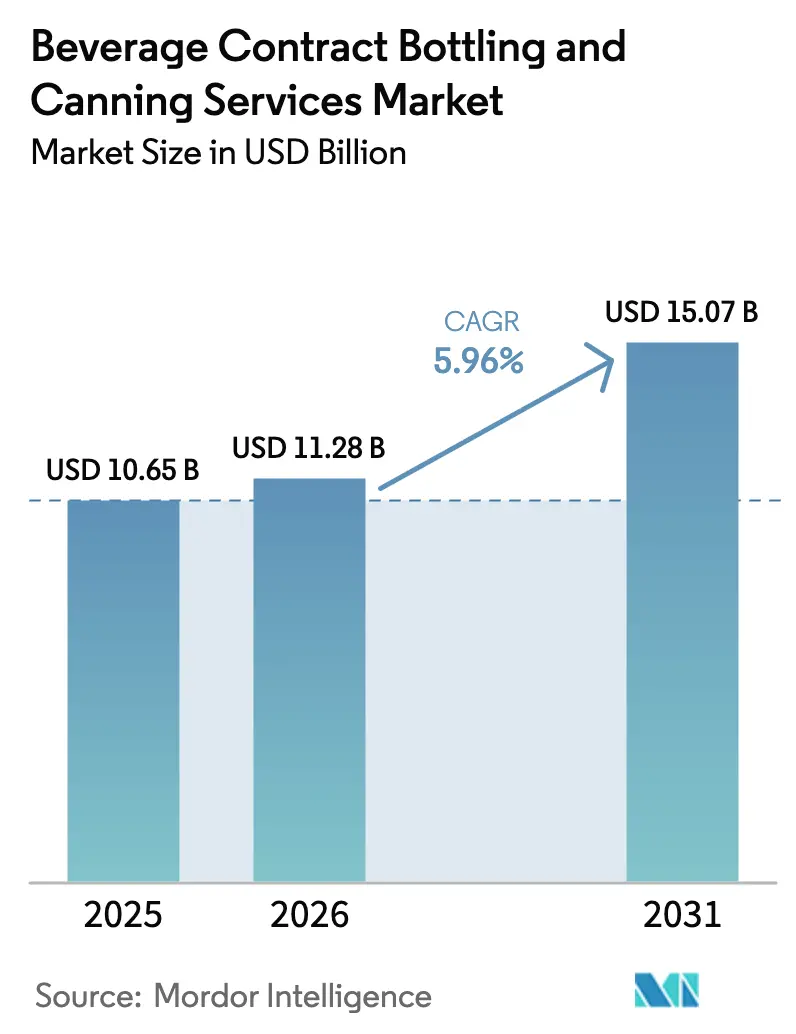
| Market Size (2026) | USD 11.28 Billion |
| Market Size (2031) | USD 15.07 Billion |
| Growth Rate (2026 - 2031) | 5.96% CAGR |
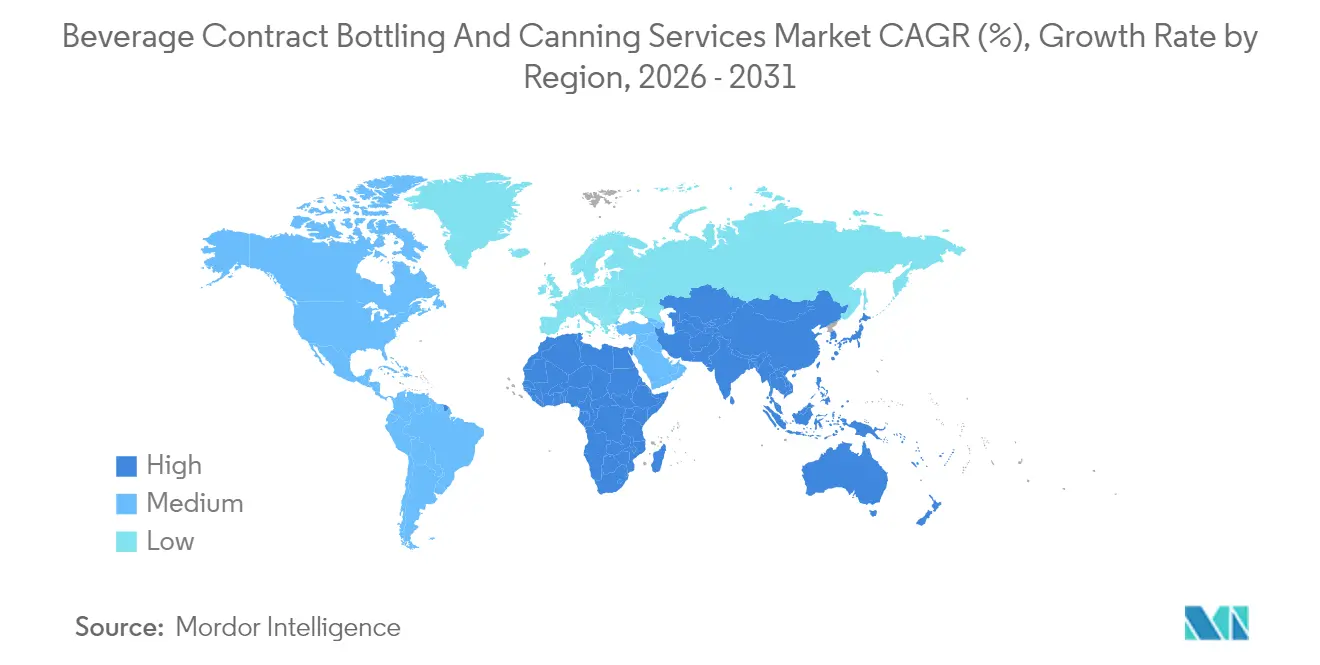
| Fastest Growing Market | Asia Pacific |
| Largest Market | North America |
| Market Concentration | Medium |
Major Players *Disclaimer: Major Players sorted in no particular order Image © Mordor Intelligence. Reuse requires attribution under CC BY 4.0. | |
Beverage Contract Bottling And Canning Services Market Analysis by Mordor Intelligence
The beverage contract bottling and canning services market size is expected to grow from USD 10.65 billion in 2025 to USD 11.28 billion in 2026 and is forecast to reach USD 15.07 billion by 2031 at 5.96% CAGR over 2026-2031. This momentum stems from brand migration toward asset-light operating models, surging SKU counts, and sustainability requirements that reward providers capable of switching materials and formats quickly. The launch of functional beverages, premium small-batch productions, and direct-to-consumer channels heightens demand for flexible, high-speed filling lines. Meanwhile, the price gap between aluminum and PET is narrowing, prompting accelerated can conversions as brands rush to meet circular economy mandates. Competitive intensity increases as scale players deploy capital to raise throughput and adopt energy-efficient processes, while mid-size co-packers target craft niches to preserve margins.
Key Report Takeaways
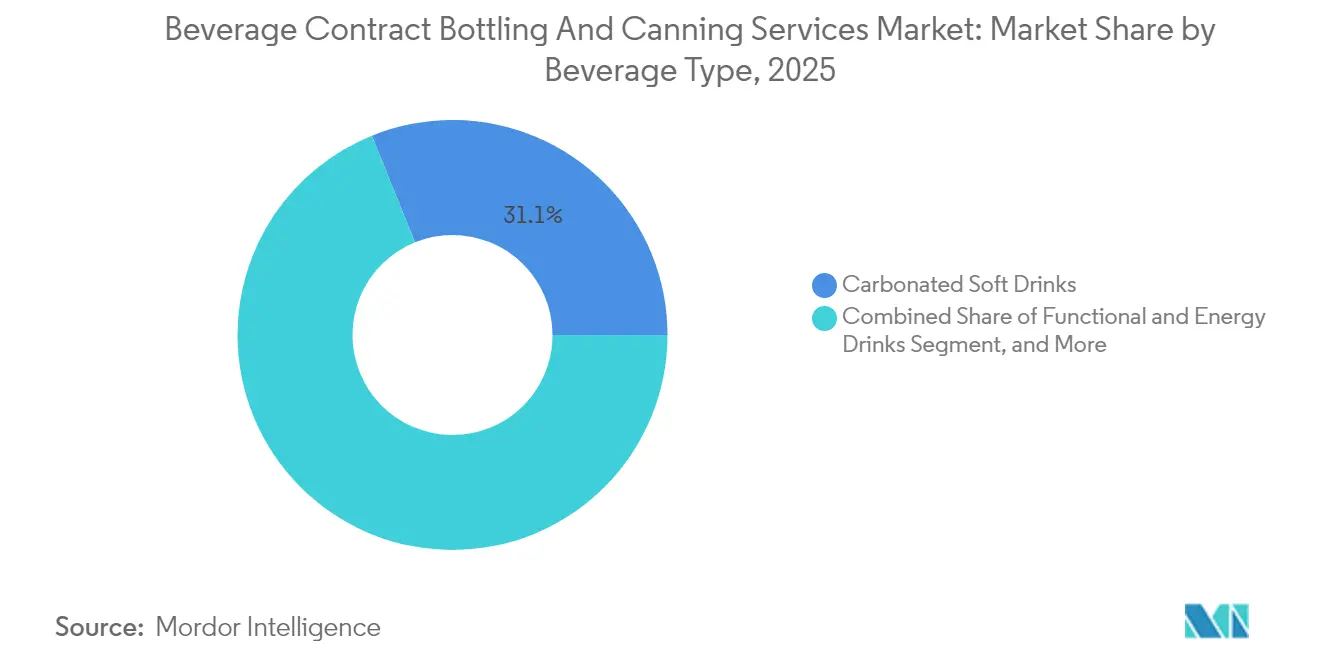
- By beverage type, carbonated soft drinks captured 31.12% of the Beverage Contract Bottling and Canning Services Market share in 2025.
- By packaging type, the Beverage Contract Bottling and Canning Services Market size for cans is projected to grow at a 7.71% CAGR between 2026–2031.
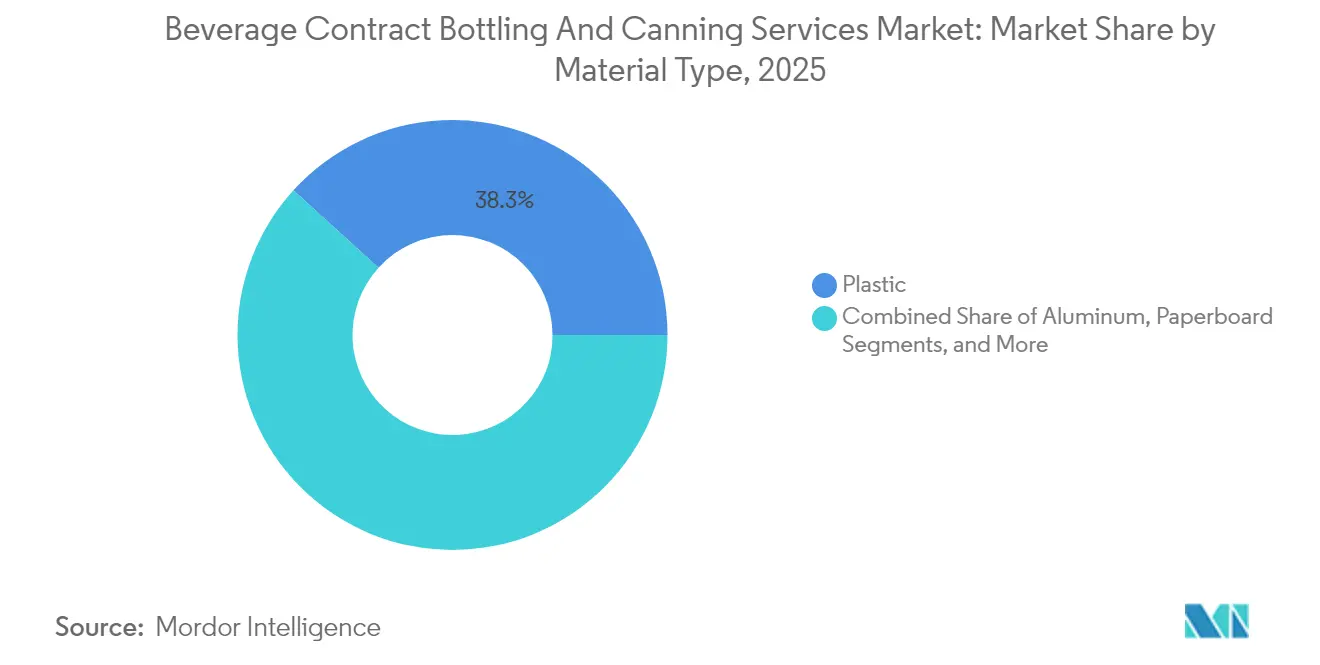
- By material type, plastic captured 38.25% of the Beverage Contract Bottling and Canning Services Market share in 2025.
- By geography, the Beverage Contract Bottling and Canning Services Market size for Asia-Pacific is projected to grow at a 8.28% CAGR between 2026–2031.
Note: Market size and forecast figures in this report are generated using Mordor Intelligence’s proprietary estimation framework, updated with the latest available data and insights as of 2026.
Global Beverage Contract Bottling And Canning Services Market Trends and Insights
Drivers Impact Analysis*
| Driver | (~) % Impact on CAGR Forecast | Geographic Relevance | Impact Timeline |
|---|---|---|---|
| Widely Adopted SKU Proliferation Among Beverage Brands | +1.2% | Global, with a concentration in North America and Europe | Medium term (2-4 years) |
| Rising Growth of Ready-To-Drink Functional Beverages | +1.8% | Global, led by North America and the Asia-Pacific | Long term (≥ 4 years) |
| Brands Asset-Light Outsourcing Strategies to Reduce Capex | +1.0% | Global, accelerating in emerging markets | Medium term (2-4 years) |
| Increasing Aluminum-Can Adoption Due To Sustainability Mandates | +1.3% | Europe and North America core, expanding to Asia-Pacific | Long term (≥ 4 years) |
| Premiumization Trend Driving Small-Batch Craft Beverage Co-Packing | +0.7% | North America and Europe, emerging in Asia-Pacific urban centers | Short term (≤ 2 years) |
| Expansion Of E-Commerce Requiring Flexible Short-Run Packaging | +0.9% | Global, with early adoption in North America and Europe | Medium term (2-4 years) |
| Source: Mordor Intelligence | |||
SKU proliferation drives specialized co-packing demand
Brand portfolios now contain hundreds of SKUs, resulting in increased line changeovers and shorter production runs. Contract bottlers that can reconfigure fillers within minutes and handle multi-format labeling attract long-term agreements. The Coca-Cola Company utilized specialized co-packers for its limited-edition functional variants in 2024, rather than retrofitting its internal plants. Facilities that combine high-speed multipack handlers, digital printing, and real-time traceability safeguard shelf presence and retailer compliance. As retailers shrink, category resets to quarterly cycles, flexible plants secure reliable utilization, reinforcing the beverage contract bottling and canning services market leadership in outsourced filling.
Ready-to-drink functional beverages reshape processing investment
Energy, protein, probiotic, and adaptogenic drinks require cold-fill aseptic lines, nitrogen dosing, and allergen-segregated ingredient rooms. Contract bottlers responding with in-house formulation labs capture end-to-end projects from concept validation to final palletization. Monster Beverage expanded its third-party alliances in 2024 to fast-track the development of kombucha-based SKUs without incurring capital exposure. Providers that secure certifications for organic, non-GMO, or plant-based claims command price premiums that outweigh added complexity, reinforcing above-market growth for functional filling services.
Asset-light strategies accelerate outsourcing adoption
PepsiCo deepened regional co-packing contracts to penetrate underserved cities across Asia and Latin America, redirecting internal funds from brand marketing to investing in digital infrastructure.[1]PepsiCo Inc., “Annual Report 2024,” PEPSICO.COM Emerging labels mirror the approach, renting capacity in micro-runs while gauging traction on digital shelves. As venture-backed beverage startups account for an increasing share of category innovation, an agile co-packing network becomes crucial, driving the beverage contract bottling and canning services market toward capacity expansion, even in mature geographies.
Aluminum can adoption accelerates through sustainability mandates
European Union single-use plastics directives and retailer scorecards reward recyclable formats, causing beverage companies to shift funding toward aluminum canning lines. Coca-Cola Europacific Partners invested EUR 40 million (USD 44.0 million) in refillables during 2024, reinforcing contract demand for multipurpose seaming and de-palletizing stacking systems. Bottlers that lock in recycled-content sheet contracts shield customers from supply volatility while meeting environmental, social, and governance disclosures, embedding them deeper into strategic planning cycles.
Restraints Impact Analysis*
| Restraint | (~) % Impact on CAGR Forecast | Geographic Relevance | Impact Timeline |
|---|---|---|---|
| Supply-Chain Disruptions in Aluminum and PET Resins | -0.8% | Global, with acute impact in Asia-Pacific and Europe | Short term (≤ 2 years) |
| Margin Pressure from Volatile Energy and Logistics Costs | -1.1% | Global, particularly severe in Europe and North America | Medium term (2-4 years) |
| Stringent Food-Safety Compliance Increasing Complexity | -0.6% | Global, with varying regional implementation timelines | Long term (≥ 4 years) |
| Limited Capacity for Aseptic Cold-Fill Lines in Emerging Regions | -0.9% | Asia-Pacific, South America, and Africa | Medium term (2-4 years) |
| Source: Mordor Intelligence | |||
Supply-chain volatility constrains production flexibility
Fluctuating aluminum premiums during 2024, caused by energy market swings, forced smaller co-packers to defer can line upgrades or pay surcharges that eroded margins. PET resin shortages linked to petrochemical plant outages triggered safety-stock accumulation, tying up working capital. Diversified sourcing agreements and hedging programs now differentiate scale players from regional rivals, yet the imbalance reduces near-term capacity additions in price-sensitive developing economies.
Energy cost inflation pressures operating margins
Utility and freight bills equal roughly 10% of the total co-packing cost. European contracts negotiated before the 2024 gas spike became unprofitable, motivating operators to install on-site solar arrays, waste-heat recovery systems, and automated conveyors that reduced kilowatt draw. High diesel rates also increased outbound freight charges at a time when beverage brands were demanding smaller, just-in-time shipments for e-commerce. Consolidation persists as operators seek economies of scale that can absorb input shocks without compromising service quality.
*Our forecasts treat driver/restraint impacts as directional, not additive. The impact forecasts reflect baseline growth, mix effects, and variable interactions.
Segment Analysis
By Beverage Type: Functional categories drive growth despite carbonated dominance
Carbonated soft drinks anchor revenue, holding 31.12% of the beverage contract bottling and canning services market share in 2025, sustained by decades-old agreements, proven high-speed fillers, and widespread flavor extensions. The beverage contract bottling and canning services market size, linked to these mainstream brands, remains sizable; however, incremental growth moderates as calorie-conscious shoppers favor low-sugar formats. Conversely, functional and energy beverages are projected to expand at an 7.99% CAGR through 2031, thereby elevating demand for aseptic towers, tunnel pasteurizers, and nitrogen flush systems that protect sensitive botanicals.
The diverging paths compel co-packers to balance legacy volume with specialty competence. Lines tailored to 16-ounce PET for soda can shift only slowly toward slim 12-ounce cans favored by functional drinks. Providers introducing universal clean-in-place regimes shorten changeovers and defend utilization. Alcohol-adjacent niches, such as ready-to-drink cocktails and hard seltzers, offer incremental, high-margin projects that leverage existing carbonation and technology, but require excise tax compliance and bonded storage.


By Packaging Type: Sustainability drives can acceleration despite bottle dominance
Bottles retain a 47.10% share, backed by entrenched retail channel preferences, strong price-to-performance economics, and versatile shapes that support promotional shrink sleeves. Nevertheless, cans chart the strongest trajectory, with a 7.71% CAGR, as regulators, retailers, and consumers converge on recyclability metrics. The beverage contract bottling and canning services market size tied to can formats benefits from lighter freight weight and faster chill times, attributes that resonate in e-commerce fulfillment and outdoor consumption occasions.
Contract bottlers retrofitting seaming blocks with smart torque sensors increase overall equipment efficiency by up to 8%, offsetting capex. Multi-material sites that can de-pal glass, PET, or aluminum on the same conveyor bank increase client retention. Tetra-top cartons and spouted pouches carve out experiments in kid-focused SKUs and shelf-stable coffee, but remain under 5% of total volume given filling speed constraints.
By Material Type: Aluminum surge challenges plastic dominance
Plastic continues to command 38.25% of the beverage contract bottling and canning services market share; however, brand scorecards that penalize the use of virgin polymers redirect budgets toward metal. Aluminum units are tracking a 8.86% CAGR, aided by closed-loop collection systems and can-to-can recycling claims that boost shelf appeal among eco-centric shoppers. The beverage contract bottling and canning services market size attached to glass remains flat, preserved by premium spirits and kombucha that exploit its oxygen barrier.
Co-packers exploit lightweighted PET preforms and rPET blends to slow attrition, yet European single-use plastics directives intensify scrutiny. Plants installing modular depalletizers tailored to both rPET and aluminum secure cross-material agility. Meanwhile, paper-based composite bottles emerge in pilot runs but require investment in ultrasonic sealing and barrier coatings before scaling up.
Geography Analysis
North America commands 37.10% of the global revenue, underpinned by long-standing outsourcing norms, advanced quality assurance frameworks, and proximity to the headquarters of global beverage brands. Niagara Bottling opened a USD 129.8 million facility in Kentucky in April 2025, integrating solar panels and closed-loop water recycling to mitigate operating costs. The project highlights how sustainability retrofits align with retailer scorecards demanding verified carbon disclosures. Continued growth is leaning toward value-added niches, such as zero-alcohol cocktails and functional waters that require specialized micronutrient dosing.
The Asia-Pacific region posts the fastest growth rate of 8.28% CAGR, as rising disposable income shifts consumption from tap water to branded beverages. Varun Beverages raised INR 7,500 crore (USD 900 million) in 2024 to establish multi-format greenfield plants across India, addressing the limited aseptic capacity. [2]Varun Beverages Limited, “Investor Presentation Q2 2025,” VARUNBEVERAGES.COM . Southeast Asia follows, with craft tea and coffee labels outsourcing for export-grade certifications. Still, fragmented cold-chain networks and disparate food safety codes heighten execution risk, so multinationals partner with experienced local operators to mitigate market entry risk.
Europe advances steadily, powered by aluminum can conversions linked to circular-economy rules. Coca-Cola Europacific Partners injected EUR 40 million (USD 44.0 million) into refillable infrastructure in 2024, signaling how policy accelerates capex toward reusable loops. South America plus Middle East and Africa remain emerging plays. Currency volatility elevates import costs for machinery, yet rising urban populations and modern retail proliferation nurture a pipeline of prospective outsourcing clients. Plants that combine returnable glass with single-use cans de-risk volume swings while meeting distributor mandates.

Competitive Landscape
The market shows moderate fragmentation. Top operators, led by Refresco Group, Coca-Cola Europacific Partners, and Niagara Bottling, utilize cross-border footprints, embedded R&D labs, and integrated material sourcing to secure multi-year contracts. Refresco acquired Tropical Bottling Company in Puerto Rico in October 2025 for USD 85 million, adding tropical fruit capabilities and extending its Caribbean coverage. This acquisition spree raises entry barriers by scaling quality systems and audit credentials necessary for multi-national compliance.[3]Fraser and Neave Limited, “Annual Report 2024,” FRASERANDNEAVE.COM
Mid-tier regional specialists defend share through micro-run flexibility, craft brand incubation, and short lead times. Southeast Bottling and Beverage invested USD 8 million in 2025 to outfit a 1,000-case pilot line that circulates cans, glass, and slim aluminum bottles on the same filler. Technology adoption, including vision-guided robotics and machine learning-based yield analytics, enables lean players to widen their gross margin amid raw material volatility.
Cost inflation spurs consolidation, especially where rising power prices and tightened food safety audits strain undercapitalized sites. Operators with renewable energy power-purchase agreements and closed-loop wastewater recovery systems record higher on-time delivery rates, bolstering renewal rates. Meanwhile, integrated aluminum can producers court bottlers with bundled supply contracts that hedge metal price swings and guarantee coil availability, weaving supply security deeper into brand value propositions.
Beverage Contract Bottling And Canning Services Industry Leaders
Refresco Group B.V.
Coca-Cola Europacific Partners plc
Niagara Bottling LLC
Pepsi Bottling Ventures LLC
Varun Beverages Ltd.
- *Disclaimer: Major Players sorted in no particular order

Recent Industry Developments
- October 2025: Refresco Group completed the acquisition of Tropical Bottling Company Puerto Rico operations for USD 85 million, expanding Caribbean presence and adding fruit-beverage capability.
- September 2025: Niagara Bottling announced a USD 160 million investment in a new Louisiana plant with advanced aluminum can lines and renewable-energy systems.
- August 2025: Coca-Cola Europacific Partners invested EUR 150 million (USD 165 million) to upgrade its Grigny, France facility with automated storage and retrieval, lifting capacity 40% while reducing energy consumption 25%.
- January 2025: Varun Beverages finalized the USD 120 million acquisition of BevCo South Africa, creating a launch pad for sub-Saharan expansion.


Global Beverage Contract Bottling And Canning Services Market Report Scope
| Carbonated Soft Drinks |
| Juices and Nectars |
| Functional and Energy Drinks |
| Water and Flavored Water |
| Alcoholic Beverages |
| Other Beverage Types |
| Bottles |
| Cans |
| Aseptic Cartons |
| Pouches and Sachets |
| Other Packaging Types |
| Paperboard |
| Plastic |
| Glass |
| Aluminum |
| Other Material Types |
| North America | United States | |
| Canada | ||
| Mexico | ||
| South America | Brazil | |
| Argentina | ||
| Chile | ||
| Rest of South America | ||
| Europe | United Kingdom | |
| Germany | ||
| France | ||
| Italy | ||
| Spain | ||
| Russia | ||
| Rest of Europe | ||
| Asia-Pacific | China | |
| India | ||
| Japan | ||
| South Korea | ||
| Australia | ||
| Rest of Asia-Pacific | ||
| Middle East and Africa | Middle East | Saudi Arabia |
| United Arab Emirates | ||
| Turkey | ||
| Rest of Middle East | ||
| Africa | South Africa | |
| Nigeria | ||
| Rest of Africa | ||
| By Beverage Type | Carbonated Soft Drinks | ||
| Juices and Nectars | |||
| Functional and Energy Drinks | |||
| Water and Flavored Water | |||
| Alcoholic Beverages | |||
| Other Beverage Types | |||
| By Packaging Type | Bottles | ||
| Cans | |||
| Aseptic Cartons | |||
| Pouches and Sachets | |||
| Other Packaging Types | |||
| By Material Type | Paperboard | ||
| Plastic | |||
| Glass | |||
| Aluminum | |||
| Other Material Types | |||
| By Geography | North America | United States | |
| Canada | |||
| Mexico | |||
| South America | Brazil | ||
| Argentina | |||
| Chile | |||
| Rest of South America | |||
| Europe | United Kingdom | ||
| Germany | |||
| France | |||
| Italy | |||
| Spain | |||
| Russia | |||
| Rest of Europe | |||
| Asia-Pacific | China | ||
| India | |||
| Japan | |||
| South Korea | |||
| Australia | |||
| Rest of Asia-Pacific | |||
| Middle East and Africa | Middle East | Saudi Arabia | |
| United Arab Emirates | |||
| Turkey | |||
| Rest of Middle East | |||
| Africa | South Africa | ||
| Nigeria | |||
| Rest of Africa | |||


Key Questions Answered in the Report
What is the current size of the beverage contract bottling and canning services market?
The beverage contract bottling and canning services market size is USD 11.28 billion in 2026 and is projected to reach USD 15.07 billion by 2031, growing at a 5.96% CAGR.
Which packaging format is growing fast for outsourced beverage filling?
Aluminum cans post the quickest rise with a 7.71% CAGR as brands switch to recyclable formats and premium functional drinks favor sleek can designs.
Why are functional beverages important to co-packers?
Functional and energy drinks expand at 7.99% CAGR, demanding specialized aseptic or cold-fill capabilities that reward co-packers investing in advanced processing.
What regions present the strongest growth potential?
Asia-Pacific leads with an 8.28% CAGR thanks to urbanization, rising income, and limited existing aseptic capacity.
How are sustainability mandates influencing material choices?
Regulatory pressure and retailer scorecards are driving a shift from PET to aluminum, which has higher recycling rates and supports closed-loop claims.
What factors currently limit industry profitability?
Volatile energy costs, logistics inflation, and raw-material supply disruptions compress margins, pushing operators toward renewable energy and long-term sourcing contracts.
Page last updated on:


