
Technology, Media and Telecom
5th MayPricing Strategy for Semiconductor Components
3 Min Read
The Bengaluru Data Center Market Report is Segmented by Data Center Size (Small, Medium, Large, Mega, Massive), Tier Standard (Tier 1 and 2, Tier 3, Tier 4), Absorption (Utilized by Colocation Type and End-User Industry, Non-Utilized). The Market Forecasts are Provided in Terms of MW Capacity.
Market Overview
| Study Period | 2019 - 2031 |
|---|---|
| Base Year For Estimation | 2024 |
| Forecast Data Period | 2025 - 2031 |
| Market Volume (2025) | 203.17 megawatt |
| Market Volume (2031) | 398.22 megawatt |
| CAGR | 11.87 % |
| Market Concentration | Medium |
Major Players *Disclaimer: Major Players sorted in no particular order. Image © Mordor Intelligence. Reuse requires attribution under CC BY 4.0. |
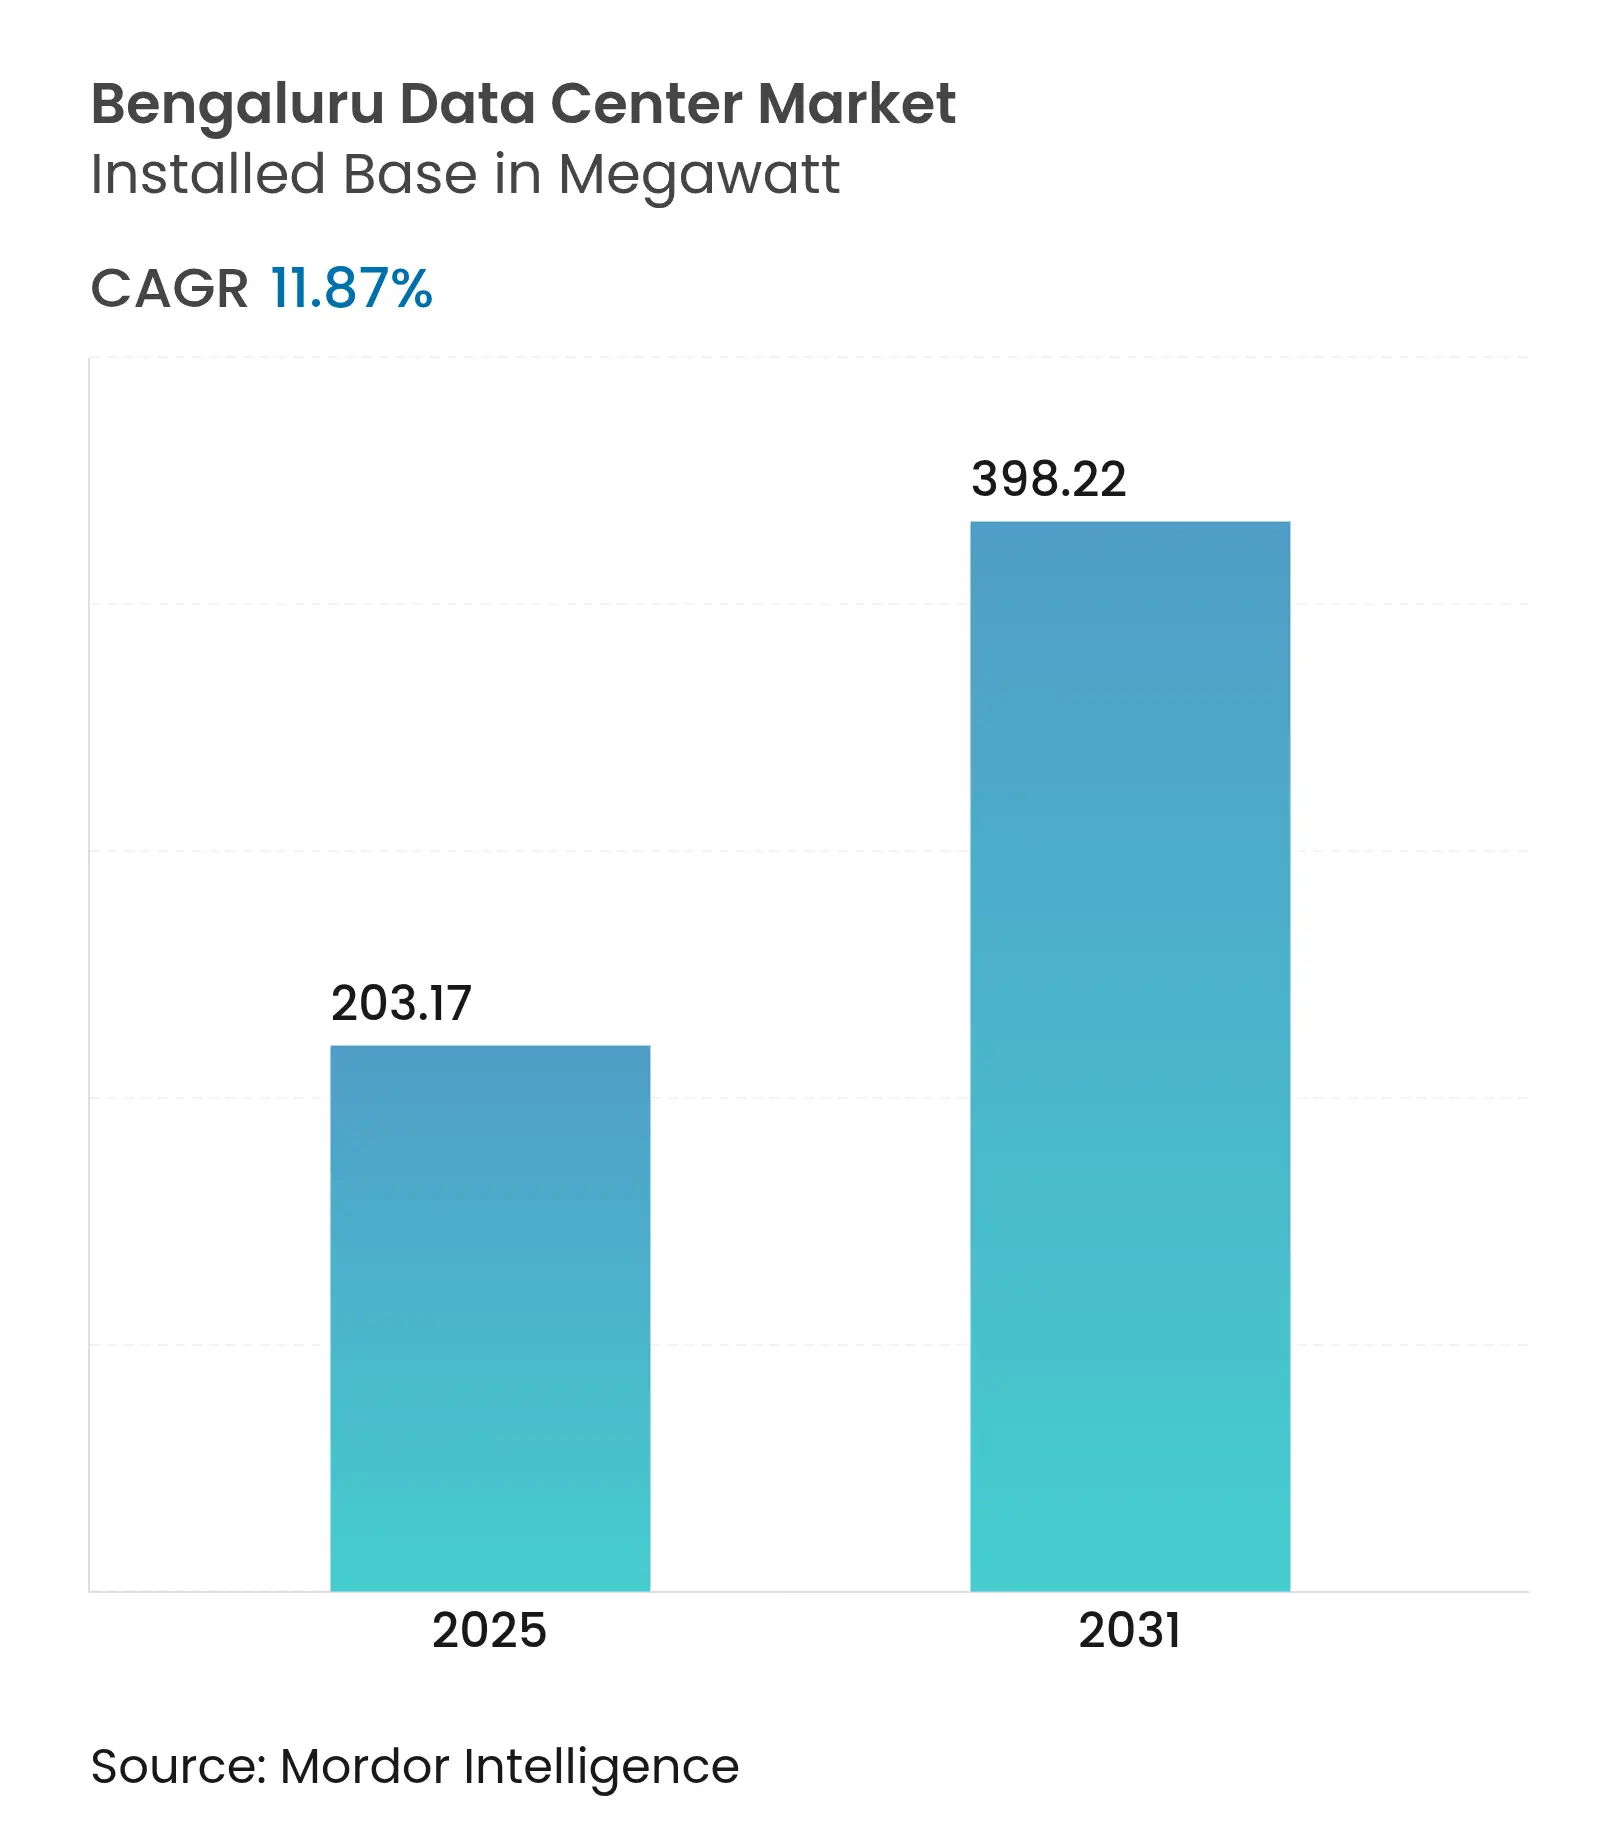
The Bengaluru data center market size is 203.17 MW in 2025 and is forecast to reach 398.22 MW by 2031, reflecting an 11.87% CAGR over the period. Robust hyperscale demand, an expanding 6 GW state renewables pipeline, and enforced data-localization rules combine to make Bengaluru the fastest-growing data-center cluster in India. Consolidation of GPU-dense AI workloads, rapid migration of enterprise IT estates from on-premises rooms to compliant colocation halls, and tariff waivers for open-access green power further reinforce the city’s competitive edge. Major builders now integrate liquid-cooling retrofits and modular-construction techniques to shorten delivery cycles and improve PUE. Rising outbound bandwidth at the Bengaluru Internet Exchange, coupled with three new subsea cable landings in Chennai, positions local facilities as a preferred edge node for video, gaming, and fintech traffic.
Key Report Takeaways
Drivers Impact Analysis
| DRIVER | (~) % IMPACT ON CAGR FORECAST | GEOGRAPHIC RELEVANCE | IMPACT TIMELINE | |||
|---|---|---|---|---|---|---|
Rising AI / GPU-dense cloud deployments from fintech and SaaS tenants Rising AI / GPU-dense cloud deployments from fintech and SaaS tenants | +2.8% | Bengaluru core, spill-over to Chennai, Hyderabad | Short term (≤ 2 years) | (~) % IMPACT ON CAGR FORECAST:+2.8% | GEOGRAPHIC RELEVANCE:Bengaluru core, spill-over to Chennai, Hyderabad | IMPACT TIMELINE:Short term (≤ 2 years) |
OTT video surge requiring greater than 20 Tbps outbound bandwidth at BLR IX OTT video surge requiring greater than 20 Tbps outbound bandwidth at BLR IX | +1.9% | Bengaluru metro, extending to Karnataka state | Medium term (2-4 years) | |||
Karnataka's 6 GW renewables pipeline and open-access tariff waivers Karnataka's 6 GW renewables pipeline and open-access tariff waivers | +2.2% | Karnataka state-wide, early gains in Bengaluru, Mysuru | Long term (≥ 4 years) | |||
Availability of 66 kV dedicated industrial corridors in Devanahalli Availability of 66 kV dedicated industrial corridors in Devanahalli | +1.4% | North Bengaluru, KIADB industrial zones | Medium term (2-4 years) | |||
Shift from enterprise on-prem to colo post-DPDPA compliance 2025 Shift from enterprise on-prem to colo post-DPDPA compliance 2025 | +2.1% | National, with concentration in Bengaluru tech corridor | Short term (≤ 2 years) | |||
Innovative liquid-immersion retrofit pilots at Whitefield campuses Innovative liquid-immersion retrofit pilots at Whitefield campuses | +0.8% | Bengaluru IT parks, selective hyperscale facilities | Long term (≥ 4 years) | |||
| Source: Mordor Intelligence | ||||||
Rising AI / GPU-dense cloud deployments from fintech and SaaS tenants
Fintech majors such as PhonePe have validated power-hungry GPU racks that cut energy use 26% via alternative cooling, encouraging peers to cluster workloads inside the Bengaluru data center market for sub-2 ms transaction latency.[1]Dell Technologies, “PhonePe Case Study,” dell.com SaaS vendors mirror this strategy, with Yotta launching an AI-centric GPU cloud locally that competes with international hyperscalers. The DPDPA localization rule reinforces in-country deployment, accelerating refresh cycles away from air cooling that is limited to 15 kW per rack. Together these forces lift rack densities past 60 kW and propel immersion-cooling retrofits city-wide.
OTT video surge requiring greater than 20 Tbps outbound bandwidth at BLR IX
Peak traffic at BLR IX now tops 20 Tbps during live sporting events, a direct result of mobile video representing 75% of India’s data usage.[2]Himanshi Lohchab, “New Subsea Cable Routes,” telecom.economictimes.indiatimes.com Three subsea systems—2Africa Pearls, IAX, and IEX—will quadruple international capacity by 2025, elevating Bengaluru’s role as an eastern content hub. CDN operators are therefore pre-leasing outer-ring facilities to cache 4K and emerging 8K assets closer to end users, raising power back-haul demand and driving premium colocation rates in the Bengaluru data center market.
Karnataka's 6 GW renewables pipeline and open-access tariff waivers
The state already derives more than 47% of generation from renewables.[3]Express News Service, “Karnataka Crossed 2030 Renewable Target,” newindianexpress.com Additions at Pavagada Solar Park and policy waivers that bypass distribution surcharges can cut data-center power bills 20%. Microsoft’s USD 3 billion green-cloud pledge confirms that hyperscalers will anchor future capacity in locations offering contractual access to solar and wind blocks. Grid stability receives further assurance through HVDC links supported by Hitachi Energy.
Shift from enterprise on-prem to colo post-DPDPA compliance 2025
Banks such as City Union have consolidated core IT in Rated-III halls at STT GDC to meet new fiduciary obligations. DPDPA defines strict breach-notification timelines and impact assessments that are cost-prohibitive for most standalone server rooms. Consequently, enterprises pivot toward carrier-neutral hubs that bundle ISO 27001 and SOC 2 controls, lifting utilization across the Bengaluru data center market.
Restraints Impact Analysis
| RESTRAINTS | (~) % IMPACT ON CAGR FORECAST | GEOGRAPHIC RELEVANCE | IMPACT TIMELINE | |||
|---|---|---|---|---|---|---|
Land-aggregation risk for 25-acre hyperscale campuses in North BLR Land-aggregation risk for 25-acre hyperscale campuses in North BLR | -1.8% | North Bengaluru, KIADB industrial corridors | Medium term (2-4 years) | (~) % IMPACT ON CAGR FORECAST:-1.8% | GEOGRAPHIC RELEVANCE:North Bengaluru, KIADB industrial corridors | IMPACT TIMELINE:Medium term (2-4 years) |
220 kV grid-connection queue greater than 18 months at KIADB substations 220 kV grid-connection queue greater than 18 months at KIADB substations | -2.1% | KIADB industrial areas, Devanahalli zone | Short term (≤ 2 years) | |||
Peak-monsoon flood zoning around Bellandur and Varthur lakes Peak-monsoon flood zoning around Bellandur and Varthur lakes | -1.2% | Southeast Bengaluru tech corridor | Medium term (2-4 years) | |||
Shortage of Tier-III-certified commissioning engineers Shortage of Tier-III-certified commissioning engineers | -0.9% | Bengaluru metro, extending to Karnataka state | Long term (≥ 4 years) | |||
| Source: Mordor Intelligence | ||||||
Land-aggregation risk for 25-acre hyperscale campuses in North Bengaluru
Fragmented titles and speculation have lifted land prices 40–60% since 2024, complicating contiguous parcel assembly needed for 100 MW road-mapped sites. BDA master-plan zoning further restricts approvals for heavy-utility projects near wetlands. Developers therefore weigh suburban lots against escalating flood hazards that could erode operating resilience in the Bengaluru data center market.
220 kV grid-connection queue greater than 18 months at KIADB substations
Demand for 50 MW+ blocks outpaces transformer-bay availability, pushing energization timelines past 18 months. Procurement delays for extra-high-voltage switchgear and permitting complexity add financing risk for pipeline projects in the Bengaluru data center market.
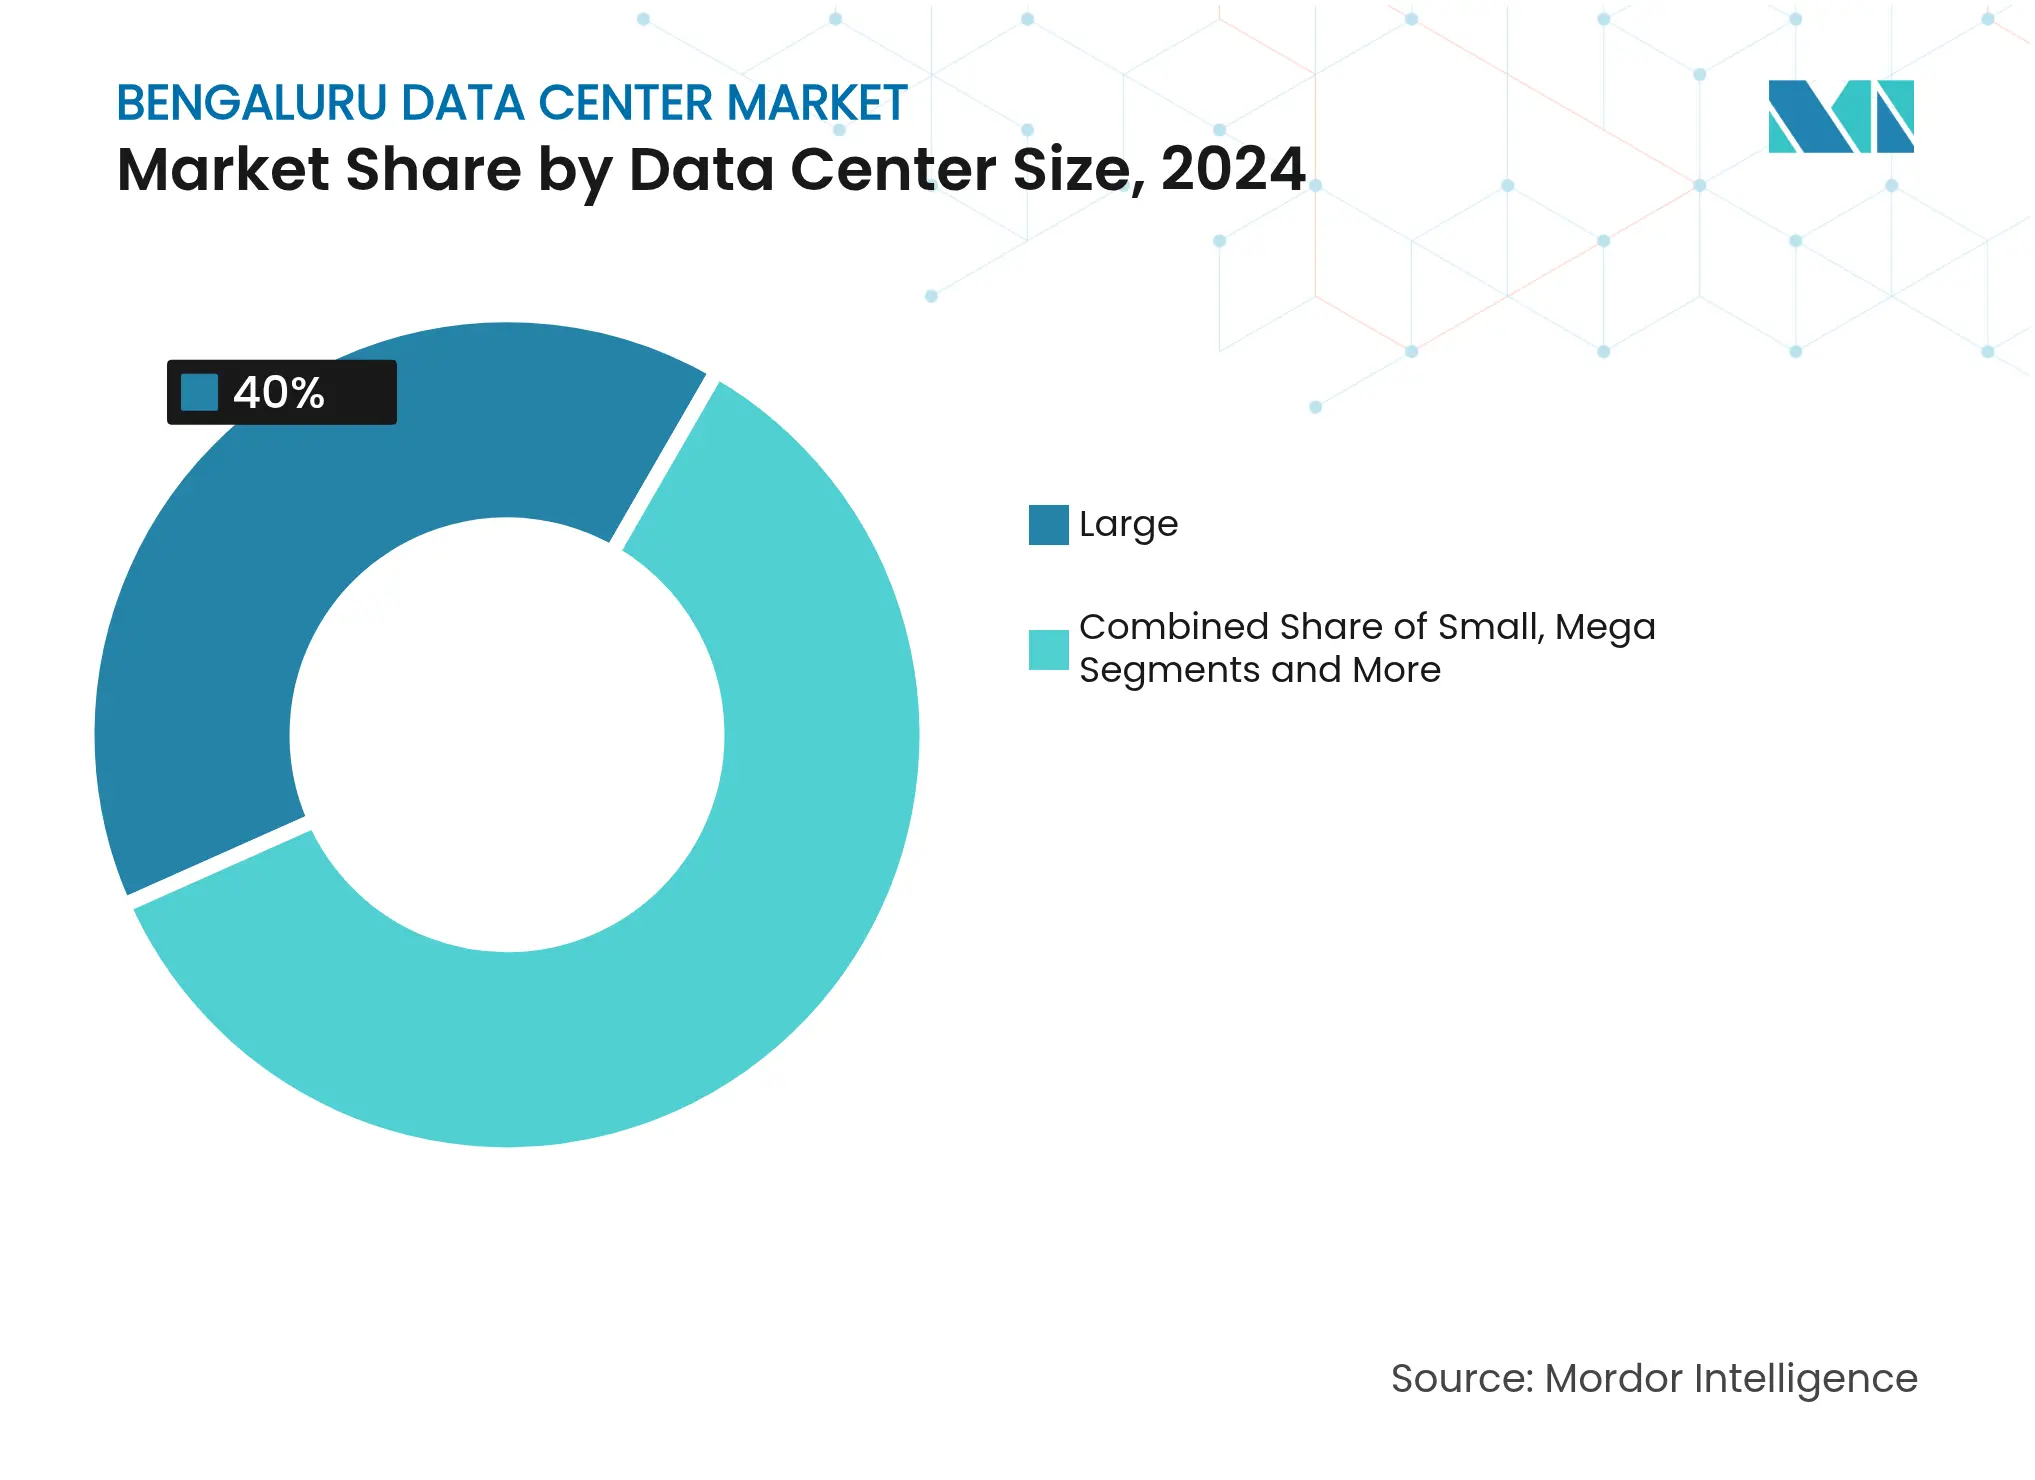
By Data Center Size: Large Leads, Massive Accelerates
Large halls accounted for 40% of the Bengaluru data center market share in 2024, reflecting legacy enterprise colocation footprints. The Massive cohort is forecast to scale at 11.89% CAGR to 2030 as hyperscalers seek economies in 50 MW blocks, with PUE trending below 1.15 through optimized airflow and liquid-cooling overlays. L&T’s planned 40 MW Whitefield build illustrates the pivot toward self-developed, high-density campuses. Operators favor such capacity to lock in renewable power contracts and meet escalating GPU rack densities that surpass 60 kW.
Cost per MW falls up to 18% when infrastructure is spread across 60 MW shells rather than 10 MW pods, reinforcing the shift. Segment consolidation also aligns with DPDPA compliance economics, since security tooling is amortized across larger IT loads, thereby improving the Bengaluru data center market size-to-opex ratio.
Note: Segment shares of all individual segments available upon report purchase
By Tier Standard: Tier III Dominates, Tier IV Gains Traction
Tier III facilities commanded 45% of the Bengaluru data center market size in 2024, offering 99.982% availability that satisfies most SaaS and IT workloads. Banking, fintech, and healthcare workloads, however, fuel 12.2% CAGR for Tier IV builds that guarantee 99.995% uptime through fault-tolerant topology. CtrlS’ Rated-4 launch in Kolkata affirms national appetite for advanced redundancy.
Compliance and insurance clauses increasingly mandate Tier IV hosting for payment-gateway and electronic-medical-record stacks, lifting pre-commit ratios for new builds. Continuous power modules and distributed redundant UPS lines, though capital-intensive, cut downtime penalties that can exceed USD 600,000 per hour, persuading CIOs to upgrade footprints within the Bengaluru data center market.
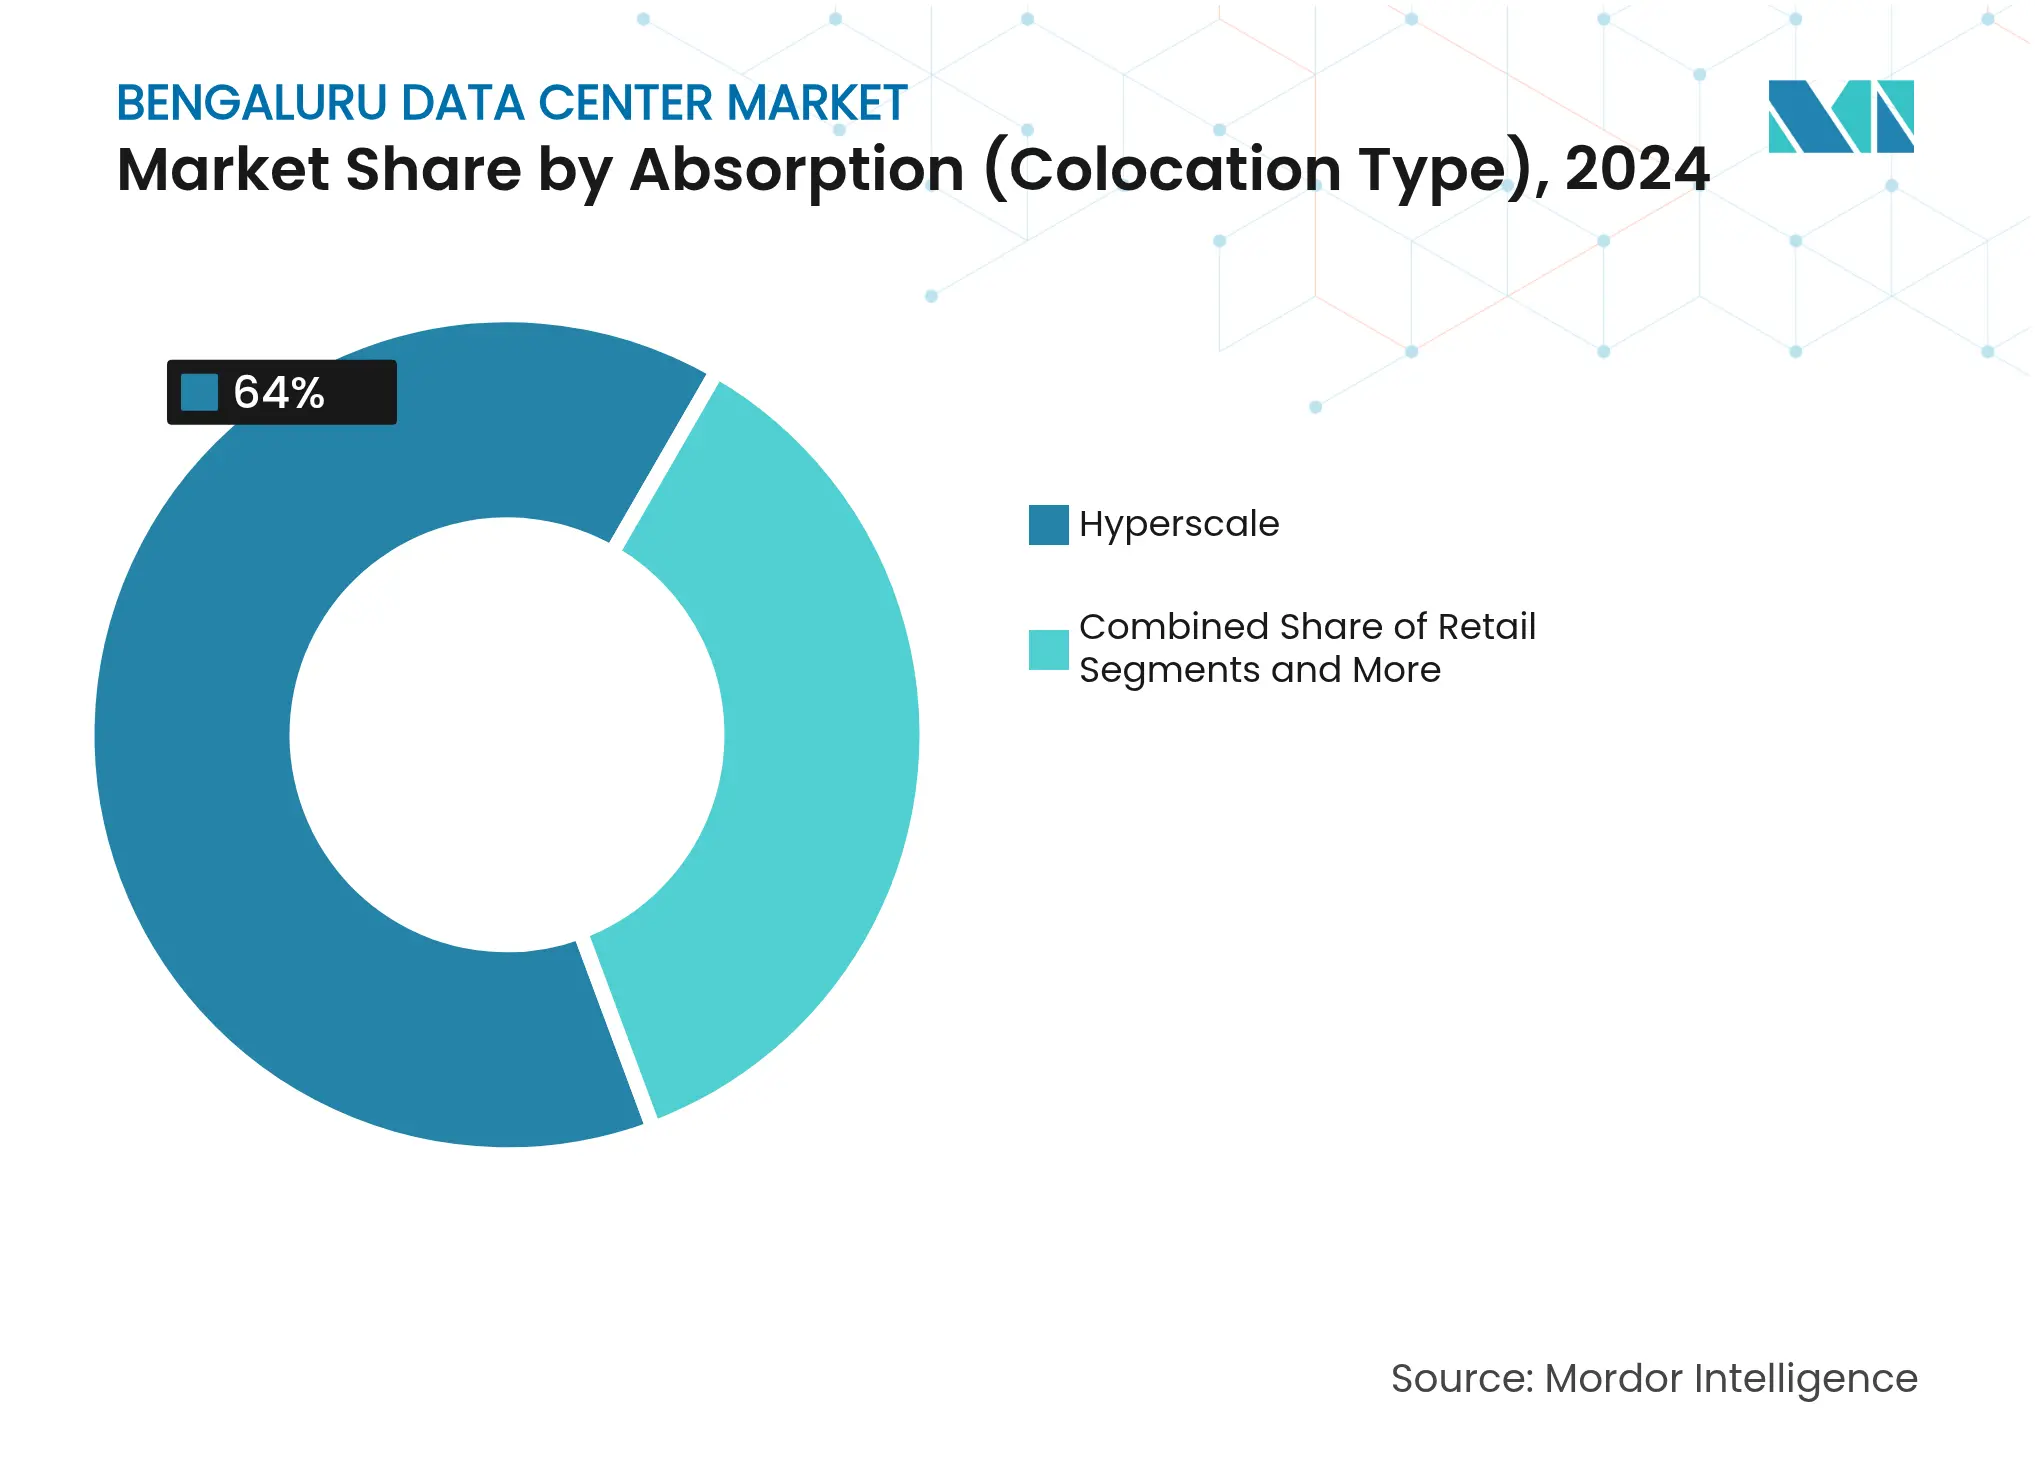
By Absorption (Colocation Type): Hyperscale Retains 64% Share
Hyperscale tenants consumed 64% of utilized capacity in 2024, encouraged by fit-out flexibility and landlord-financed power upgrades. Cloud titans negotiate 15-year blocks at INR 6,650–8,500 per kW per month, benefiting from volumetric discounts. Retail colocation serves SME digital-commerce workloads, while wholesale cages appeal to multinational integrators that require air-gapped compliance zones.
Demand diversification is visible; BFSI takes 35% of white space, IT firms 30%, and emerging AI studios the balance. This spread mitigates tenant-mix risk and underpins steady occupancy gains in the Bengaluru data center market.
Note: Segment shares of all individual segments available upon report purchase
By Absorption (End-User Industry): BFSI Commands Colocation Footprint
The Banking, Financial Services, and Insurance sector commands 35% of total colocation space in 2024, reflecting stringent regulatory requirements and mission-critical uptime demands that justify premium infrastructure investments. Cloud Service Providers represent the fastest-growing segment, driven by hyperscale expansion and AI infrastructure requirements that demand specialized cooling and power configurations. E-Commerce platforms accelerate data center adoption as digital transaction volumes surge, with companies like Flipkart migrating over 10 petabytes of daily data to cloud infrastructure to handle 7x traffic spikes during major sales events. Government sector demand intensifies through initiatives like NICSI's Rs 600 crore data center in Northeast India, expanding public sector digital infrastructure beyond traditional metros. Manufacturing, Media and Entertainment, and Telecom sectors contribute incrementally, with Manufacturing experiencing digital transformation acceleration as companies like NATCO Pharma modernize IT infrastructure through hyperconverged solutions.
Bengaluru hosts 79 MW of installed IT load and is set to double inside three years, mirroring South India’s projected 65% capacity lift by 2030. Its 3,000-ft elevation lowers chiller energy draw versus coastal peers, while sub-4 ms round-trip latency to Chennai’s cable landings anchors OTT and fintech workloads.
Karnataka’s Industrial Policy 2025-30 earmarks INR 750,000 crore incentives for data-center real-estate and allied skilling programs. Bengaluru’s technology workforce of 1 million supplies operating engineers, although only 35 local professionals currently hold Tier-III commissioning accreditation.
Challenges persist: seasonal water scarcity shapes cooling-plant design, traffic congestion stretches delivery timelines, and flood-plain constraints necessitate elevated floor-slab construction near Bellandur and Varthur lakes. Yet network effects—dense carrier hotels, mature supply chains, and peer universities—ensure the Bengaluru data center market maintains national leadership despite Tier-2 city competition.
Market Concentration
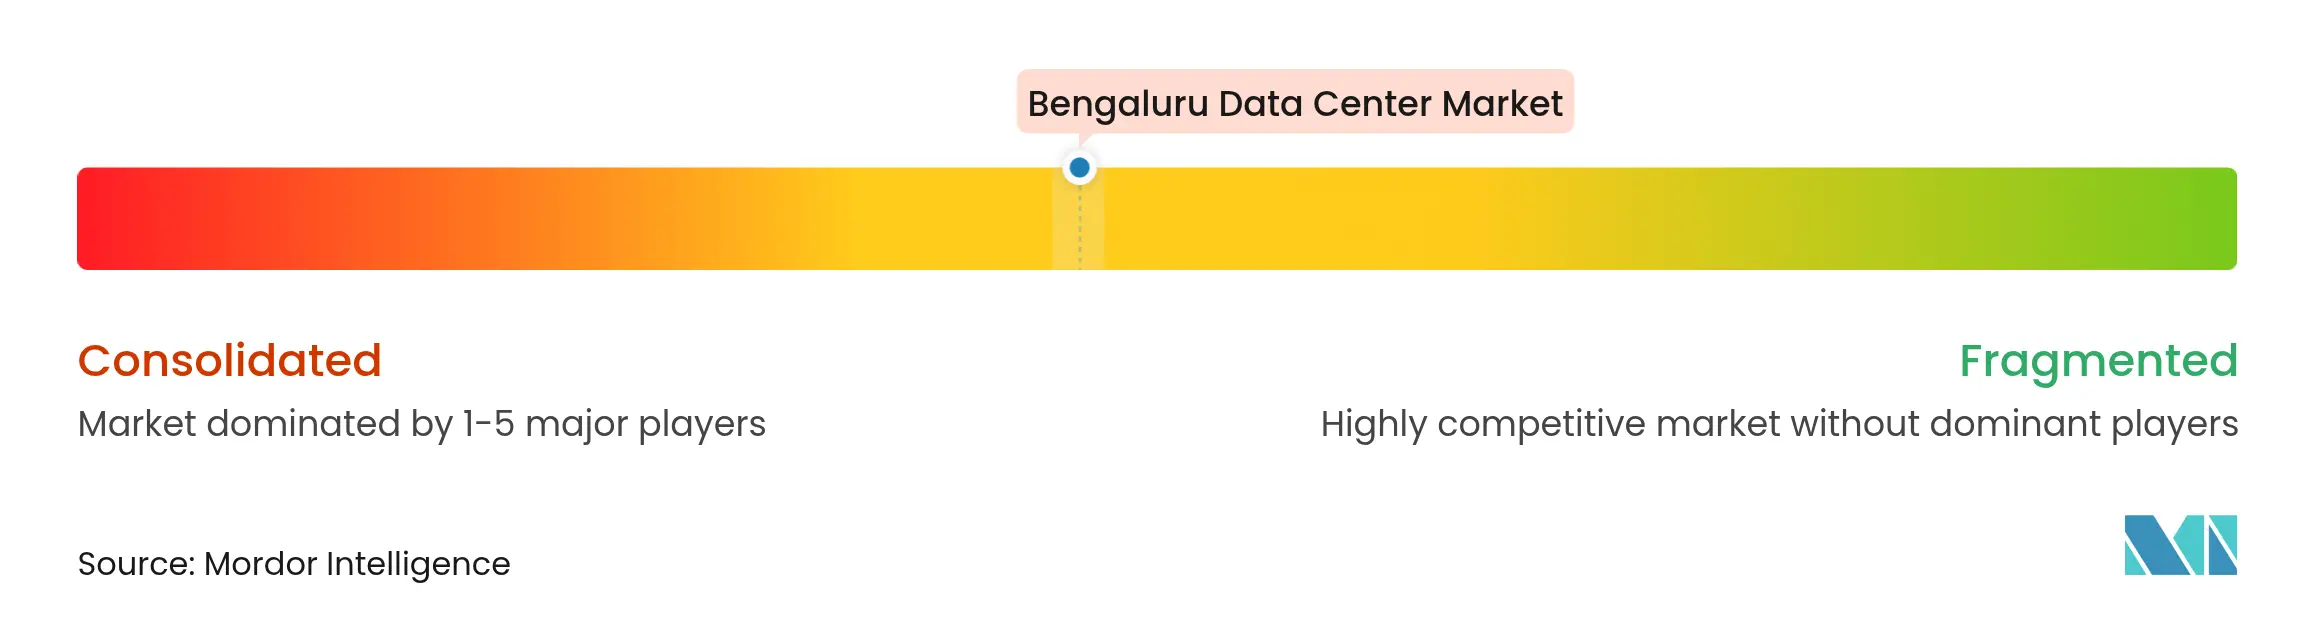
Moderate fragmentation defines the Bengaluru data center industry, with L&T, Tata Projects, and Shapoorji Pallonji competing alongside international EPCs such as Leighton Asia. L&T’s Cloudfiniti initiative bundles design-build with integrated operations, while Tata aligns with BSNL to tap underutilized telco assets.
LiquidStack, CoolIT, and other niche cooling innovators advance partnerships that promise PUE near 1.02, attracting hyperscalers keen to hit carbon-neutral targets. Patent activity accelerates, evidenced by CoolIT securing sensor and micro-channel flow IP that improves immersion-bath resilience.
Consolidation is expected as hyperscale tenants prefer single-vendor roll-outs across multi-city estates, rewarding builders that demonstrate fault-free delivery records and mature ESG reporting. Competitive bids now value supply-chain localization and renewable-energy hedging as much as headline cost per MW, guiding future hierarchy within the Bengaluru data center market.

*Disclaimer: Major Players sorted in no particular order
1. INTRODUCTION
2. RESEARCH METHODOLOGY
3. EXECUTIVE SUMMARY
4. MARKET LANDSCAPE
5. MARKET SIZE AND GROWTH FORECASTS (VALUE AND MW)
6. COMPETITIVE LANDSCAPE
7. MARKET OPPORTUNITIES AND FUTURE OUTLOOK
A data center is a physical room, building, or facility that holds IT infrastructure used to construct, run, and provide applications and services and store and manage the data connected with them.
The Bengaluru data center market is segmented by DC size (small, medium, large, massive, mega), by tier type (tier 1&2, tier 3, tier 4), by absorption (utilized (colocation type (retail, wholescale, hyperscale), end user (cloud & IT, telecom, media & entertainment, government, BFSI, manufacturing, e-commerce, and other end-users)), non-utilized).
The market sizes and forecasts are provided in terms of value (MW) for all the above segments.
Pricing Strategy for Semiconductor Components
3 Min Read
Accelerating Additive Manufacturing Adoption in India
3 Min Read
When decisions matter, industry leaders turn to our analysts. Let’s talk.