India Data Center Networking Market Size and Share
Market Overview
| Study Period | 2020 - 2031 |
|---|---|
| Forecast Data Period | 2026 - 2031 |
| Base Year Market Size (2025) | USD 1.36 Billion |
| Market Size (2026) | USD 1.59 Billion |
| Market Size (2031) | USD 3.45 Billion |
| Growth Rate (2026 - 2031) | 16.78% CAGR |
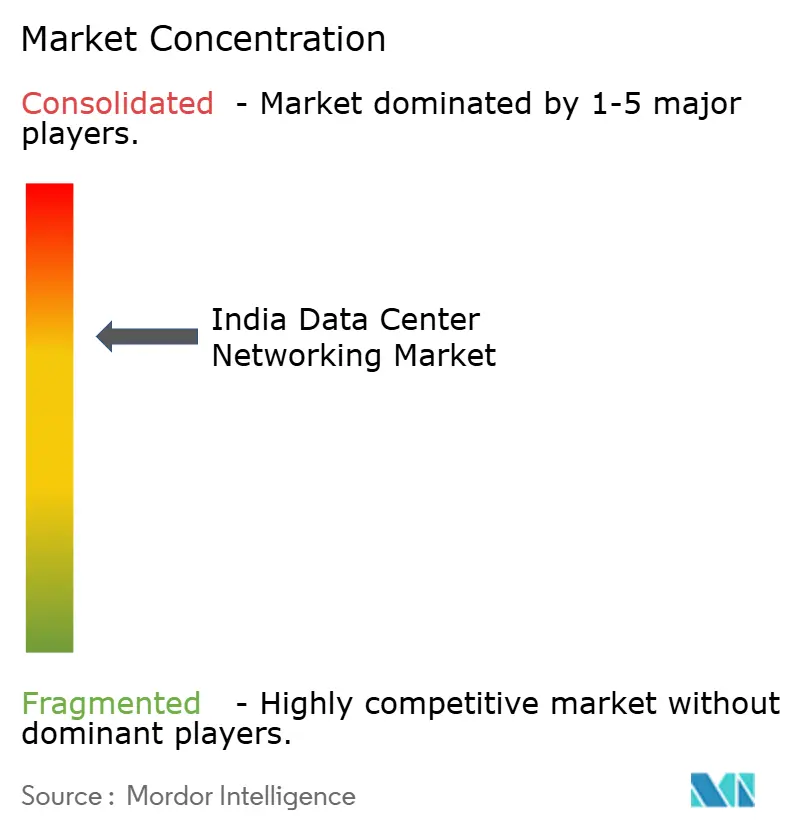
| Market Concentration | Medium |
Major Players *Disclaimer: Major Players sorted in no particular order Image © Mordor Intelligence. Reuse requires attribution under CC BY 4.0. | |

India Data Center Networking Market Analysis by Mordor Intelligence
The India Data Center Networking Market size was valued at USD 1.36 billion in 2025 and is estimated to grow from USD 1.59 billion in 2026 to reach USD 3.45 billion by 2031, at a CAGR of 16.78% during the forecast period (2026-2031).
This rapid scale-up reflects the convergence of mandatory data-localization rules, hyperscale campus build-outs, and the rollout of 5G and AI-ready infrastructure, all of which demand high-performance switching, routing, and optical systems. Investment momentum is reinforced by a government production-linked incentive framework that lowers the cost of building locally, while private operators race to deploy 400 GbE and 800 GbE fabrics that can handle AI training clusters. Edge-focused deployments serving 5G and Open Network for Digital Commerce (ONDC) traffic further intensify the need for distributed, software-defined control. On the supply side, global vendors have responded by setting up domestic manufacturing lines, yet power quality constraints and a shortage of senior networking talent outside the top metros remain structural bottlenecks. Against this backdrop, the India data center networking market offers strong upside for vendors able to deliver simplified, AI-optimized solutions that offset operational complexity.
Key Report Takeaways
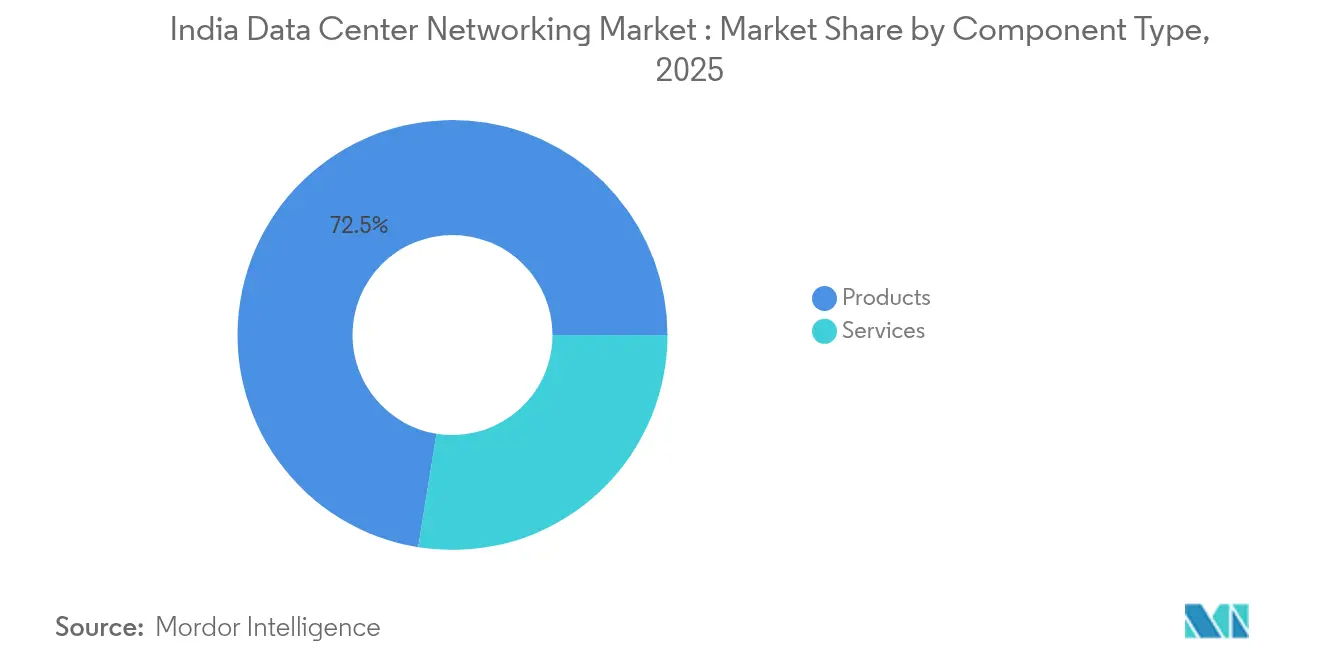
- By component, Products held 72.45% of India data center networking market share in 2025, while Services are projected to grow at a 20.7% CAGR through 2031.
- By end-user, IT & Telecommunications led with 36.02% revenue share in 2025; Manufacturing is advancing at a 19.6% CAGR to 2031.
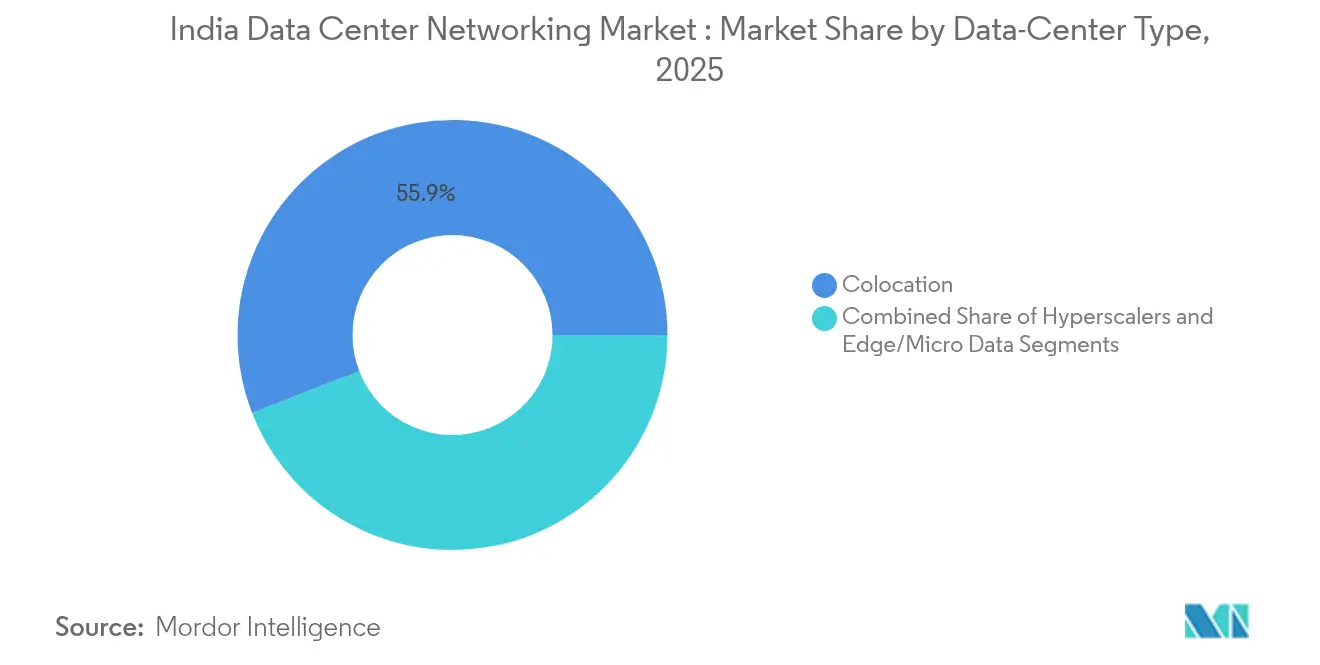
- By data-center type, Colocation facilities commanded 55.90% share of the India data center networking market size in 2025; Hyperscalers/Cloud Service Providers segment is expanding at 21.9% CAGR.
- By bandwidth, 50–100 GbE configurations accounted for 33.90% of the India data center networking market size in 2025, while greater than100 GbE deployments are rising at a 19.2% CAGR.
- Cisco, Juniper Networks, and Arista Networks collectively held 46.35% combined market share in high-performance switches during 2025, underscoring a moderately concentrated hardware tier.
Note: Market size and forecast figures in this report are generated using Mordor Intelligence’s proprietary estimation framework, updated with the latest available data and insights as of 2026.
Figures for India feed into a broader worldwide estimate rather than constituting a standalone measure. Mordor Intelligence’s data center networking market size captures this aggregation across all regions, globally.
India Data Center Networking Market Trends and Insights
Drivers Impact Analysis*
| Driver | (~) % Impact on CAGR Forecast | Geographic Relevance | Impact Timeline |
|---|---|---|---|
| Accelerated hyperscale campus build-outs by domestic conglomerates | +4.2% | Mumbai, Chennai, Hyderabad clusters | Medium term (2–4 years) |
| Mandatory data-localization under Digital Personal Data Protection Act 2023 | +3.8% | Nationwide | Long term (≥ 4 years) |
| Rapid 400 GbE / 800 GbE migration in cloud PoPs | +2.9% | Metro clusters and tier-2 spillover | Short term (≤ 2 years) |
| Low-latency edge nodes for 5G and ONDC | +2.1% | High-density urban zones | Medium term (2–4 years) |
| PLI-linked local manufacturing of optical and switching gear | +1.8% | Gujarat, Tamil Nadu, Karnataka hubs | Long term (≥ 4 years) |
| AI-optimized fabrics for Gen-AI clusters | +1.4% | Bengaluru, Hyderabad, Pune | Medium term (2–4 years) |
| Source: Mordor Intelligence | |||
Accelerated hyperscale campus build-outs by domestic conglomerates
Indian conglomerates have earmarked multibillion-dollar capital outlays to deploy nationwide hyperscale grids, alleviating land-scarcity pressures in crowded metros by distributing capacity across emerging tier-2 and tier-3 cities. Adani ConneX’s pledge to install 10 GW of IT load and ST Telemedia Global Data Centres’ plan to add 550 MW underline a supply pipeline that far exceeds historical norms.[1]RCR Wireless News staff, “AdaniConneX targets 10 GW Indian data-center play,” rcrwireless.com These campuses require ultra-dense leaf-spine fabrics, software-defined overlays, and campus-to-edge optical backbones capable of line-rate encryption. Operators also demand transparent telemetry for power and cooling because regional grids experience wider voltage swings. Vendors able to bundle switching, optics, and intent-based automation, therefore, gain a strategic edge in this phase of the India data center networking market.
Mandatory data-localization under Digital Personal Data Protection Act 2023
The Act enforces in-country processing for sensitive personal data, forcing multinational cloud and SaaS providers to replicate complete workloads inside India. The localisation rule drives a sharp uptick in intra-India east–west traffic as enterprises migrate from cross-border links to domestic availability zones, reinforcing growth momentum across the wider data center market in India.[2]Lexology editors, “Digital Personal Data Protection Act 2023: obligations for data fiduciaries,” lexology.com Latency ceilings tighten because workloads that formerly traversed submarine cables now stay within sovereign borders, requiring city-level interconnects and high-throughput encryption. In financial services and healthcare, regulators also mandate in-flight encryption across campus fabrics, spurring demand for MACsec-enabled switches and zero-trust segmentation engines.
Rapid 400 GbE / 800 GbE migration timelines in Indian cloud PoPs
Competitive parity with global hyperscalers has compressed upgrade roadmaps; domestic operators are transitioning from 100 GbE to 400 GbE/800 GbE within two refresh cycles. Cisco’s Silicon One-powered 64-port 800 G switch provides the building block for flatter, ultra-low-latency AI clusters.[3]Cisco Systems, “Silicon One G200 powers 800G switching,” cisco.com East-west traffic generated by large language model (LLM) training frequently saturates 100 GbE links, so operators adopt 4:1 oversubscription caps and deploy dynamic load balancing. High-speed optics also cut the number of cables, reducing rack congestion and operating costs vital in power-constrained tier-2 environments.
Low-latency edge nodes for 5G and ONDC commerce traffic
India’s 5G rollout and the ONDC mandate place real-time transaction processing at the network edge, often inside micro-facilities colocated with telco base stations. These nodes use Layer-4-7 service meshes to handle rapid traffic bursts from mobile commerce while enforcing deterministic latency caps below 15 ms. Packet-based load-balancers and container-aware firewalls, therefore, complement high-density leaf switches. Edge fabrics also rely on satellite microwave failover links in regions where fiber paths remain single-threaded, adding another design variable that increases the appeal of intent-based orchestration tools rely on satellite microwave failover links in regions where fiber paths remain single-threaded, adding another design variable that increases the appeal of intent-based orchestration tools.
Restraints Impact Analysis*
| Restraint | (~) % Impact on CAGR Forecast | Geographic Relevance | Impact Timeline |
|---|---|---|---|
| Chronic power-supply deficits in tier-2 DC clusters | -2.8% | Tier-2 and tier-3 cities across multiple states | Long term (≥ 4 years) |
| Long-cycle MoEF clearances for large DC campuses | -2.1% | National, particularly affecting greenfield projects | Medium term (2-4 years) |
| Scarcity of CCIE / JNCIE-level talent outside top metros | -1.9% | Non-metro areas, particularly in eastern and northeastern regions | Medium term (2-4 years) |
| Heightened capex due to rupee depreciation on imported optics | -1.5% | National, with higher impact on import-dependent operators | Short term (≤ 2 years) |
| Source: Mordor Intelligence | |||
Chronic power-supply deficits in tier-2 DC clusters
Frequent voltage fluctuations and multi-hour brownouts in second-tier cities compel operators to over-provision diesel generation and energy-storage systems, adding as much as 22% to capex per MW. High-speed optics and AI-optimized switches push rack power density above 20 kW, making battery runtime and transformer sizing critical. Although the National Broadband Mission earmarks USD 100 billion for grid upgrades, execution schedules stretch beyond the 2030 horizon, perpetuating risk for investors. Consequently, some hyperscalers adopt modular microgrid architectures with solar PV, but energy-yield variability complicates network capacity planning.
Scarcity of CCIE/JNCIE-level talent outside top metros
Advanced routing, software-defined segmentation, and GPU-cluster interconnects require deep protocol knowledge rarely found beyond Bengaluru, Mumbai, and Delhi. Operators thus incur relocation premiums or rely heavily on automation frameworks such as closed-loop intent validation. While the National AI Mission plans to train 10 million citizens in advanced ICT skills by 2028, short-term scarcity inflates day rates for freelance network architects by 35% year-on-year. Managed network services and remote hands contracts therefore grow rapidly, but they cannot fully substitute for on-site troubleshooting during cut-overs or power events.
*Our forecasts treat driver/restraint impacts as directional, not additive. The impact forecasts reflect baseline growth, mix effects, and variable interactions.
Segment Analysis
By Component: Services accelerate despite product dominance
Products contributed USD 985.32 million in revenue during 2025, equal to 72.45% of total spend, underpinned by large orders for 400 GbE-capable leaf and spine switches. The India data center networking market size for Services reached USD 374.68 million and is projected to expand 20.7% CAGR through 2031 as enterprises outsource integration, testing, and lifecycle management. Installation and integration workstreams represent over half of Services revenue because AI-ready fabrics require precision timing and lossless queue tuning. Managed network services appeal to mid-market cloud providers that lack in-house Layer-3/Layer-4 expertise. Cisco’s co-innovation with NVIDIA on end-to-end AI fabrics exemplifies a hardware-plus-services model that compresses deployment timelines.
Product vendors are simultaneously embedding telemetry agents to ease predictive maintenance, thereby blurring hardware-software boundaries. Field-replaceable optics produced locally under PLI subsidies shorten spares logistics, a decisive advantage in power-constrained tier-2 sites. Over the forecast period, professional services linked to zero-trust segmentation and intent-based orchestration will outpace traditional break-fix contracts.


By End-User: Manufacturing disrupts traditional IT leadership
IT & Telecommunications retained 36.02% share in 2025 as 5G backhaul upgrades and cloud availability-zone rollouts consumed high-capacity switches. Manufacturing, however, is set to log a 19.6% CAGR, propelled by Industry 4.0 data lakes, digital twins, and PLI incentives for electronics assembly. Automotive and semiconductor fabs now deploy deterministic Ethernet rings inside plants, driving fresh demand for low-latency aggregation switches. Banking and Financial Services continue steady upgrades to meet data-sovereignty guidelines, while Healthcare accelerates adoption of tele-ICU and robotic surgery workflows requiring encrypted 400 GbE uplinks. The diversity of use cases reduces concentration risk within the India data center networking market and spurs vendors to offer vertical-specific templates.
By Data-Center Type: Hyperscalers challenge colocation supremacy
Colocation campuses accounted for 55.90% of spend in 2025 as enterprises pursued asset-light models and connectivity-rich ecosystems. Yet hyperscalers show the strongest trajectory, compounding 21.9% annually because AWS, Microsoft, Google, and Adani ConneX are racing to localize AI training clusters. The India data center networking market share held by hyperscalers is expected to pass 40% before 2031 as fresh capacity comes online. Edge and micro-facilities, although small in rack count, multiply rapidly around 5G base-stations to host ONDC commerce caches and CDN termination points. Their growth reinforces demand for lightweight, remotely managed switching platforms with zero-touch provisioning.
By Bandwidth: High-speed migration accelerates
50–100 GbE links remained mainstream at 33.90% share in 2025, yet deployments above 100 GbE are scaling 19.2% CAGR on the back of AI workloads. The India data center networking market size attached to greater than 100 GbE lanes is forecast to reach USD 1.39 billion by 2031, equal to 40.25% of total spend. Operators are leapfrogging intermediate speeds to land directly on 800 GbE in high-density GPU pods. Keysight’s validation suites ensure lossless cut-overs, lowering risk for early adopters. Meanwhile, ≤10 GbE ports persist in some edge sites where fiber feeds remain limited, underscoring the fragmentary nature of network-upgrade cycles across India’s vast geography.
Geography Analysis
Mumbai alone houses 48% of installed IT load, leveraging submarine-cable gateways and strong power grids, yet land scarcity and premium real-estate costs push new builds toward Navi Mumbai and Thane. Chennai, Bengaluru, and the Delhi-NCR cluster comprise the next tier, collectively accounting for 38% of capacity. Hyderabad’s growth rests on proximity to semiconductor fabs and AI research parks. The western corridor dominates financial-services hosting; the southern belt excels in SaaS exports and chip design; the northern cluster hosts government data vaults and public-sector clouds.
Tier-2 cities such as Kochi, Jaipur, and Kolkata are emerging hot spots thanks to BharatNet fiber backbones and state-level tax incentives. CtrlS’s INR 2,200 crore, 60 MW campus in Kolkata exemplifies east-coast momentum. Equinix’s 33 MW renewable power purchase in Maharashtra illustrates how sustainability commitments shape site selection. Renewables integration is vital because creative tariff structures allow operators to mitigate grid unreliability while meeting ESG targets.
International connectivity further boosts the India data center networking market as new submarine cables land on both coasts, reducing latency to Asia-Pacific peers. The government’s USD 1.2 billion IndiaAI mission parcels funds to state innovation hubs, accelerating regional demand for AI-optimized fabrics. Collectively, these forces diffuse capacity beyond the traditional metro nexus, driving vendors to establish regional staging warehouses and co-locate technical staff.
Mordor Intelligence evaluates the data center networking market across all key regional markets, including North America, South America, and Middle East, with deeper country-level insights covering Philippines, Japan, United States, Brazil, Saudi Arabia, and Italy.
Competitive Landscape
Global vendors maintain scale advantages in silicon road-maps and software ecosystems, yet domestic firms gain ground through faster customization and localization rebates. Cisco, Juniper, and Arista together held 47% switch revenue in 2024, while Huawei faces import restrictions that limit traction. The proposed HPE–Juniper merger would combine server, storage, and routing lines under one roof, creating a full-stack alternative to Cisco for AI fabrics. NVIDIA’s Ethernet push blurs the line between compute and network, especially as Spectrum-X bundles herb packs with GPU clusters.
Local contenders such as Sterlite Technologies and Tejas Networks supply carrier-grade optics and packet-transport gear under the PLI umbrella. Adani ConneX’s vertically integrated strategy includes renewable power and undersea cable stakes, translating into differentiated SLAs for hyperscale tenants. Managed services providers like Sify Technologies capture mid-market clients who struggle with skills shortages, often wrapping SD-WAN and zero-trust edges into a single as-a-service bill.
Strategic moves during 2024–2025 spotlight AI alignment. Cisco invested in Gruve.ai to bolster application-layer inference libraries, while ST Telemedia Global Data Centres signed the country’s first AI City MoU with Uttar Pradesh. Vendor road-maps now prioritize telemetry, closed-loop automation, and compliance tool-chains that map directly to Digital Personal Data Protection audits. Competitive intensity remains high, but price erosion is partially offset by escalating port speeds and software-feature tiers.
India Data Center Networking Industry Leaders
Cisco Systems Inc.
Dell Technologies Inc.
Hewlett Packard Enterprise Company LP
Juniper Networks Inc.
Arista Networks Inc.
- *Disclaimer: Major Players sorted in no particular order

Recent Industry Developments
- April 2025: Adani Group pledged an additional USD 10 billion to scale national capacity to 10 GW, targeting Patna and Lucknow for edge data centers.
- April 2025: Cisco invested in Gruve.ai under its USD 1 billion AI program to accelerate secure enterprise AI adoption.
- March 2025: The Indian government approved an INR 22,919 crore PLI scheme for electronic sub-assemblies, set to attract INR 59,000 crore in capex and 91,600 jobs.
- February 2025: Cisco and NVIDIA unveiled cross-portfolio networking for AI data centers, integrating Silicon One into Spectrum-X.
- January 2025: India launched a fresh PLI scheme focused on telecom and optical equipment to back domestic data center builds.
- December 2024: STT GDC India and Uttar Pradesh agreed to develop the country’s first AI City with an INR 4,100 crore park in Noida.


Research Methodology Framework and Report Scope
Market Definitions and Key Coverage
Our study defines the India data center networking market as all physical and virtual switching, routing, storage-area networking, optical interconnects, application-delivery controllers, SDN controllers, and related management services deployed inside colocation, hyperscale, enterprise, and edge data centers to move packets between servers, storage, and the public Internet. We treat equipment refresh, green-field build-outs, and managed network services as in-scope expenditure.
Scope Exclusions: Consumer CPE, campus LAN gear, and carrier core/metro transport links that do not terminate in a data-center fabric are deliberately omitted.
Segmentation Overview
- By Component
- Products
- Ethernet Switches
- Routers
- Storage Area Network (SAN)
- Application Delivery Controllers (ADC)
- Network Security Appliances
- Software-Defined Networking (SDN) Controllers
- Optical Interconnects
- Services
- Installation and Integration
- Training and Consulting
- Support and Maintenance
- Managed Network Services
- Products
- By End-User
- IT and Telecommunications
- Banking, Financial Services and Insurance (BFSI)
- Government and Defense
- Media and Entertainment
- Healthcare and Life Sciences
- Manufacturing and Industrial
- Other End-Users
- By Data-Center Type
- Colocation
- Hyperscalers/Cloud Service Providers
- Edge/Micro Data Centers
- By Bandwidth
- Less Than equals to 10 GbE
- 25–40 GbE
- 50–100 GbE
- Greater Than 100 GbE
Detailed Research Methodology and Data Validation
Primary Research
Mordor analysts interviewed network architects at colocation operators, procurement leads at global cloud majors, and channel partners across Mumbai, Hyderabad, Bengaluru, and NCR. Conversations tested refresh cycles, ASP erosion, and 400 GbE adoption curves, letting us refine secondary assumptions and close data gaps unseen in published statistics.
Desk Research
We first collated publicly available indicators from respected bodies such as TRAI telecom statistics, MeitY data-localization circulars, NIXI IPv6 routing tables, RBI digital-payments dashboards, and TeleGeography cable-landing logs. Company 10-Ks, SEBI filings, and association portals (e.g., ISPAI, BSA) helped us size vendor revenues and unit flows. Paid libraries, including D&B Hoovers for supplier financials and Dow Jones Factiva for deal news, provided incremental clarity. This list is illustrative; many additional open and subscription sources were checked before numbers were locked.
Market-Sizing & Forecasting
We began with a top-down reconstruction of India-specific demand using installed rack counts, average switch ports per rack, and prevailing ASPs, which were cross-checked through sampled supplier roll-ups and channel checks. Key variables like planned IT-load (MW), domestic data traffic (PB/month), 5G base-station density, average rack power budgets, Ethernet port shipment mix, and rupee-denominated optics pricing drive the model. Multivariate regression against 2019-2024 historicals explained over 92% of variance; scenario analysis then adjusted the base case for currency moves and policy incentives. Bottom-up spot estimates from five large integrators validated totals and flagged under-reported service revenues, which were adjusted before final sign-off.
Data Validation & Update Cycle
Outputs pass anomaly screens, peer review, and leadership audit. Figures refresh each year; interim updates trigger when policy, capex, or FX swings breach preset bands. Just before release, an analyst re-checks key series so clients receive the freshest view.
Why Mordor's India Data Center Networking Baseline Commands Reliability
Published numbers often diverge because firms pick different gear baskets, discount curves, or refresh cadences.
Key gap drivers include: a) rival scopes fold in carrier transport routers, inflating totals; b) some models apply flat ASP deflation, while Mordor ties ASPs to port-speed mix; c) others freeze their base year longer, whereas Mordor revisits inputs annually; and d) several estimates convert currencies at invoice date, not uniform fiscal-year averages.
Benchmark comparison
| Market Size | Anonymized source | Primary gap driver |
|---|---|---|
| USD 1.36 B (2025) | Mordor Intelligence | - |
| USD 1.00 B (2024) | Regional Consultancy A | Excludes managed network services; limited rack census in tier-2 cities |
| USD 1.17 B (2024) | Trade Journal B | Uses global ASP averages and bundles WAN gear that never enters data-center floors |
In sum, Mordor's disciplined scope selection, variable-linked ASP tracking, and yearly refresh give decision-makers a balanced, transparent baseline they can retrace and stress-test with confidence.


Key Questions Answered in the Report
What is the current size of the India data center networking market?
The market generated USD 1.59 billion in 2026 and is on track to reach USD 3.45 billion by 2031, reflecting a 16.78% CAGR.
Which segment is expanding fastest within the India data center networking market?
Services, particularly installation and managed network operations, are rising at 20.7% CAGR as enterprises seek help deploying AI-ready fabrics.
How quickly are Indian operators adopting 400 GbE and 800 GbE?
Migration timelines have compressed to one or two refresh cycles, with greater than 100 GbE ports already growing at a 19.2% CAGR and poised to represent 40.25% of spend by 2031.
What role does data-localization play in market growth?
Mandatory in-country processing under the Digital Personal Data Protection Act 2023 forces multinationals to build local capacity, directly boosting demand for high-capacity, secure networking gear.
Why are tier-2 cities important to future growth?
Land scarcity and high power tariffs in metros are driving hyperscalers to invest in tier-2 hubs, which in turn require robust networking and edge-connectivity solutions.
Which vendors are leading in AI-optimized data center networking?
Cisco, NVIDIA, Juniper, and Arista lead the race by combining high-speed silicon with intent-based automation that lowers complexity in GPU-dense clusters.
Page last updated on:


