Battery As A Service Market Size and Share
Market Overview
| Study Period | 2020 - 2031 |
|---|---|
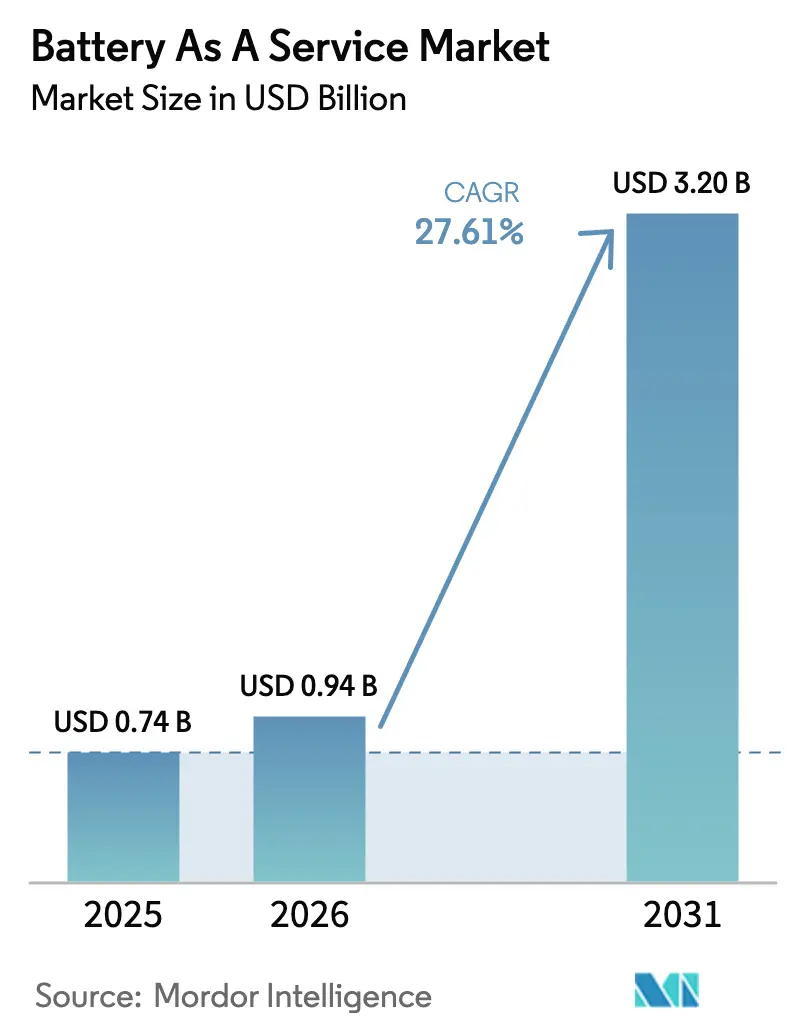
| Market Size (2026) | USD 0.94 Billion |
| Market Size (2031) | USD 3.2 Billion |
| Growth Rate (2026 - 2031) | 27.61% CAGR |
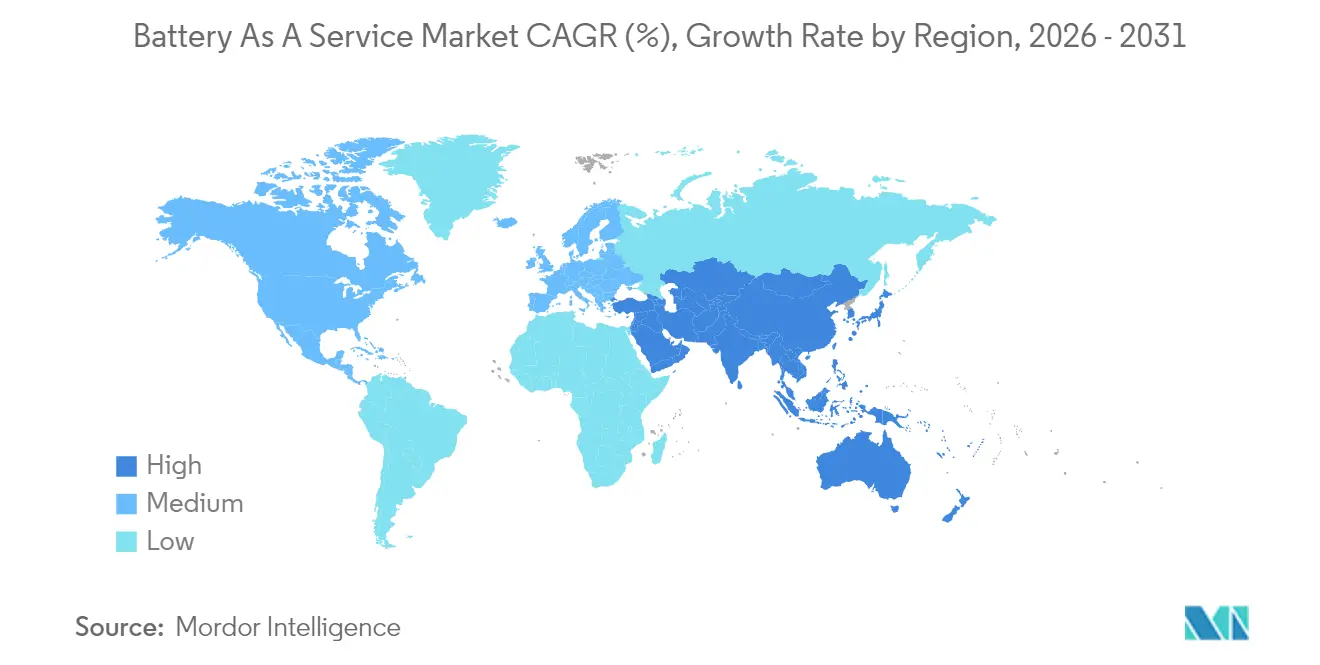
| Fastest Growing Market | Asia Pacific |
| Largest Market | Asia Pacific |
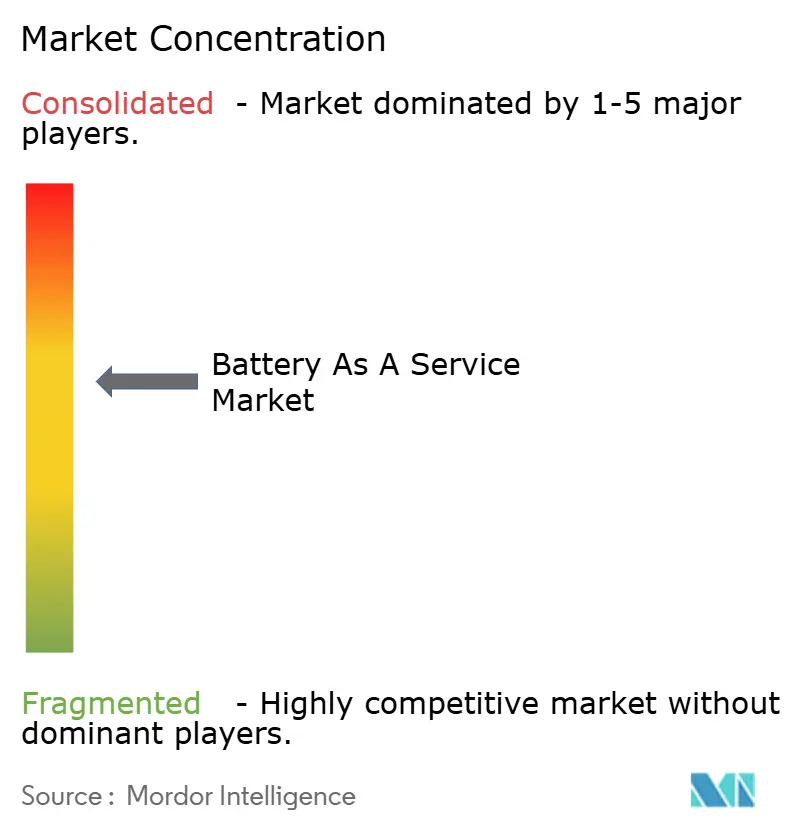
| Market Concentration | Medium |
Major Players *Disclaimer: Major Players sorted in no particular order Image © Mordor Intelligence. Reuse requires attribution under CC BY 4.0. | |
Battery As A Service Market Analysis by Mordor Intelligence
The Battery as a Service market size was valued at USD 0.74 billion in 2025 and estimated to grow from USD 0.94 billion in 2026 to reach USD 3.2 billion by 2031, at a CAGR of 27.61% during the forecast period (2026-2031). Cost parity is emerging as battery pack prices fell 20% to USD 115 per kWh during 2024, tipping project economics in favor of swapping networks for high-utilization vehicles. Converging policy incentives, falling component costs, and scaling investments in automated swap stations are combining to shift BaaS from pilot projects to mainstream infrastructure in dense urban corridors. Asia-Pacific’s lead position continues to reinforce the global roll-out as Chinese, Indian, and Thai initiatives anchor demand and stimulate supplier innovation. Fleet operators now view energy as a controllable cost center, prompting vertical integration moves that tighten competition and unlock ancillary grid-service revenues.
Key Report Takeaways
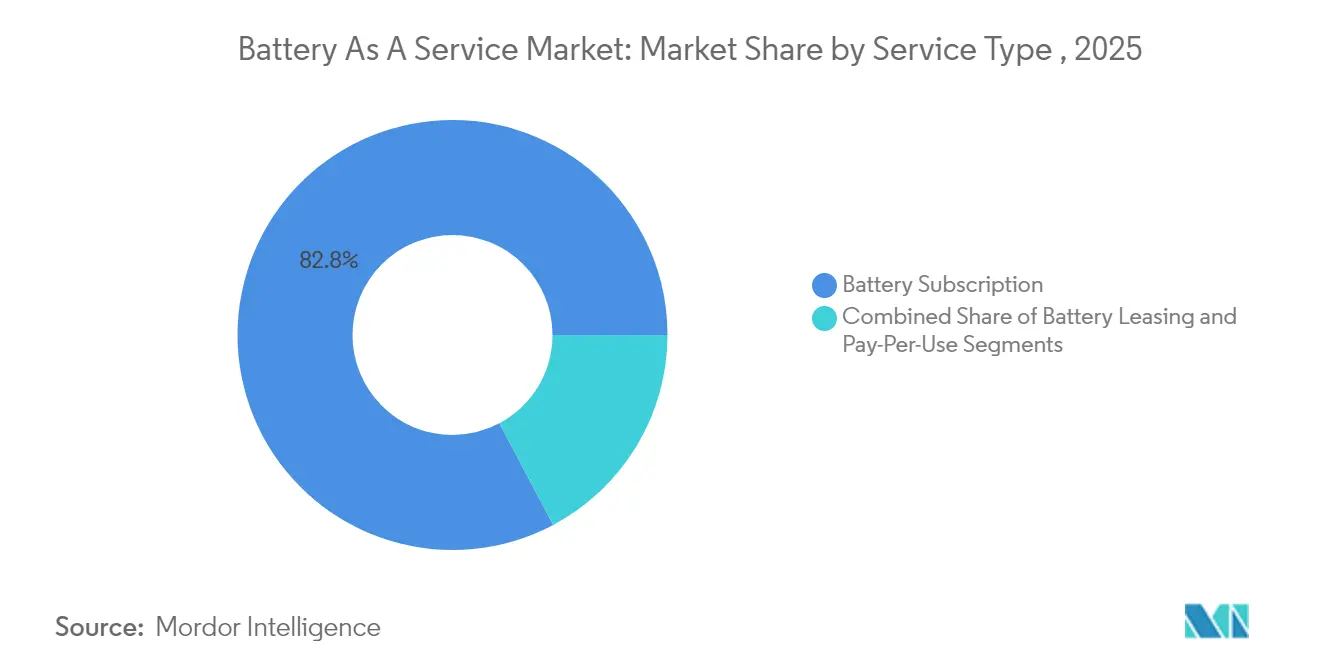
- By service type, battery subscription offerings held 82.76% of the Battery as a Service market share in 2025, while pay-per-use plans are projected to advance at a 34.65% CAGR to 2031.
- By vehicle type, three-wheelers captured 39.47% of the Battery as a Service market share in 2025; passenger cars are forecast to grow fastest at 33.05% through 2031.
- By battery capacity, packs below 50 kWh accounted for 43.28% of the Battery as a Service market size in 2025, whereas packs above 100 kWh are expected to post a 32.35% CAGR to 2031.
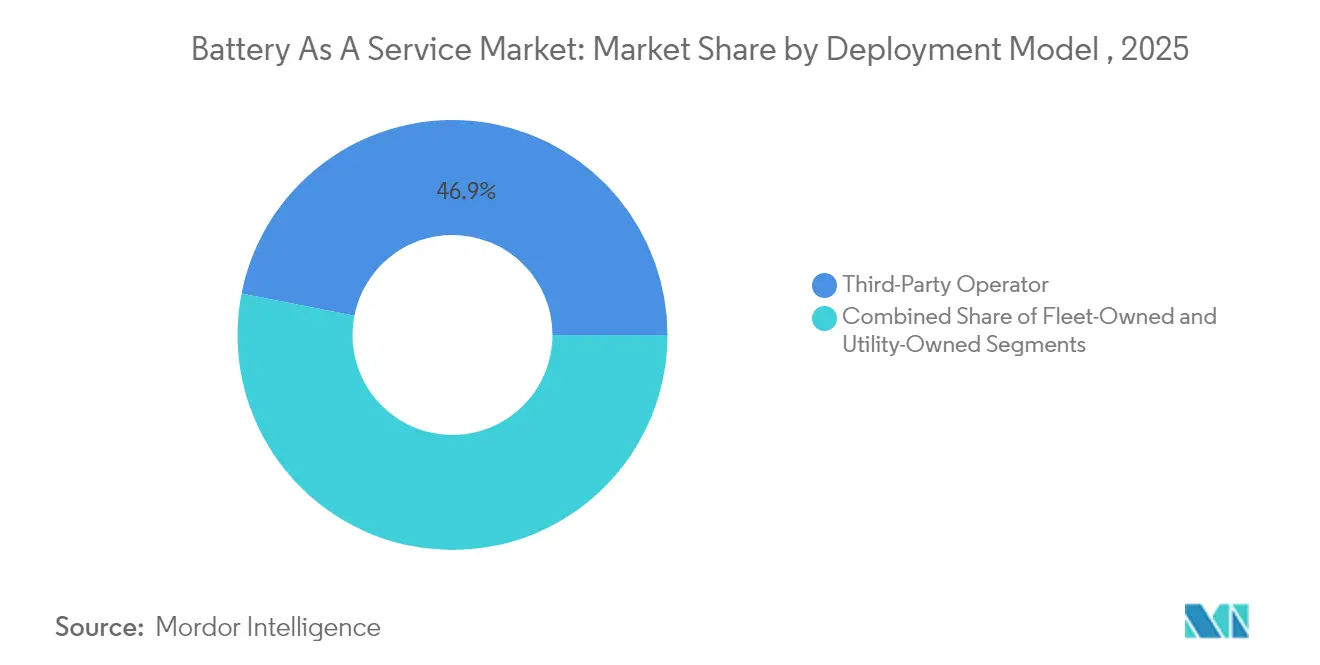
- By deployment model, third-party operators controlled 46.90% of the Battery as a Service market share during 2025, yet fleet-owned networks are set to expand at a 33.40% CAGR through 2031.
- By station automation level, fully automated systems commanded 64.62% of the Battery as a Service market share in 2025 and are progressing at a 32.75% CAGR, underscoring the premium on throughput and safety.
- By geography, Asia-Pacific led with 79.60% of the Battery as a Service market share in 2025; the same region is projected to expand at a 31.10% CAGR through 2031.
Note: Market size and forecast figures in this report are generated using Mordor Intelligence’s proprietary estimation framework, updated with the latest available data and insights as of 2026.
Global Battery As A Service Market Trends and Insights
Drivers Impact Analysis*
| Driver | (~) % Impact on CAGR Forecast | Geographic Relevance | Impact Timeline |
|---|---|---|---|
| Declining Battery Pack Prices Below USD 100/kWh | +4.2% | Global, strongest in price-sensitive Asia-Pacific and Africa | Medium term (2-4 years) |
| Government Subsidies and Mandates for Swapping Infrastructure | +3.8% | China, India, Thailand; expanding to Europe and North America | Short term (≤ 2 years) |
| Fleet Uptime and Total-Cost-of-Ownership Benefits | +3.1% | Global logistics hubs and taxi clusters | Short term (≤ 2 years) |
| Rapid Two-/Three-Wheeler Electrification | +2.9% | India, Indonesia, Vietnam, Philippines | Medium term (2-4 years) |
| OEM-linked Financing Bundles for BaaS Subscriptions | +2.1% | North America, Europe, premium Asia-Pacific cities | Medium term (2-4 years) |
| Second-life Revenue Stacking at Swap Stations | +1.7% | Europe, North America, Japan | Long term (≥ 4 years) |
| Source: Mordor Intelligence | |||
Declining Battery Pack Prices Below USD 100/kWh
Battery-cell manufacturing overcapacity and the broader use of lithium-iron-phosphate chemistries pushed average pack prices to USD 115/kWh in 2024, marking the sharpest single-year drop since 2017. Sub-USD 100 pricing expected by 2027 will lighten inventory financing for station operators and lower break-even utilization thresholds. Capital freed from battery purchases supports faster geographic buildouts and deeper price incentives for fleet clients. Falling costs also allow operators to rotate older packs out of mobile service sooner, preserving high service reliability. Overall, cheaper cells improve margins, quicken paybacks, and widen the market to price-sensitive commercial segments.
Government Subsidies & Mandates for Battery-Swapping Infrastructure
Regulatory activism is compressing investment risk and standardizing equipment interfaces. India’s January 2025 policy set GST concessions, uniform safety norms, and viability-gap funding worth up to 20% of site capex. Shanghai’s 40% capital subsidy, effective April 2025, pairs with monthly bonuses for taxis clocking more than 3,000 km on swap batteries. Thailand targets 1,450 open-protocol stations by 2030 under a UNEP-supported roadmap[1]“Thailand’s National Electric Mobility Roadmap,” United Nations Environment Programme, UNEP Reports, unep.org. These measures neutralize first-mover risk, harmonize technical standards, and speed network density. Clear policy signals also unlock cheaper debt, prompting private developers to scale beyond core metropolitan zones.
Fleet Uptime and Total-Cost-of-Ownership Benefits
Commercial mobility operators value time savings more than headline electricity rates. A swap restores range in 3–5 minutes versus the 30–60-minute stop typical of high-power charging. Battery leasing eliminates upfront pack purchases and shifts degradation liability to the service provider, lowering five-year fleet cost by 15–25%. Fixed-price energy plans ease budgeting and enable accurate bid pricing for delivery contracts. Shanghai taxi cooperatives record an 18% rise in daily revenue after converting to a swap service, proof that higher vehicle availability directly lifts turnover. These economics encourage larger fleets to migrate en masse, stabilizing station throughput for operators.
Rapid Two-/Three-Wheeler Electrification in Emerging Asia
Light vehicles dominate urban transport across India and Southeast Asia, making them fertile ground for swapping. Electric three-wheelers captured 57% of new Indian registrations in 2024, and government forecasts call for 26,000 kiosks by March 2026. Honda plans 500 stations for its ACTIVA e: program, using QR-code access and per-swap billing. Standard battery sizes around 3 kWh simplify inventory pooling, while courier and food-delivery services maintain the high turn-rates that underpin station profitability. Rapid urbanization keeps daily mileage high, and congestion constraints favor quick swaps over curbside chargers. Consequently, light-vehicle swapping is expected to anchor early cash flows in most emerging markets.
Restraints Impact Analysis*
| Restraint | (~) % Impact on CAGR Forecast | Geographic Relevance | Impact Timeline |
|---|---|---|---|
| High Capex for Dense Swap-Station Networks | -2.8% | Global; greatest in lower-density markets | Short term (≤ 2 years) |
| Absent Global Standards for Swappable Battery Formats | -2.1% | Worldwide; fragmentation severe outside China | Medium term (2-4 years) |
| IFRS-16 Lease Accounting Pressure on Balance Sheets | -1.4% | Developed markets with strict reporting rules | Medium term (2-4 years) |
| 800-V Ultra-fast Charging Eroding Swap Advantage | -1.9% | Premium vehicle segments in OECD markets | Long term (≥ 4 years) |
| Source: Mordor Intelligence | |||
High Capex for Dense Swap-Station Networks
A fully automated 600-battery site can cost up to INR 37 million (USD 444,000), double the outlay for a comparable direct-current fast-charge hub. Break-even requires roughly 60 daily swaps, yet utilization in many suburban stations averages half that figure. Retrofitting to add multi-brand compatibility costs RMB 200,000–300,000 (USD 27,500–41,300), stretching payback timelines and delaying standardization. The capital burden is most acute in sparsely populated corridors where investors hesitate to deploy ahead of demand. Operators cluster sites around logistics depots to secure baseline volume, but this approach limits consumer-facing convenience and slows mass adoption.
Absent Global Standards for Swappable Battery Formats
Lack of harmonized interfaces forces operators to stock parallel inventories, raising working-capital needs and complicating maintenance. ISO workstreams on pin layout, data protocols, and safety locks remain unsettled. Outside China, where CATL and NIO drive a national standard, cross-brand compatibility is still rare. Fragmentation stalls international fleet expansion because vehicles optimized for one region require costly redesign elsewhere. Until standards converge, network economies of scale will remain muted and operator margins will stay under pressure.
*Our forecasts treat driver/restraint impacts as directional, not additive. The impact forecasts reflect baseline growth, mix effects, and variable interactions.
Segment Analysis
By Service Type: Subscription Plans Underpin Revenue Visibility
The Battery as a Service market size for service-type offerings was led by subscription contracts that controlled 82.76% of revenue in 2025, translating to recurring billings from fleets and taxi cooperatives that favor flat operating budgets. Pay-per-use plans, while small, are scaling at a 34.65% CAGR as personal-vehicle owners value the freedom to pay only for occasional swaps during long-distance travel. Leasing variants sit between the two extremes, offering three- to five-year terms that appeal to seasonal delivery businesses seeking flexible fleet right-sizing.
Subscription preeminence flows from fleet demand for cost visibility; operators locked into multi-year city-logistics agreements compress margins by outsourcing battery risk for a predictable monthly fee. Ferrari’s luxury subscription, priced near USD 7,500 per annum, shows that even premium segments value convenience and risk transfer. As station density improves at urban fringes, occasional drivers increasingly experiment with per-swap billing, signaled by a 5.4% rise in individual membership registrations during 2025 in Shanghai alone. The interplay of long-term subscriptions for base demand and short-term passes for incremental traffic underpins platform liquidity and improves ROI forecasts for operators.


By Vehicle Type: Three-Wheelers Lead, Passenger Cars Grow Fastest
Three-wheelers emerged as the largest segment, capturing 39.47% of the Battery as a Service market share in 2025 as courier, ride-hailing, and urban-delivery operators favored standardized, swap-ready packs that minimize downtime. Passenger cars, by contrast, are projected to expand at a 33.05% CAGR through 2031 on the back of multi-brand station roll-outs across secondary Chinese cities and new swap-enabled models from mainstream OEMs. Commercial vans and light trucks show steady uptake as postal and grocery fleets install depot-level cages to avoid queuing.
Light-vehicle dominance owes much to standardized modules around 2.5 kWh that simplify logistics and inventory pooling. In contrast, passenger-car batteries above 60 kWh challenge lift-capacity constraints but become feasible once mechatronic handling systems are installed. Free2move’s Madrid pilot with Ample demonstrated five-minute exchanges for compact EVs engaged in car-sharing, pushing per-vehicle utilization up 22% over the six-month trial . A maturing pipeline of swap-capable sedans and crossovers foreshadows rising consumer adoption, moving the market from purely commercial utility toward an omnichannel energy-service proposition.
By Battery Capacity: Sub-50 kWh Packs Dominate, Large Modules Accelerate
In capacity terms, batteries under 50 kWh accounted for 43.28% of the Battery as a Service market share during 2025, mirroring scooter and tricycle volumes across Asia. The 50–100 kWh band services mainstream passenger vehicles and light commercial units, while >100 kWh modules, though nascent, are ramping at 32.35% CAGR due to electric buses and heavy-duty trucks seeking mid-route energy top-ups without grid surges.
Small-pack leadership will unlikely erode quickly because urban two-wheelers remain a primary mobility mode in populous economies. Nonetheless, CATL’s Choco-Swap ecosystem introduced a modular family that allows cell stacking to create 150 kWh variants, enabling long-haul class-8 trucks to change packs within ten minutes. Aligning handling robotics, cooling interfaces, and data protocols across such a wide capacity range sits at the heart of emerging platform standards, a factor that will influence long-term capital allocation by operators.
By Deployment Model: Third-Party Networks Hold Share, Fleets Internalize Energy
Third-party networks owned 46.90% of deployed stations in 2025, extracting value from multisector demand and brand-agnostic interoperability. Fleet-owned installations, however, are the fastest riser at 33.40% CAGR as large parcel couriers and ride-hailing giants invest directly to secure energy sovereignty and margin retention. Utility-owned nodes remain limited but present an intriguing hedge for power distributors looking to offset solar over-generation with daytime vehicle battery charging and nighttime grid discharge.
Partnerships between cell giants and petroleum retailers illustrate the leverage that infrastructure incumbents bring. CATL and Sinopec set a 10,000-station target, leveraging more than 30,000 forecourt locations that already offer high-capacity grid connections. The economic case for fleet-owned variants strengthens where daily kilometers exceed 350 and where proprietary scheduling software can guarantee station utilization. Third-party incumbents are responding through tiered pricing that rewards predictable fleet contracts while still accommodating casual drivers, a model that benefits overall ecosystem liquidity.
By Station Automation Level: Robotics Drive Scale and Safety
Automated systems dominated at 64.62% of installs in 2025, favored for their sub-five-minute swap cycles, 24-hour operation, and elimination of handling risks. Manual cabinets persist in peri-urban and rural settings where labor costs are low and traffic light. Automation’s 32.75% growth outlook indicates that robotics, computer vision, and cloud scheduling are considered essential to achieving the sub-five-year payback demanded by private investors.
NIO’s fourth-generation station demonstrated a 144-second exchange while servicing up to 480 swaps per day, thanks to AI-optimized lift platforms. These performance benchmarks set user expectations and raise barriers to entry, forcing smaller operators either to partner with equipment OEMs or focus on niche geographies. Meanwhile, modular robotics innovations reduce assembly cost and enable on-site upgrades, reinforcing a virtuous cycle of efficiency gains that help close the business-case gap in suburbs and highway corridors.
Geography Analysis
Asia-Pacific retained 79.60% regional dominance in 2025 and is expected to sustain a 31.10% CAGR through 2031, driven primarily by China’s aggressive network build-out and emerging policy replication across India and Thailand. China hosts over 85% of operational swap stations worldwide, anchored by NIO’s 3,172-site footprint and CATL’s commitment to 30,000 stations by 2030. India’s January 2025 national guidelines, coupled with preferential GST rates on swap batteries, sparked a 24% quarter-on-quarter rise in new station permits, indicating strong regulatory pull.
Europe and North America remain early-stage but are pivoting from curiosity to focused pilots. Madrid’s Free2move car-sharing fleet achieved 95% uptime after installing Ample’s modular swap pods, persuading regulators to streamline building permits for additional urban sites. In the United States, last-mile delivery giant FedEx has initiated a five-station trial in Los Angeles to assess swap feasibility for its E-Cargo van cohort, leveraging nighttime battery storage for grid stabilization under a utility demand-response contract. Such proof points hint at a multi-city rollout if operational metrics match lab projections.
South America and Middle East and Africa remain nascent but exhibit leapfrog potential. Nairobi’s boda-boda sector experiments with modular scooter packs, while Sao Paulo’s municipal bus authority studies depot-based swap cages to maximize route adherence during peak electricity tariffs. In regions where grid resilience is uneven, the capacity to push-pull kilowatts from stationary swap batteries offers an alluring resilience hedge, possibly accelerating adoption once total cost of ownership parity is attained.

Competitive Landscape
The Battery as a Service competitive arena is moderately concentrated, anchored by early movers that leverage proprietary robotics, vertically integrated cell production, and long-term financing packages to lock in OEM partnerships. NIO bundles a comprehensive leasing plan that separates vehicle purchase from energy subscription, widening its addressable base while ensuring predictable downstream revenue. CATL extends its influence by licensing the Choco-Swap standard to nearly 100 partners, creating a de facto reference architecture that speeds multi-brand compatibility.
Strategic collaboration defines competitive dynamics. Sinopec’s fuel-station footprint, ABB’s power-electronics expertise, and JD Logistics’ parcel volume combine to produce hybrid business models that blend energy retailing, asset management, and data monetization. Operators vie on throughput, reliability, and ecosystem services such as battery analytics dashboards, residual-value guarantees, and carbon-credit aggregation. Intellectual-property filings concentrate on thermal management, quick-lock couplings, and predictive maintenance algorithms, signaling the industry’s shift toward digital differentiation.
Challenger entrants include modular-battery start-ups targeting micro-mobility, real-estate developers seeking amenity differentiation, and power utilities piloting swap-plus-storage hybrids. Competitive tempo is likely to intensify as pack prices fall, financing tools mature, and policy frameworks coalesce, ultimately favoring players with the capital heft and logistical acumen to blanket priority corridors while sustaining high service standards.
Battery As A Service Industry Leaders
NIO Power
Gogoro Inc.
Immotor Technology
Sun Mobility Private Limited
Ample, Inc.
- *Disclaimer: Major Players sorted in no particular order

Recent Industry Developments
- May 2025: ABB launched Battery Energy Storage Systems-as-a-Service, bundling zero-capex stationary storage with performance guarantees for commercial and industrial clients.
- April 2025: CATL and Sinopec agreed to install 500 battery swap stations within 2025 and outlined a long-term roadmap for 10,000 co-branded sites.


Global Battery As A Service Market Report Scope
Battery-as-a-Service (BaaS) revolutionizes electric vehicle (EV) ownership by replacing the expensive battery component with a subscription-based infrastructure. This system enables users to effortlessly exchange a depleted battery for a fully charged one at designated swapping stations.
The battery as a service market is segmented by service type, vehicle type, battery capacity, and geography. By service type, the market is segmented into battery subscription, battery leasing, and pay-per-use. By vehicle type, the market is segmented into passenger cars, two-wheelers, three-wheelers, and commercial vehicles. By battery capacity, the market is segmented into less than 50 kWh, 50-100 kWh, and more than 100 kWh. By geography, the market is segmented into North America, Europe, Asia-Pacific, and Rest of the World.
The report offers market size and forecasts for the battery as a service market in value (USD) for all the above segments.
| Battery Subscription |
| Battery Leasing |
| Pay-Per-Use |
| Passenger Cars |
| Two-Wheelers |
| Three-Wheelers |
| Commercial Vehicles |
| Below 50 kWh |
| 50 to 100 kWh |
| Above 100 kWh |
| Fleet-Owned |
| Third-Party Operator |
| Utility-Owned |
| Manual Swap |
| Automated Swap |
| North America | United States |
| Canada | |
| Rest of North America | |
| South America | Brazil |
| Argentina | |
| Rest of South America | |
| Europe | Germany |
| United Kingdom | |
| France | |
| Spain | |
| Italy | |
| Russia | |
| Rest of Europe | |
| Asia-Pacific | China |
| India | |
| Japan | |
| South Korea | |
| Rest of Asia-Pacific | |
| Middle East and Africa | Saudi Arabia |
| United Arab Emirates | |
| South Africa | |
| Nigeria | |
| Rest of Middle East and Africa |
| By Service Type | Battery Subscription | |
| Battery Leasing | ||
| Pay-Per-Use | ||
| By Vehicle Type | Passenger Cars | |
| Two-Wheelers | ||
| Three-Wheelers | ||
| Commercial Vehicles | ||
| By Battery Capacity | Below 50 kWh | |
| 50 to 100 kWh | ||
| Above 100 kWh | ||
| By Deployment Model | Fleet-Owned | |
| Third-Party Operator | ||
| Utility-Owned | ||
| By Station Automation Level | Manual Swap | |
| Automated Swap | ||
| By Geography | North America | United States |
| Canada | ||
| Rest of North America | ||
| South America | Brazil | |
| Argentina | ||
| Rest of South America | ||
| Europe | Germany | |
| United Kingdom | ||
| France | ||
| Spain | ||
| Italy | ||
| Russia | ||
| Rest of Europe | ||
| Asia-Pacific | China | |
| India | ||
| Japan | ||
| South Korea | ||
| Rest of Asia-Pacific | ||
| Middle East and Africa | Saudi Arabia | |
| United Arab Emirates | ||
| South Africa | ||
| Nigeria | ||
| Rest of Middle East and Africa | ||


Key Questions Answered in the Report
What is the current size of the Battery as a Service market?
The market was valued at USD 0.94 billion in 2026 and is projected to reach USD 3.2 billion by 2031.
Which region dominates the Battery as a Service landscape?
Asia Pacific leads with 79.60% market share in 2025 and is expected to maintain a 31.10% CAGR through 2031.
Why are subscription models so prevalent in Battery as a Service?
Subscriptions secure predictable monthly energy costs, aligning with fleet budgeting requirements and covering 82.76% of 2025 revenue.
How fast can a modern battery swap be completed?
Automated fourth-generation stations exchange a passenger-car pack in roughly 144 seconds, enabling up to 480 daily swaps.
Page last updated on:


