Automotive Radar Market Size and Share
Market Overview
| Study Period | 2020 - 2031 |
|---|---|
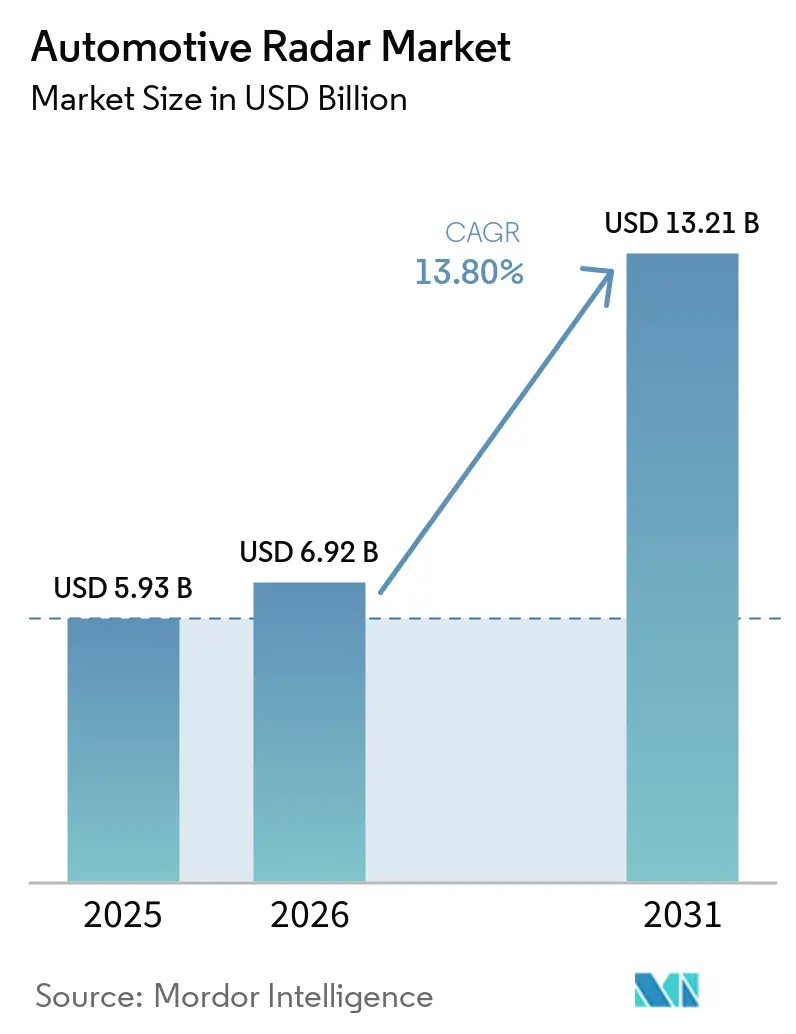
| Market Size (2026) | USD 6.92 Billion |
| Market Size (2031) | USD 13.21 Billion |
| Growth Rate (2026 - 2031) | 13.80% CAGR |
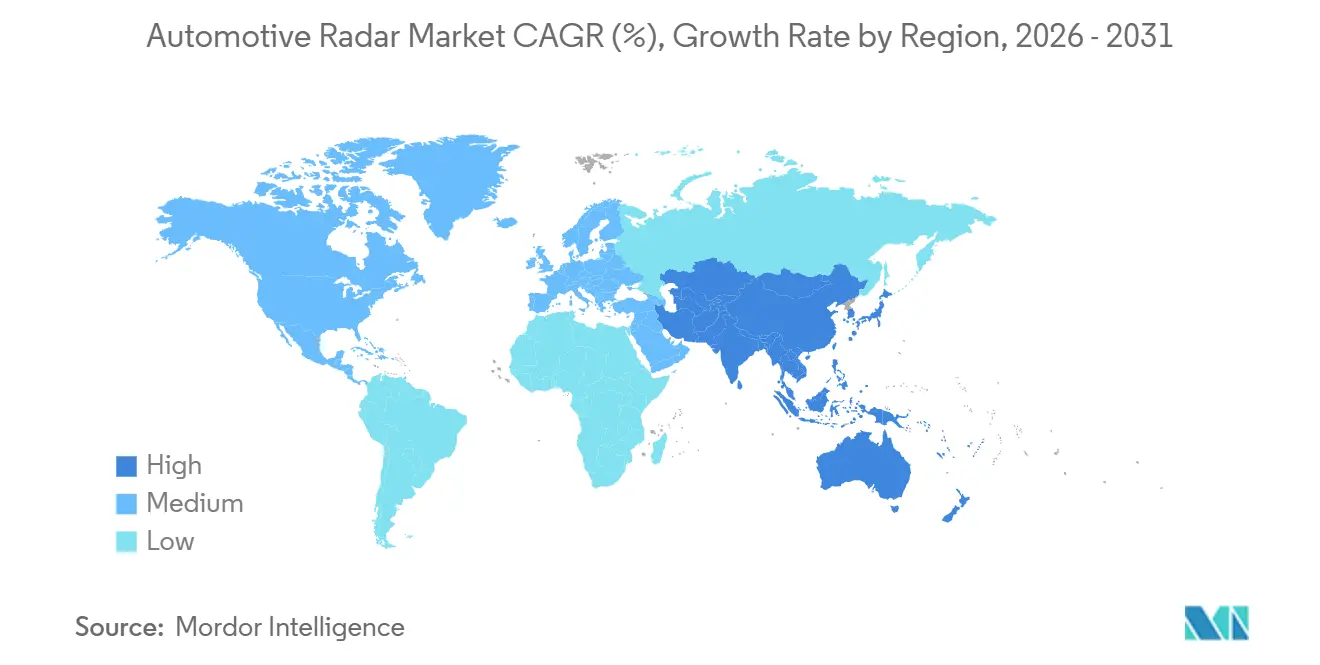
| Fastest Growing Market | Asia Pacific |
| Largest Market | Asia Pacific |
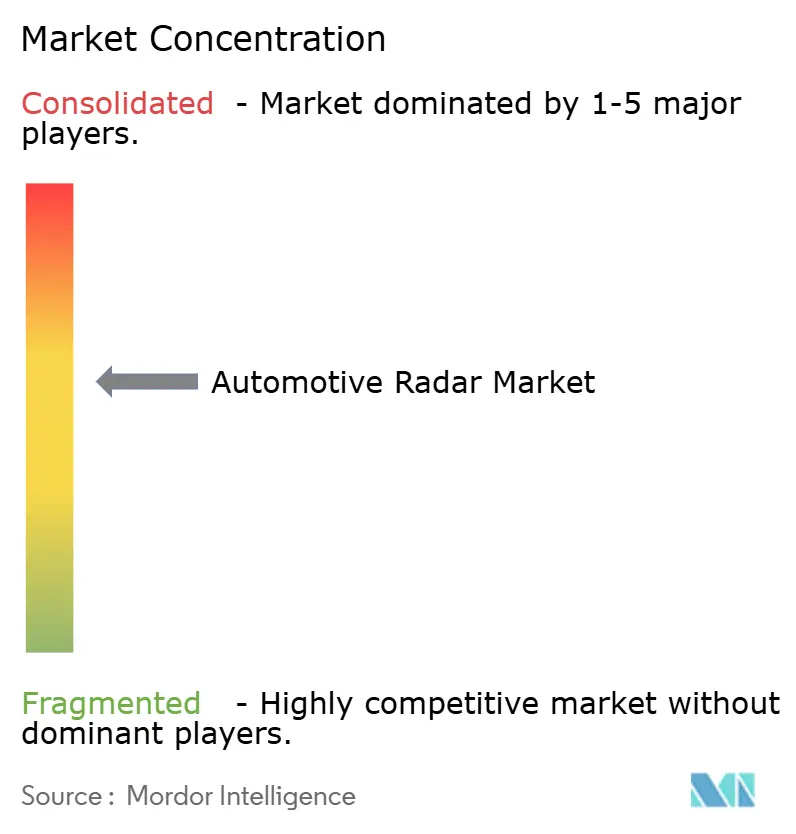
| Market Concentration | Medium |
Major Players *Disclaimer: Major Players sorted in no particular order Image © Mordor Intelligence. Reuse requires attribution under CC BY 4.0. | |
Automotive Radar Market Analysis by Mordor Intelligence
The automotive radar market size is expected to grow from USD 5.93 billion in 2025 to USD 6.92 billion in 2026 and is forecast to reach USD 13.21 billion by 2031 at a 13.8% CAGR over 2026-2031. Rapid regulatory alignment around Euro NCAP child-presence detection, lower 77 GHz module pricing and mass-market Level-2+ autonomy are widening sensor penetration and lifting unit demand. Battery-electric platforms add power headroom and zonal compute that ease multi-radar integration, while 4D imaging architectures open new cabin-safety and perception use cases. Chinese original equipment manufacturers are standardizing six-sensor suites across mid-tier trims, compressing adoption cycles and pushing the automotive radar market beyond premium niches into high-volume, cost-sensitive segments. Parallel wafer-scale integration, chiplet partitioning and silicon-germanium front ends are cutting module average selling prices, allowing the automotive radar market to defend margins even as unit counts rise.
Key Report Takeaways
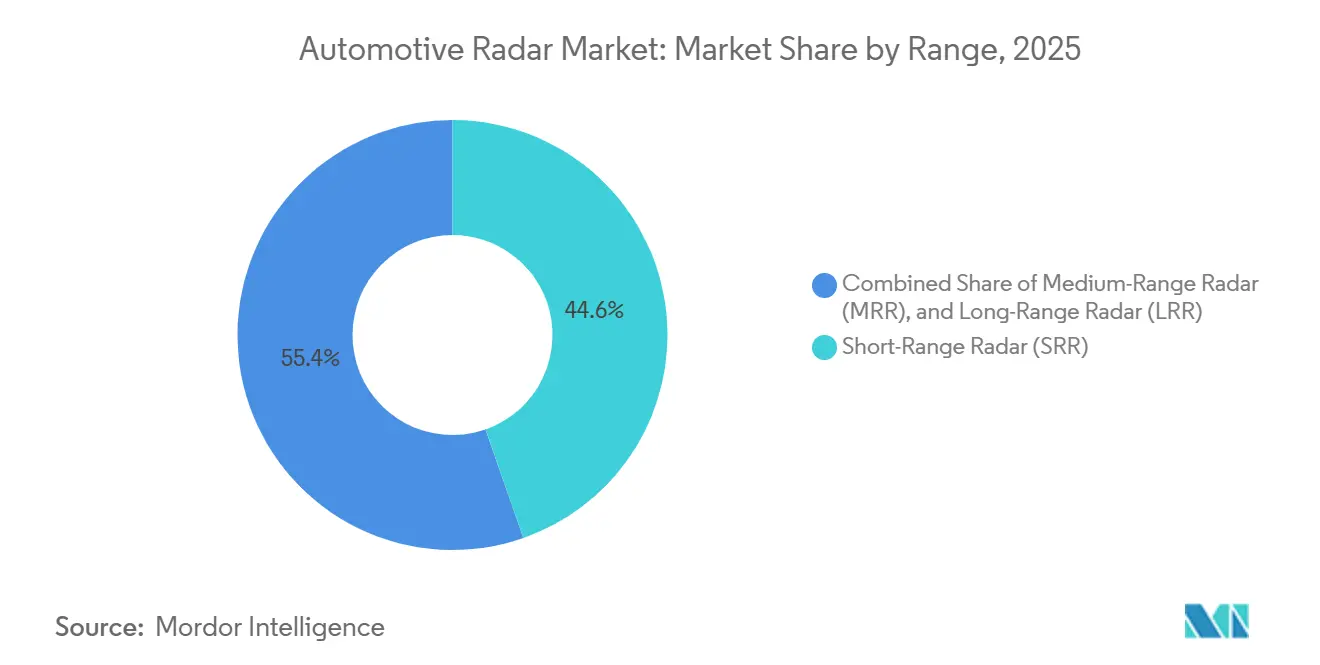
- By range, short-range radar led with 44.64% of automotive radar market share in 2025 and is expanding at a 13.92% CAGR through 2031.
- By frequency band, 77 GHz retained 62.77% share of the automotive radar market size in 2025, while the 79 GHz-plus band is projected to advance at 13.86% over 2026-2031.
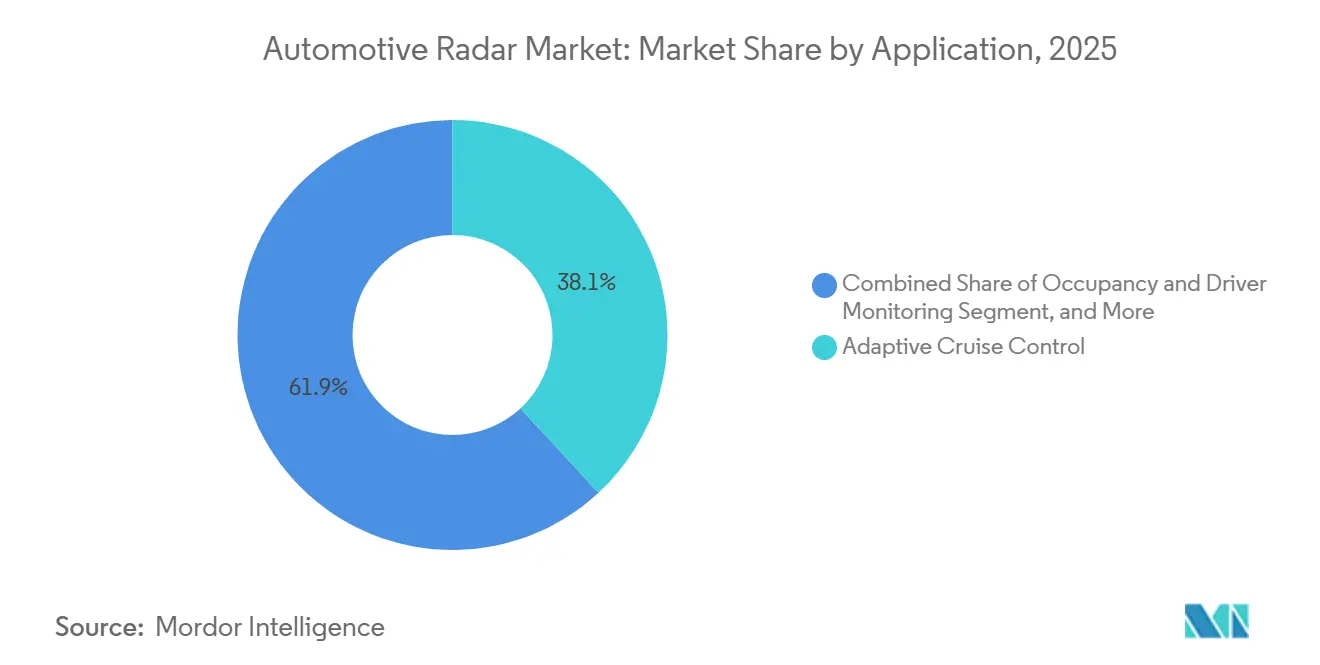
- By application, adaptive cruise control commanded 38.12% of automotive radar market size in 2025; occupancy and driver monitoring is the fastest-growing line at 14.02% CAGR to 2031.
- By vehicle type, passenger cars held 70.48% automotive radar market share during 2025, whereas robotaxis and autonomous shuttles record the highest 13.97% CAGR outlook.
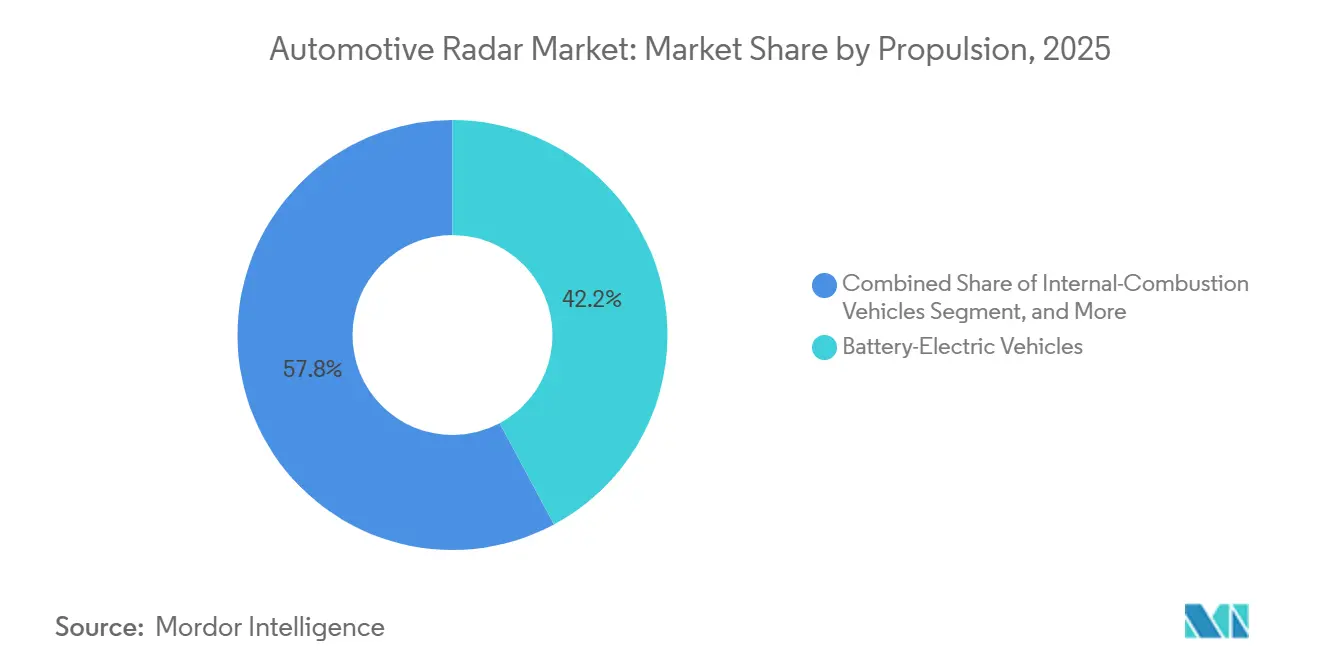
- By propulsion, battery-electric vehicles accounted for 42.18% of automotive radar market size in 2025 and are growing at 14.36% through 2031.
- By sales channel, OEM-fitted systems captured 78.74% revenue in 2025, while aftermarket retrofits post a 14.12% CAGR up to 2031.
- By geography, Asia-Pacific contributed 38.48% of global revenue in 2025 and exhibits a 14.53% CAGR, the fastest regional pace.
Note: Market size and forecast figures in this report are generated using Mordor Intelligence’s proprietary estimation framework, updated with the latest available data and insights as of January 2026.
Global Automotive Radar Market Trends and Insights
Drivers Impact Analysis*
| Driver | (~) % Impact on CAGR Forecast | Geographic Relevance | Impact Timeline |
|---|---|---|---|
| Stringent NCAP and UNECE Safety Mandates | +3.0% | Global, strongest in Europe and China | Short term (≤ 2 years) |
| 77 GHz Cost-Driven Miniaturisation Wave | +2.6% | Global, led by Asia-Pacific manufacturing hubs | Medium term (2-4 years) |
| Mass-Market Level-2+ Autonomy Adoption | +3.2% | North America and Europe early adopters, Asia-Pacific volume ramp | Medium term (2-4 years) |
| EV Architecture Headroom for Additional Sensors | +1.9% | Global, concentrated in BEV-leading markets | Long term (≥ 4 years) |
| Emerging 4D Imaging Radar for Vision Redundancy | +1.6% | Premium segments in Europe and North America, gradual Asia-Pacific diffusion | Long term (≥ 4 years) |
| Chiplet-Based Radar SOCs Enabling Retrofit Market | +0.8% | North America and Europe aftermarket, limited Asia-Pacific penetration | Medium term (2-4 years) |
| Source: Mordor Intelligence | |||
Stringent NCAP and UNECE Safety Mandates
Euro NCAP’s 2025 protocol forces in-cabin child-presence detection and forward-collision mitigation, making radar mandatory for five-star ratings.[1]European New Car Assessment Programme, “Euro NCAP 2025 Roadmap,” euroncap.com The European Union Regulation 2019/2206 extends the requirement across all new vehicle types from September 2024, directly influencing fleet-procurement decisions and insurance pricing.[2]United Nations Economic Commission for Europe, “UN Regulation No. 171,” unece.org China’s Ministry of Industry and Information Technology has announced automatic emergency braking mandates for 2028, creating a pipeline of high-volume 77 GHz orders as domestic brands pre-load sensors. Differences in rollout cadence between Europe, North America and Asia-Pacific stage demand in sequential waves, helping the automotive radar market avoid cyclical slumps. Tier-1 suppliers are therefore stockpiling front-end inventory in anticipation of mandate triggers, rather than awaiting direct pull from original equipment manufacturers.
77 GHz Cost-Driven Miniaturisation Wave
Migrating from 24 GHz to 77 GHz has cut module footprints by around 60% and doubled detection range to 250 m, allowing sensors to hide behind bumper fascias without stylistic compromise. Texas Instruments’ 2025 AWR2944P integrates a hardware accelerator and expanded memory, collapsing discrete DSPs and microcontrollers into one die. NXP’s S32R47 adds support for 192-element virtual arrays that enable 4D point clouds at mass-market cost. Wafer-scale integration, silicon-germanium processes, and chiplet partitioning drive the average selling price from USD 85 in 2024 to USD 72 in 2025, with forecasts at USD 55 by 2028 as Chinese fabs ramp volume. Lower prices open premium radar functions to entry-level trims, accelerating sensor count and fueling overall automotive radar market demand.
Mass-Market Level-2+ Autonomy Adoption
General Motors’ 2025 Ultra Cruise blueprint fits three 4D long-range units up front and four corner radars, lifting per-vehicle sensor counts from two to seven. BMW’s Snapdragon Ride Pilot follows a similar architecture, validated across 60 countries and ready for 100 by 2026. P3 Group analysis finds that Level-2+ requires six radar units, tripling addressable demand relative to basic driver-assistance baselines.[3]P3 Group, “ADAS Market Insights #01/2025,” p3-group.com Chinese brands fast-track Level-2+ to differentiate in crowded domestic showrooms, standardizing multi-radar suites on models priced below USD 25,000. Insurance incentives and lower accident liability further reinforce installation, translating technology readiness into immediate volume for the automotive radar market.
EV Architecture Headroom for Additional Sensors
Battery-electric platforms provide 30-50% more auxiliary power budget than internal-combustion equivalents, removing the alternator constraint that once limited radar counts. General Motors’ centralized compute, debuting on the Cadillac Escalade IQ, connects radar clusters through high-speed Ethernet to three zone controllers, cutting copper weight by up to 20% and streamlining over-the-air updates. Lower electromagnetic noise floors—free of spark-ignition interference—lift radar signal-to-noise ratios by 3-5 dB, enhancing detection of low-reflectivity targets like pedestrians. Tier-1 suppliers therefore prioritize electric vehicle programs for 4D imaging pilots, knowing architecture upgrades face fewer legacy constraints. As battery-electric vehicles average five to six radar units in 2026, compared with two to three on combustion models, propulsion shifts amplify unit demand across the automotive radar market.
Restraints Impact Analysis*
| Restraint | (~) % Impact on CAGR Forecast | Geographic Relevance | Impact Timeline |
|---|---|---|---|
| High Multi-Sensor Fusion System Cost | -1.8% | Global, most acute in cost-sensitive Asia-Pacific mass-market segments | Short term (≤ 2 years) |
| Spectrum Congestion at 79 GHz in Key Regions | -1.2% | Urban corridors in Europe, North America and China | Medium term (2-4 years) |
| Thermal Bottlenecks in Legacy GigE Backbones | -0.6% | North America and Europe legacy platforms | Medium term (2-4 years) |
| SiGe / GaAs Wafer Supply Constraints | -0.7% | Global, concentrated in Asia-Pacific foundry capacity | Short term (≤ 2 years) |
| Source: Mordor Intelligence | |||
High Multi-Sensor Fusion System Cost
Centralized perception stacks capable of 100+ TOPS artificial intelligence add USD 800-1,200 per vehicle, a premium mass-market brands cannot easily absorb. Liquid-cooled Nvidia Thor compute modules underpin these systems and force design changes in packaging and thermal paths, raising bill-of-material pressure, especially on price-sensitive Asia-Pacific trims. While Chinese suppliers produce compute at a 40-50% discount to Western peers, the near-term burden limits optional radar functions on entry-models and caps immediate addressable volume. Tier-1s must choose between selling standalone modules or taking on full sensor-fusion integration, a trade-off that impacts margin retention and automotive radar market profitability. By the decade’s end, 5 nm nodes and chiplet accelerators promise to halve compute costs, but the 2026-2028 window remains a drag on mass uptake.
Spectrum Congestion at 79 GHz in Key Regions
Urban corridors now see radar-equipped vehicle density above 30%, creating mutual interference when adjacent vehicles transmit overlapping chirps and reducing effective range by up to 20%. Mitigation via frequency hopping increases processing latency, whereas time-division multiplexing lowers update rates, neither of which is ideal for high-speed cross-traffic alerts. Cities like Shanghai, Los Angeles and Frankfurt are at the forefront of this congestion, yet regulators have not mandated harmonized waveform planning. Proprietary filtering mitigates crosstalk, but lack of interoperability forces each tier-1 to engineer unique anti-interference stacks, adding cost and uncertainty. As 4D imaging radar extends to premium trims during 2028-2029, spectrum saturation risks blunt resolution advantages and could slow uptake, tempering growth momentum for the automotive radar market.
*Our forecasts treat driver/restraint impacts as directional, not additive. The impact forecasts reflect baseline growth, mix effects, and variable interactions.
Segment Analysis
By Range: Short-Range Units Anchor Volume Growth
Short-range radar captured 44.64% of 2025 revenue and is projected to advance at a 13.92% CAGR through 2031. Medium-range devices support cross-traffic detection and intersection monitoring, while long-range units remain the baseline for adaptive cruise control but face price pressure from expanding Chinese capacity.
Corner installations now combine wide-angle coverage with 90 m reach, enabling a single sensor to handle parking, blind-spot and lane-change tasks. Occupancy-monitoring modules at 60 GHz form a nascent ultra-short-range slice that will scale quickly as Euro NCAP in-cabin rules spread. Cost erosion in silicon-germanium front ends lets automakers deploy four to six short-range units without breaching trim-level price targets. Consolidated demand across parking, blind-spot and rear-cross-traffic functions secures a stable growth runway for short-range radar through 2031.


By Frequency Band: 77 GHz Retains Scale While 79 GHz Drives Imaging
The 77 GHz band held 62.77% of 2025 revenue but its growth moderates as 79 GHz imaging solutions rise at a 13.86% CAGR through 2031. Regulators have frozen new 24 GHz approvals, pushing legacy units toward obsolescence and tightening supplier roadmaps around 77 GHz and 79 GHz.
Tier-1 suppliers unveiled 77-81 GHz system-on-chips that embed deep-learning acceleration, squeezing more angular resolution from established antenna designs. Premium and battery-electric platforms adopt 79 GHz to unlock 4 GHz sweep bandwidth for high-definition point clouds, yet mass-market models remain on 77 GHz for cost control. Spectrum-sharing challenges in dense corridors add engineering overhead, but proprietary interference-rejection stacks keep performance within Euro NCAP tolerance bands. The dual-band roadmap allows carmakers to stagger investment and protect residual tooling value in 77 GHz production lines.
By Application: Cabin-Safety Demand Outpaces Highway Features
Adaptive cruise control delivered 38.12% of 2025 application revenue, while occupancy and driver monitoring show the fastest 14.02% CAGR to 2031. Automatic emergency braking nears saturation in developed markets, shifting marginal growth toward blind-spot warning, rear cross-traffic alert and automated parking.
Euro NCAP’s 2025 child-presence mandate elevates 60 GHz in-cabin radar from niche to volume status, expanding total sensor counts per vehicle. Autonomous Level 3 pilots push multi-radar redundancy, but regulatory caution keeps that slice modest until after 2028. Parking assistance gains traction in Asia-Pacific megacities where tight spaces demand automated maneuvering. The widening mix of use cases strengthens application diversity and cushions the market against single-feature slowdowns.
By Vehicle Type: Passenger Cars Dominate, Robotaxis Accelerate
Passenger cars accounted for 70.48% of 2025 revenue, yet robotaxis and shuttles post a 13.97% CAGR through 2031 as fleet operators chase lower insurance and downtime. Light commercial vans adopt radar for blind-spot coverage on high-mile delivery routes, while heavy trucks integrate long-range units for platooning and lane-keep support.
Robotaxi prototypes carry six to ten sensors to satisfy fail-operational rules, creating premium demand for 4D imaging modules despite limited unit volumes. Chinese brands standardize four-sensor suites on entry passenger trims, rapidly compressing the adoption curve. Regional divergence persists; Europe leans on premium electrics for early feature rollouts, whereas North America emphasizes hands-free highway systems on full-size pickups and SUVs. Vehicle-type diversity underpins sustained radar unit expansion across all production classes.
By Propulsion: Battery-Electric Platforms Multiply Sensor Attach Rates
Battery-electric vehicles held 42.18% of 2025 propulsion revenue and are growing at a 14.36% CAGR through 2031, outpacing hybrids and combustion models. Higher auxiliary power budgets and zonal Ethernet backbones let electric platforms host five to six radar units without alternator or harness redesign penalties.
Lower electromagnetic noise floors raise signal-to-noise ratios, improving pedestrian detection and justifying premium 4D imaging on flagship battery-electrics. Combustion models retain two to three units mainly for regulatory compliance, while hybrids sit between the extremes. Suppliers therefore prioritize electric programs for next-generation system-on-chip launches, treating internal-combustion refresh cycles as cost-down opportunities rather than technology showcases. Propulsion-driven divergence will widen average sensor counts and lift overall shipment value through the forecast window.
By Sales Channel: Aftermarket Retrofit Emerges from a Low Base
OEM-installed radar represented 78.74% of 2025 sales-channel revenue, but aftermarket kits register a 14.12% CAGR to 2031 as chiplet platforms simplify calibration. Factory systems benefit from end-of-line alignment and full vehicle integration, locking in high reliability scores.
Retrofit momentum concentrates in North America and parts of Asia, where insurance rebates offset installation costs on legacy vehicles lacking blind-spot or rear-cross-traffic coverage. European uptake lags because type-approval rules mirror OEM safety thresholds and inflate certification expense. Indie Semiconductor’s single-die radar paired with tablet-based calibration lowers workshop barriers, encouraging independent garages to enter the sensor business. The aftermarket channel will not overtake factory fitment, but its double-digit pace supplies an incremental growth lever as new-vehicle sales plateau.
Geography Analysis
Asia-Pacific generated 38.48% of 2025 revenue for the automotive radar market, and its 14.53% CAGR through 2031 positions the region as the fastest-growing demand center. China anchors this expansion: domestic suppliers such as Cheng-Tech and Huawei are scaling 77 GHz and 79 GHz module production to meet the 2028 automatic emergency-braking mandate, while original equipment manufacturers (OEMs) bundle six-sensor suites on mid-tier trims to hold feature parity with European and North American rivals. Japan and South Korea display high radar adoption in premium cars and export large volumes of modules through DENSO, Hitachi Astemo and Nidec Elesys, yet growth moderates as their domestic markets approach saturation. India’s radar penetration remains below 10% in 2025, but the Ministry of Road Transport and Highways is evaluating a 2027-2028 automatic emergency-braking timeline, creating a latent runway that could lift regional shipments late in the forecast window. Southeast Asian markets lag in regulatory enforcement, although insurance rebates for blind-spot detection retrofits are stimulating aftermarket demand in Thailand, Indonesia and Vietnam. Australia and New Zealand maintain radar attach rates on par with Western Europe, driven by long-distance highway safety requirements that favor long-range adaptive-cruise modules. Collectively, Asia-Pacific’s scale advantage reduces average selling prices, helping the automotive radar market defend margins even as unit counts accelerate.
Europe contributed roughly 28% of global revenue in 2025, underpinned by stringent Euro NCAP ratings that compel five-star contenders to fit forward-collision, blind-spot and in-cabin child-presence radar. Premium brands deploy 4D imaging solutions at 79 GHz to differentiate on perception accuracy, while volume manufacturers still rely on cost-optimized 77 GHz corner sensors for compliance. Continental’s cumulative 200 million-unit production milestone and EUR 1.5 billion (USD 1.70 billion) in 2025 radar orders illustrate Europe’s role as both design-validation hub and volume anchor for Tier-1 suppliers. Eastern European contract assemblers expand module output to serve German, French and Italian OEMs that embrace near-shoring strategies to contain logistics risk. Regulatory convergence across 27 member states guarantees homogeneous demand, yet spectrum congestion around 79 GHz in dense corridors such as Frankfurt and Paris requires interference-mitigation spending that raises total system cost. As battery-electric vehicle (BEV) registrations rise past 30% of new sales in 2026, European BEV platforms average five to six sensors, prolonging growth even as combustion volumes decline. Europe therefore remains the lead market for software-defined radar updates and over-the-air performance enhancements.
North America held approximately 24% of 2025 revenue, with momentum tied to National Highway Traffic Safety Administration automatic emergency-braking mandates and the commercialization of hands-free highway suites like General Motors Ultra Cruise and Ford BlueCruise. Pickup trucks and full-size SUVs integrate three to four long-range sensors for trailer-tow assistance and lane-centering, lifting per-vehicle dollar content despite lower unit shipments than compact passenger cars. Canada mirrors U.S. regulations, while Mexico focuses on export-oriented assembly of radar-equipped vehicles destined for the United States. South America, the Middle East and Africa together generated less than 10% of 2025 revenue; radar adoption concentrates in fleet and commercial segments where duty-cycle savings and lower insurance premiums offset initial hardware cost. Government safety programs in Brazil and Saudi Arabia may accelerate take-up after 2027, but fragmented standards and limited supplier footprints restrain near-term volumes. Overall, geographic diversification cushions the automotive radar market size from regional policy shocks and balances growth across mature and emerging economies.

Competitive Landscape
Robert Bosch, Continental, DENSO and ZF Friedrichshafen collectively controlled an estimated 57% share of the automotive radar market in 2025, reflecting moderate consolidation in core long-range and corner modules. Bosch deepened vertical integration by unveiling the SX600/SX601 77-81 GHz system-on-chips with embedded deep-learning accelerators, enabling it to sell turnkey hardware-plus-perception bundles to OEMs and tier-2 integrators. Continental spun off its Automotive group into Continental Automotive Holding SE, giving the new entity freedom to pursue software-defined architectures and joint-go-to-market programs with cloud and semiconductor partners, an attractive model for OEMs shifting value capture toward centralized compute. DENSO leverages long-standing Toyota relationships to lock in forward-model radar contracts, while ZF focuses on fusion of radar, camera and LiDAR in its ProAI compute platform aimed at Level 2+ and Level 3 autonomy.
Second-tier challengers—Texas Instruments, NXP and Infineon—accelerate competition by delivering reference designs that allow low-tier module assemblers to bypass incumbent tier-1s. Texas Instruments’ April 2025 AWR2944P packs a hardware accelerator and expanded memory, shrinking board-level bill of materials and offering a drop-in path to 4D imaging for cost-sensitive trims. NXP’s S32R47 extends virtual antenna arrays past 192 elements, enabling Tier-2 suppliers to chase premium European programs without building bespoke silicon. Infineon’s CTRX8191F proves that 77 GHz still supports high-definition imaging, allowing OEMs to hedge against 79 GHz spectrum congestion with incremental upgrades. Combined, these semiconductor firms dilute tier-1 bargaining power and compress module pricing, even as they earn silicon-content premiums.
Start-ups such as Arbe Robotics, Uhnder, Vayyar Imaging and Indie Semiconductor attack niches that incumbents overlook. Arbe’s 4D imaging radar claims 30-times more native resolution than legacy frequency-modulated continuous-wave (FMCW) solutions, targeting robotaxi fleets willing to pay for centimeter-level object separation. Uhnder’s all-digital phase-modulated continuous-wave (PMCW) approach resists mutual interference and offers chip-level security features valued by defense contractors and premium OEMs. Vayyar expands in-cabin 60 GHz radar for occupancy monitoring, capitalizing on Euro NCAP child-presence rules, while Indie Semiconductor partners with GlobalFoundries to produce chiplet-based radar system-on-chips optimized for aftermarket retrofits. These disruptors secure design wins in 2026–2027 vehicle programs, gradually chipping away at incumbent share and driving the automotive radar market toward richer feature sets and multi-vendor sourcing strategies.
Automotive Radar Industry Leaders
Robert Bosch GmBH
Continental AG
DENSO Corporation
Autoliv Inc.
NXP Semiconductors N.V.
- *Disclaimer: Major Players sorted in no particular order

Recent Industry Developments
- October 2025: Skyworks Solutions agreed to acquire Qorvo for 0.960 Skyworks shares plus USD 32.50 cash per Qorvo share, forming a USD 7.7 billion pro-forma radio-frequency specialist focused on automotive radar front-ends.
- October 2025: General Motors unveiled a centralized vehicle-computing platform debuting on the 2028 Cadillac Escalade IQ, consolidating sensor fusion on a liquid-cooled NVIDIA Thor unit and supporting radar hardware upgrades without software rewrite.
- September 2025: Qualcomm Technologies and BMW Group introduced Snapdragon Ride Pilot for the 2026 BMW iX3, integrating multi-radar fusion and bird’s-eye perception validated across 60 countries.
- May 2025: Continental reached 200 million cumulative radar-sensor output and booked EUR 1.5 billion (USD 1.70 billion) of 2026-2027 orders, confirming volume transition from validation to mass production.


Research Methodology Framework and Report Scope
Market Definitions and Key Coverage
Our study defines the automotive radar market as all on-board radio-frequency sensors (24 GHz, 76-81 GHz, and emerging 120 GHz units) factory-installed on passenger and commercial vehicles to power safety and automated-driving functions such as adaptive cruise control, automatic emergency braking, blind-spot monitoring, occupancy detection, and in-cabin gesture control.
Scope exclusion: Military ground radars, aftermarket speed-trap devices, and non-vehicle industrial radars sit outside our scope.
Segmentation Overview
- By Range
- Short-Range Radar (SRR)
- Medium-Range Radar (MRR)
- Long-Range Radar (LRR)
- By Frequency Band
- 24 GHz
- 77 GHz
- 79 GHz and above
- By Application
- Adaptive Cruise Control (ACC)
- Automatic Emergency Braking (AEB)
- Blind-Spot / Rear Cross-Traffic
- Occupancy and Driver Monitoring
- Autonomous Driving (L3+)
- Parking Assistance and Automated Parking
- By Vehicle Type
- Passenger Cars
- Light Commercial Vehicles
- Heavy Commercial Vehicles
- Robotaxis and AV Shuttles
- By Propulsion
- Internal-Combustion Vehicles
- Battery-Electric Vehicles
- Hybrid-Electric Vehicles
- By Sales Channel
- OEM-Fitted
- Aftermarket Retrofits
- By Geography
- North America
- United States
- Canada
- Mexico
- South America
- Brazil
- Argentina
- Rest of South America
- Europe
- Germany
- France
- United Kingdom
- Italy
- Spain
- Russia
- Rest of Europe
- Asia-Pacific
- China
- Japan
- South Korea
- India
- Australia and New Zealand
- Rest of Asia-Pacific
- Middle East
- Saudi Arabia
- United Arab Emirates
- Rest of Middle East
- Africa
- South Africa
- Rest of Africa
- North America
Detailed Research Methodology and Data Validation
Primary Research
Interviews with millimeter-wave chip architects, Tier-1 module engineers, and OEM ADAS planners across Asia, Europe, and North America enabled us to validate sensor counts per vehicle, track ASP roadmaps, confirm regulatory timing, and resolve data gaps revealed during secondary research.
Desk Research
We began with public datasets that quantify the vehicle base, notably OICA production volumes, ACEA new-registration files, and China MIIT new-energy statistics, which are then paired with radar-fitment evidence from Euro NCAP test logs, NHTSA AEB rule dockets, UNECE WP.29 minutes, and UN Comtrade import codes 852691/852692. Trade bodies such as CLEPA and JASIC, plus company 10-Ks and press releases accessed through Dow Jones Factiva and D&B Hoovers, supplied cost, technology, and competitive signals. The sources cited are illustrative; many additional references were consulted by Mordor analysts to verify and clarify the data landscape.
Market-Sizing & Forecasting
Our model starts top-down. Regional light- and heavy-vehicle builds are multiplied by verified radar penetration ratios, which are then converted to revenue through weighted average selling prices split by band and range. Supplier roll-ups and sample OEM bill-of-material checks provide a bottom-up reference that lets Mordor fine-tune totals whenever mismatches emerge. Key variables include vehicle output, sensors-per-car, battery-electric share, mandated AEB deadlines, ASP deflation, and packaging yields. A multivariate regression with scenario analysis projects these drivers to 2030.
Data Validation & Update Cycle
Outputs undergo automated variance scans, peer reviews, and lead-analyst sign-off. We refresh every twelve months, and interim updates are issued when major legislation, M&A, or supply shocks change the baseline, so clients always receive the latest view.
Why Mordor's Automotive Radar Baseline Commands Reliability
Published estimates often diverge because firms pick different radar definitions, vehicle cohorts, pricing curves, and refresh cadences. Our method makes those levers explicit for buyers.
Key gap drivers include some publishers limiting scope to factory-fitted 77 GHz modules, others applying aggressive ASP compression, and a few projecting revenue from installed base rather than new builds, which inflates totals relative to Mordor Intelligence.
Benchmark comparison
| Market Size | Anonymized source | Primary gap driver |
|---|---|---|
| USD 6.27 B | Mordor Intelligence | N/A |
| USD 5.36 B | Global Consultancy A | Excludes 24 GHz shipments; shorter base period |
| USD 7.68 B (2024) | Industry Insight B | Counts aftermarket retrofits plus chip revenue |
In sum, our balanced penetration logic, transparent variables, and annual review cycle give decision-makers a dependable baseline they can trace and replicate with confidence.


Key Questions Answered in the Report
What CAGR is projected for the automotive radar market during 2026-2031?
The market is forecast to grow at 13.8% over 2026-2031.
Which region leads growth through 2031?
Asia-Pacific posts the fastest 14.53% CAGR, driven by China’s 2028 automatic emergency-braking mandate.
How many radar units do Level 2+ vehicles typically require?
Industry guidelines cite six sensors per vehicle, up from two in basic driver-assistance packages.
Why do battery-electric vehicles feature higher radar counts?
BEV platforms provide larger auxiliary power budgets and zonal Ethernet backbones, allowing five to six sensors without harness redesign.
Which application segment is growing fastest?
Occupancy and driver monitoring records a 14.02% CAGR as Euro NCAP child-presence detection becomes mandatory.
What is the main restraint on near-term adoption?
High multi-sensor fusion compute costs add USD 800-1,200 per vehicle, compressing margins in cost-sensitive segments.
Page last updated on:


