
Automotive Head-up Display Market Size and Share
Market Overview
| Study Period | 2020 - 2031 |
|---|---|
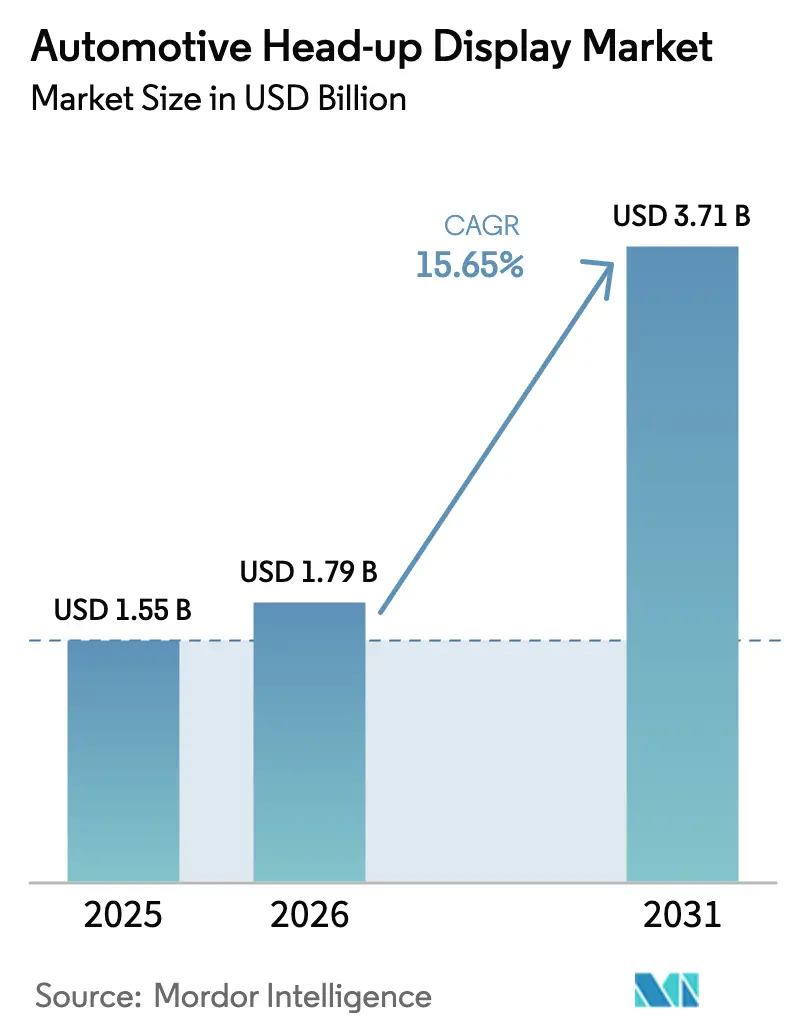
| Market Size (2026) | USD 1.79 Billion |
| Market Size (2031) | USD 3.71 Billion |
| Growth Rate (2026 - 2031) | 15.65% CAGR |
| Fastest Growing Market | Asia Pacific |
| Largest Market | Europe |
| Market Concentration | Medium |
Major Players *Disclaimer: Major Players sorted in no particular order Image © Mordor Intelligence. Reuse requires attribution under CC BY 4.0. | |
Automotive Head-up Display Market Analysis by Mordor Intelligence
The Automotive head-up display market size was valued at USD 1.55 billion in 2025 and estimated to grow from USD 1.79 billion in 2026 to reach USD 3.71 billion by 2031, at a CAGR of 15.65% during the forecast period (2026-2031). Consistent premium-vehicle digital-cockpit rollouts, strict ADAS regulations, and steady optical cost deflation sustain this expansion. Automakers now treat HUDs as core human–machine interfaces that feed lane-keeping, speed-limit, and augmented-navigation cues directly into the sightline, trimming driver reaction times and satisfying safety mandates. Europe sets the near-term pace through its General Safety Regulation II, while Asia-Pacific propels volume growth by localizing component manufacture and democratizing price points. Meanwhile, traditional tier-1 suppliers defend their share through scale, and holographic specialists pry open new value pools by licensing AR waveguide optics. The Automotive Head-Up Display market keeps its momentum despite packaging limits and micro-LED yield gaps because cost curves have crossed the mass-market viability threshold, and 5G-enabled cloud rendering unlocks fresh software revenue streams.
Key Report Takeaways
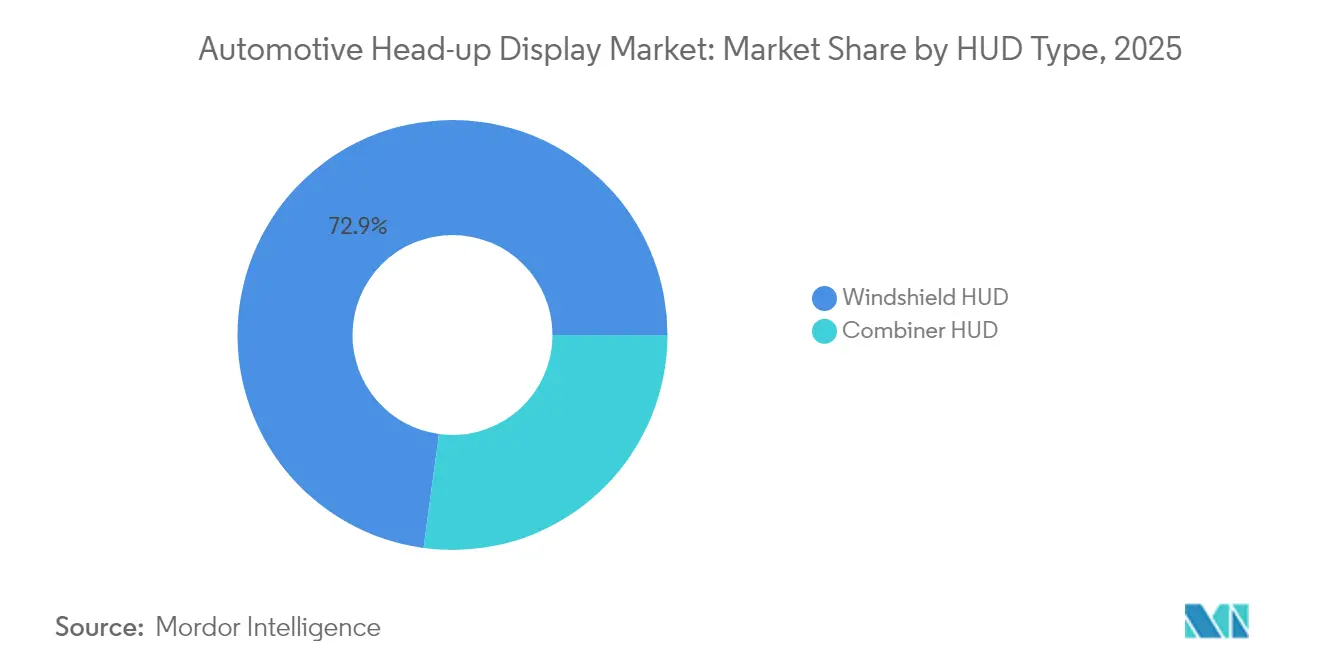
- By HUD type, windshield units held a 72.85% share of the automotive head-up display market in 2025. Combiner models are projected to post a 16.03% CAGR to 2031.
- By technology, conventional systems commanded 61.45% of the automotive head-up display market size in 2025. AR-HUD deployments are forecast to climb at a 16.52% CAGR through 2031.
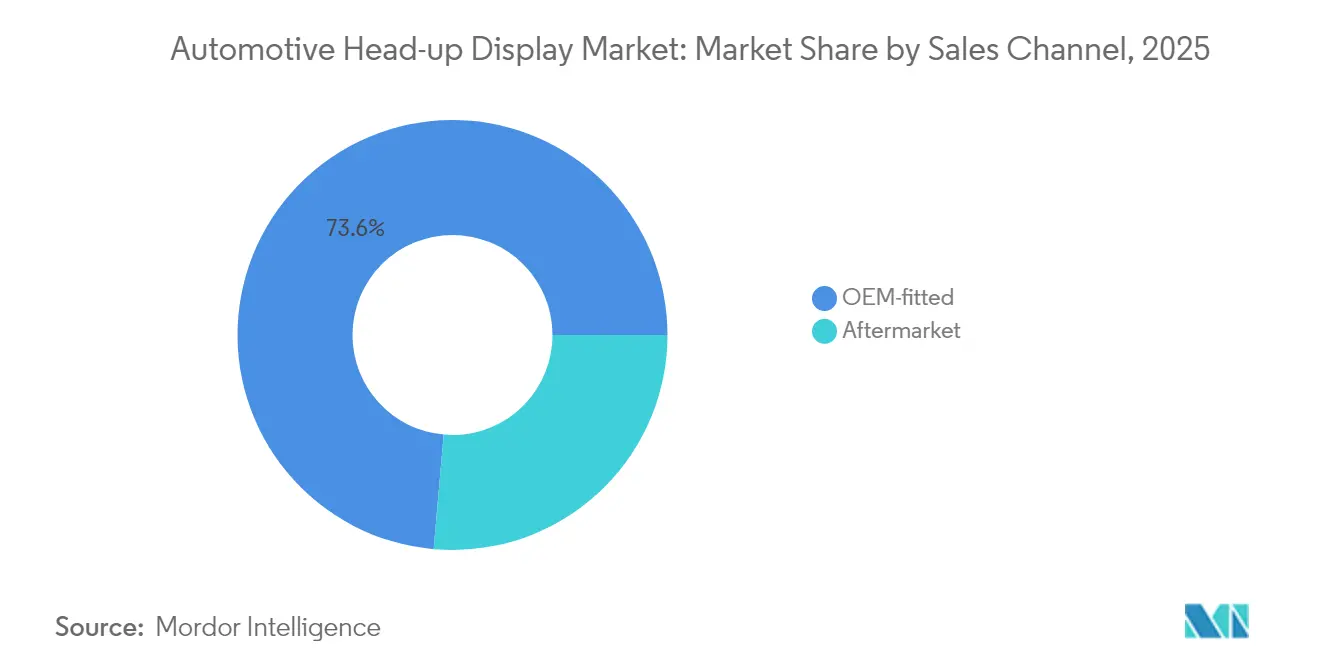
- By sales channel, OEM-fitted solutions accounted for a 73.60% share of the automotive head-up display market in 2025, while aftermarket retrofits are set to expand at a 17.05% CAGR to 2031.
- By vehicle type, passenger cars represented an 80.55% share of the automotive head-up display market in 2025. Commercial vehicles are expected to grow fastest at a 16.96% CAGR up to 2031.
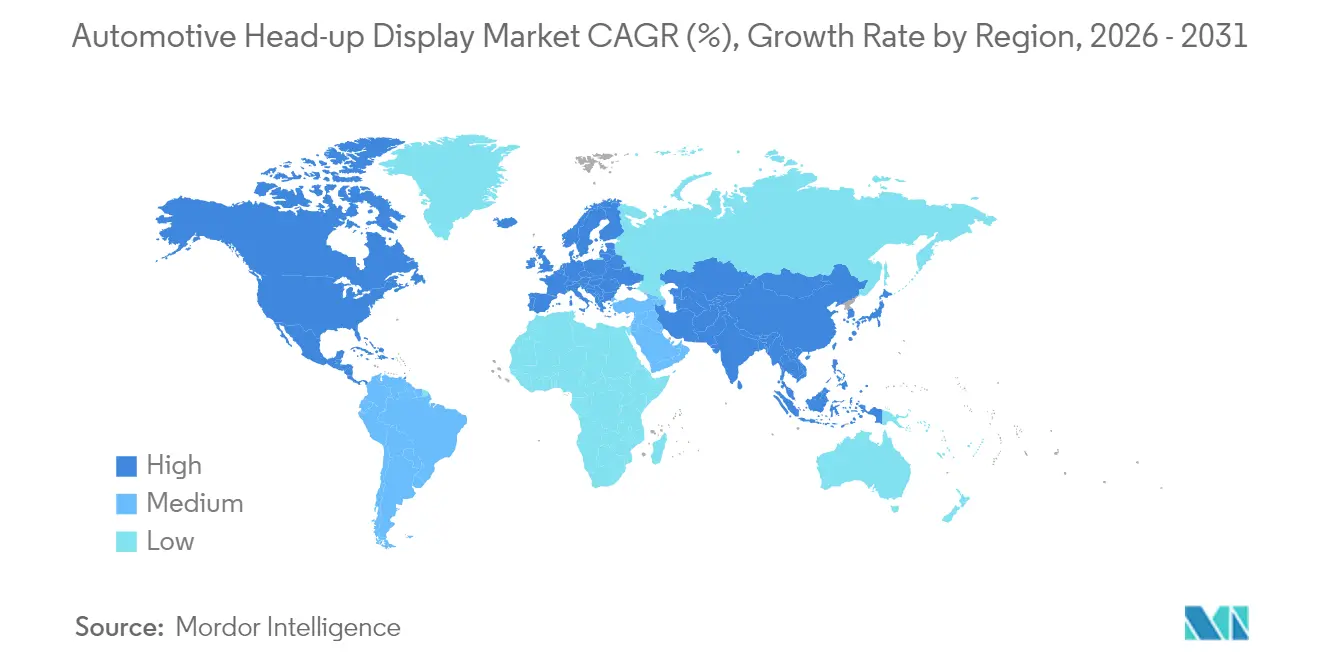
- By geography, Europe led with a 36.90% share of the automotive head-up display market in 2025. Asia-Pacific will register the highest regional CAGR at 16.24% through 2031.
Note: Market size and forecast figures in this report are generated using Mordor Intelligence’s proprietary estimation framework, updated with the latest available data and insights as of 2026.
Global Automotive Head-up Display Market Trends and Insights
Drivers Impact Analysis*
| Driver | (~) % Impact on CAGR Forecast | Geographic Relevance | Impact Timeline |
|---|---|---|---|
| ADAS and GSR-II Compliance Push | +4.1% | Europe primary, North America secondary | Short term (≤2 years) |
| Premium Cockpit Tech Race | +3.2% | Global focus, strongest in North America and Europe | Medium term (2-4 years) |
| Low-Cost PGU Optics | +2.8% | Global, manufacturing benefit in Asia-Pacific | Medium term (2-4 years) |
| China HUD In-House Sourcing | +2.3% | Asia-Pacific primary, worldwide supply-chain impact | Short term (≤2 years) |
| Micro-LED Windscreen R&D | +1.9% | Asia-Pacific core, spill-over to North America and Europe | Long term (≥4 years) |
| 5G AR Nav Integration | +1.5% | Global, early uptake in developed markets | Long term (≥4 years) |
| Source: Mordor Intelligence | |||
Mandatory ADAS and GSR-II Compliance Push
Europe’s General Safety Regulation II obliges intelligent speed assistance and lane-keeping alerts, increasing display workload that conventional clusters cannot accommodate without longer glance times. Continental’s AR-HUD overlays speed limits and lane boundaries inside the driver's sightline, cutting cognitive load and meeting regulatory brightness and latency thresholds [1]“Augmented Reality HUD Product Page,”, Continental AG, continental.com. The United States NCAP roadmap mirrors these guidelines, signalling converging global standards that point automakers toward HUD adoption as the most ergonomic path to compliance. Suppliers benefit from demand anchored in law rather than consumer discretion, protecting the Automotive Head-Up Display market against macro-economic softening.
Premium-Vehicle Digital-Cockpit Race
Luxury OEMs are reframing cabin design around seamless digital experiences in which head-up displays move from optional accessory to centerpiece. BMW’s Panoramic iDrive projects a unified image band across the windshield that blends instrument data with live navigation cues, reinforcing brand value while reducing the need for secondary displays. Audi’s A6 e-tron prototype stretches an 88-inch virtual plane at a 200-meter focal distance, lifting driver gaze from the dashboard to the road ahead. The United States newcomer Lucid guarantees AR-HUD availability across its UX 3.0 platform, confirming that premium EV buyers expect advanced projection by default. Early luxury adoption spreads fixed R&D costs, letting suppliers re-package the optics for mid-segment launches within two model cycles. Vendors that master this premium-to-volume cascade safeguard margins while meeting stricter safety validation criteria.
Falling PGU Optics Cost Below USD 35
Semiconductor scaling and automated assembly have squeezed picture-generation-unit bills of material, with Texas Instruments’ DLP3030 reference design trending toward the sub-USD 35 marker that unlocks B-segment adoption[2]“DLP3030PGUQ1EVM Design Guide,”, Texas Instruments, ti.com. At the same time, Panasonic’s prototype AR-HUD maintains 4K resolution and sub-300 ms latency without raising unit price, demonstrating that feature growth can coexist with cost decline [3]“4K AR HUD Prototype Release,”, Panasonic Corporation, panasonic.com. Cost deflation invites commercial-vehicle operators to deploy HUDs for safety and efficiency, further enlarging addressable volume. Suppliers now face commoditization pressures on basic projection and must pivot to software and connectivity layers for differentiation.
5G Edge-Rendered AR Navigation Integration
Lear’s 5G-ready telematics unit streams real-time environmental models to cloud servers that render high-density augmented overlays before returning them to the vehicle HUD within sub-100 ms, staying inside safety-critical latency envelopes [4]“5G Telematics Control Unit Fact Sheet,”, Lear Corporation, lear.com. Edge-processed graphics enable dynamic hazard markers, weather-responsive routing, and crowd-sourced updates that surpass the computing headroom of on-board processors. This capability converts the HUD from a static display into a subscription platform, creating recurring revenue for automakers and suppliers.
Restraints Impact Analysis*
| Restraint | (~) % Impact on CAGR Forecast | Geographic Relevance | Impact Timeline |
|---|---|---|---|
| Windshield Space Constraints | -2.1% | Global, most acute in compact segments | Medium term (2-4 years) |
| AR-HUD Ghosting Risks | -1.8% | Global, with elevated scrutiny in Europe and North America | Short term (≤2 years) |
| Red Micro-LED Yield Challenges | -1.3% | Global, production concentrated in Asia-Pacific | Medium term (2-4 years) |
| Optical Alignment Variance (Suppliers) | -0.9% | Global, quality-control issue in emerging manufacturing regions | Long term (≥4 years) |
| Source: Mordor Intelligence | |||
Windshield Real-Estate and Packaging Limits
Compact vehicles struggle to house projection optics between the dashboard and the glass. Ford’s service bulletin details recalibration procedures that expose tight tolerances whenever a windshield is replaced. Mercedes-Benz internal studies show minor curvature shifts can degrade image focus and brightness, forcing OEMs to lock in glass suppliers early to secure consistency. Pillar-to-pillar concepts like Valeo’s Panovision counteract space limits but require platform-level redesigns that add tooling cost and delay. The constraint divides the Automotive Head-Up Display market into premium programs that can afford bespoke dashboards and economy lines that must wait for slimmer optics.
Persistent AR-HUD Ghost-Image Safety Risk
Double reflections from windshield layers generate faint secondary images that distract drivers during low-sun angles. Saflex HUD PVB interlayers mitigate ghosting, yet complete elimination remains elusive under varied lighting. SAE J1757-2 sets maximum acceptable separation, but field tests using 3M optical film confirm that real-world results often approach the upper threshold. Any recall triggered by ghost-image incidents could slow regulatory approvals and shake consumer confidence, tempering short-term adoption.
*Our forecasts treat driver/restraint impacts as directional, not additive. The impact forecasts reflect baseline growth, mix effects, and variable interactions.
Segment Analysis
By HUD Type: Windshield Integration Dominates but Combiner Growth Accelerates
Windshield systems captured 72.85% of the automotive head-up display market share in 2025, underpinned by seamless cabin integration and premium brand alignment. BMW’s panoramic projection spans the full glass width and demonstrates how large virtual images can replace secondary screens. These units boost perceived vehicle value and satisfy ADAS visibility rules, though they depend on complex optical alignment and vehicle-specific packaging. As volumes scale, the Automotive Head-Up Display market size for windshield units will still widen, yet growth rates will cool as penetration saturates luxury models.
Combiner solutions recorded the sharpest rise with a 16.03% CAGR through 2031. Their self-contained modules bypass windshield geometry constraints, cutting install time and making retrofits feasible for used-car owners. Suppliers leverage standardized brackets and minimize vehicle teardown, giving dealers a high-margin accessory. Combiner technology now supports brighter images and anti-glare coatings, narrowing the quality gap with windshield projection. The segment will extend the Automotive Head-Up Display market to cost-sensitive customers and fleet refurbishments.



By Technology: AR-HUD Momentum Questions Conventional Supremacy
Conventional projection still accounts for 61.45% of the automotive head-up display market share in 2025, thanks to proven reliability and low cost. Continental continues to secure high-volume programs by meeting regulator-specified luminance without advanced rendering. However, AR-HUD installations are climbing at a 16.52% CAGR as falling micro-LED prices and stronger GPUs enable depth-accurate overlays. Cadillac’s 2026 Vistiq will use Envisics holographic waveguides to place turn prompts at true-road distance, promising intuitive guidance. AR units fulfill the Level 3 automated-driving perception criteria as accuracy improves, positioning them for mainstream rollout. Therefore, the Automotive Head-Up Display market size for AR systems will gain share, especially once full-color yield hurdles are cleared.
By Sales Channel: OEM Leads While Aftermarket Builds Momentum
Factory-fitted HUDs composed 73.60% of the automotive head-up display market share in 2025, since integration at the design stage allows optimized optical paths and qualifies the feature for warranty bundles. Visteon booked USD 2.6 billion in 2024 display contracts, illustrating OEM’s preference for single-supplier cockpit modules. On the other hand, aftermarket kits are forecast to outpace OEM growth at 17.05% CAGR through 2031. Declining PGU costs have enabled sub-USD 250 plug-and-play products that appeal to tech-savvy drivers keeping vehicles longer. Retailers invest in training to shorten install time and preserve ADAS camera calibration, smoothing customer adoption. Hence, the Automotive Head-Up Display market will evolve with dual architecture paths: deep OEM integration for new platforms and modular accessories for the car parc in operation.
By Vehicle Type: Passenger Cars Command Today; Commercial Fleets Target Tomorrow
Passenger cars drove 80.55% of the automotive head-up display market share in 2025 due to consumer appetite for immersive infotainment and regulatory demands for distraction-free ADAS warnings. Commercial trucks and buses, however, promise the steepest climb at 16.96% CAGR through 2031, because fleet managers quantify safety gains in insurance savings and uptime. OEMs now market HUD-equipped tractors that color-code blind-spot alerts, assisting long-haul drivers who contend with fatigue. As telematics platforms mature, operators will integrate HUD-delivered fuel-efficiency coaching, broadening business cases and lifting the commercial segment's Automotive Head-Up Display market size.
Geography Analysis
Europe’s 36.90% of the automotive head-up display market share in 2025 stems from statutory driver-assistance display mandates and dense premium-vehicle sales. BMW, Audi, and Mercedes-Benz embed HUDs as standard on top trims, reinforcing buyer perception that projection is integral to safety packages. The regulatory backdrop under UNECE WP.29 creates a baseline technical specification, ensuring a steady pipeline of orders to tier-1s headquartered in the region. Local suppliers capitalize on proximity to OEM engineering centers, keeping iteration loops short and ensuring conformity with ISO 26262 validation audits.
Asia-Pacific charts the highest regional CAGR at 16.24% through 2031. Chinese brands like Li Auto and Nio use HUDs to differentiate software-defined cockpits, mirroring smartphone-grade UX. Taiwanese semiconductor firms supply specialized driver ICs, trimming the bill of materials and anchoring regional cost leadership. Government incentives that promote intelligent-vehicle production further stimulate adoption. The supply-chain density enables rapid engineering cycles, letting automakers deploy yearly HUD refinements that cater to tech-savvy domestic buyers.
North America leverages luxury SUVs and pickup trucks to widen adoption. Cadillac’s upcoming AR-HUD launch signals Detroit’s commitment, while aftermarket fitment thrives in a large used-vehicle base. The revised NCAP encourages OEMs to favor windshield projection for speed-assistance alerts. These factors lift regional demand even as a lower fleet-renewal tempo moderates volume compared with Asia.
Other regions, including the Middle East and Latin America, remain nascent yet attractive. Premium-import growth and rising safety-feature awareness will nudge penetration upward, helped by falling optics costs. Suppliers target these markets with modular combiner kits that bypass windshield variance and simplify homologation.

Regulatory Landscape
Regulation affecting automotive head-up displays is anchored in driver-visibility, driver-distraction, and functional-safety expectations rather than a single HUD-only law. In Europe, UNECE WP.29 frameworks and UN Regulation No. 125 (forward field of vision) are key, because HUD and field-of-vision assistant concepts must not obstruct the driver view, and HUD placement and brightness guidance is referenced via working-group outputs, including the GRSG IWG Field of Vision Assistant/HUD layout guidance used by industry (with JAMA-aligned layout guidance).
Standardization is tightening around measurable HUD performance and test procedures. ISO/TS 21957:2023 defines measurement methods for HUD optical properties, geometry, and ergonomics, while SAE J1757-2 provides optical-system requirements and acceptance thresholds, including ghost-image separation limits. In April 2026, GRSG-131 session proposals were submitted to WP.29 for a supplement to the 03 series of amendments to UN R125 that address Category X and Y vehicles and automated driving system integration, reinforcing the need for compliant HUD optical layouts, brightness control, and fault-handling behavior across more vehicle types.
Value Chain Analysis
The automotive HUD value chain starts with core components (picture generation unit and processing ICs, illumination sources, optical engines, mirrors/waveguides/HOE films, and coatings/interlayers), then moves to system integration by Tier-1s that deliver validated HUD modules to OEM programs. Windshield HUDs add a glazing-dependent layer, where automotive glass makers, lamination houses, and film/material suppliers co-engineer wedge angles, interlayers, and embedded optical elements to control ghosting and maintain optical alignment across vehicle builds and service replacement.
Recent collaborations show a shift from discrete sourcing to alliance-led industrialization for complex optics. In February 2026, ZEISS, tesa, Saint-Gobain Sekurit, and Hyundai Mobis formed QuadAlliance to industrialize holographic windshield displays, combining optics, adhesives/films, glazing, and module integration. Earlier steps toward deeper vertical collaboration include Eastman, Ceres Holographics, and Covestro signing a December 2024 MOU on laminated holographic in-plane transparent display solutions, and Visteon partnering with FUTURUS in September 2025 to co-develop AR, windshield, and panoramic HUD systems, indicating tighter coupling between materials, optics IP, software, and Tier-1 integration for OEM design-in.
Competitive Landscape
Competition is moderate, shaped by a blend of diversified tier-1s and focused holographic start-ups. Continental, Denso, and Panasonic exploit scale and platform breadth to secure multi-year supply agreements. Holographic specialists like Envisics and WayRay carve niches by licensing waveguide IP that promises thinner modules and broader fields of view. Their design-win with Cadillac validates readiness for series production and pressures incumbents to upgrade optical stacks.
Strategic collaborations multiply. Optics firms embrace alliances with windshield glass producers to co-engineer low-wedge laminates, reducing ghost images and assembly variability. Semiconductor players collaborate with projector makers to match LED drive patterns to automotive thermal envelopes. Patents now center on compensating surface non-uniformity and refining eye-box tracking. Suppliers that marry intellectual property with manufacturing robustness will command price premiums even as baseline hardware commoditizes.
The shifting landscape also favors software expertise. 5G-enabled content delivery turns HUDs into digital-service portals, letting suppliers harvest recurring revenue. Companies that secure over-the-air update pipelines differentiate beyond optics and capture value long after vehicle sale. Meanwhile, commercial-vehicle white spaces remain open. Vendors that adapt their propositions to fleet telematics could tap an underserved but high-growth pocket of the Automotive Head-Up Display market.
Automotive Head-up Display Industry Leaders
Continental AG
DENSO Corporation
Visteon Corporation
Robert Bosch GmbH
Nippon Seiki Co. Ltd
- *Disclaimer: Major Players sorted in no particular order


Market Opportunities and Future Outlook
One near-term opportunity is the standard-driven scale-up of AR-HUD and next-generation windshield display architectures, where suppliers can translate compliance and validation work into faster OEM program adoption. In May 2026, ISO advanced a new project (ISO/AWI 21957) covering visibility, specifications, and test procedures for automotive head-up displays, which should support more repeatable qualification across platforms and regions. With Europe already enforcing broader ADAS visibility requirements through safety regulation regimes and UNECE-aligned technical expectations, OEM-fitted HUDs continue to draw structured demand as a primary HMI for speed assistance, lane-keeping cues, and navigation overlays.
A second opportunity is industrializing full-windshield and holographic approaches that reduce packaging constraints and expand the design space beyond conventional combiner and standard windshield HUDs. Hyundai Mobis and its QuadAlliance partners (ZEISS, tesa, Saint-Gobain Sekurit) publicly framed a path to commercialize holographic windshield display technology with a mass-production target by 2029, creating room for materials, lamination process control, and optical metrology providers that can meet automotive reliability and service-replacement tolerances. On the component side, microLED and advanced light engines remain central to automotive HUD roadmaps, with companies such as Tianma describing planning horizons for automotive microLED applications, including HUDs, around the 2031-2032 model-year window, encouraging suppliers to improve yield, thermal design, and optical efficiency to support brighter AR overlays with lower power and thinner modules.
Recent Industry Developments
- February 2026: ZEISS, tesa, Saint-Gobain Sekurit, and Hyundai Mobis formed QuadAlliance to industrialize holographic windshield display technology. The collaboration brings together optics, materials/adhesives, glazing, and Tier-1 system integration, focusing on manufacturability and automotive-grade lamination as key gating items for windshield-class HUDs.
- December 2025: MediaTek and DENSO announced a strategic partnership to develop an integrated cockpit and ADAS platform based on MediaTek Dimensity Auto technology, including plans tied to advanced 3nm/4nm processes. Higher compute headroom and tighter cockpit-ADAS integration are intended to support richer HUD rendering and faster fusion of safety alerts into the driver sightline.
- December 2024: Continental announced its Emotional Cockpit concept featuring advanced display integration and Swarovski crystal elements, ahead of its planned CES 2025 premiere. The concept highlights how premium cockpit design themes and new HMI surfaces are being packaged alongside HUD-centric experiences, reinforcing HUD positioning as part of an integrated display stack rather than a standalone option.


Research Methodology Framework and Report Scope
Market Definition and Coverage
This market covers the revenue generated from automotive head-up display (HUD) systems that project key driving information into the driver's line of sight, supplied for fitment in passenger cars and commercial vehicles across major regions.
Scope exclusions: We exclude non-automotive HUDs used in aviation, defense, and consumer wearables, and we also exclude related cockpit displays that do not project as a HUD.
Segmentation Overview
- HUD Type
- Windshield HUD
- Combiner HUD
- Technology
- Conventional HUD
- Augmented-Reality (AR) HUD
- Sales Channel
- OEM-fitted
- Aftermarket
- Vehicle Type
- Passenger Cars
- Commercial Vehicles
- By Geography
- North America
- United States
- Canada
- Rest of North America
- South America
- Brazil
- Argentina
- Rest of South America
- Europe
- Germany
- United Kingdom
- France
- Italy
- Spain
- Russia
- Rest of Europe
- Asia-Pacific
- China
- Japan
- India
- South Korea
- Rest of Asia-Pacific
- Middle East and Africa
- United Arab Emirates
- Saudi Arabia
- Turkey
- Egypt
- South Africa
- Rest of Middle East and Africa
- North America
Data Sources, Market Sizing, and Validation
Desk Research
Desk work was used to build the first structure of the model and to anchor it to measurable vehicle and technology signals. We relied on public sources such as OICA vehicle production statistics, UN Comtrade trade flows for relevant automotive electronics, NHTSA and Euro NCAP safety documentation, and standards references from SAE International for display-related terminology. We also reviewed patent databases to understand the pace of AR-HUD optics and projection developments that influence pricing and adoption assumptions.
To complete the picture, we cross-checked disclosures from annual reports, investor presentations, and credible press coverage for HUD program launches and plant expansions. We also used paid subscriptions focused on company financials and intelligence, plus news and financials, to track corporate moves and to avoid missing ownership or reporting changes. This list is not exhaustive, and many other public and subscription sources were referred to for data collection, validation, and research clarification.
Primary Interviews and Surveys
Primary work was carried out through expert interviews and structured surveys with a mix of vehicle OEM stakeholders, HUD component and system suppliers, and downstream channel participants familiar with fitment decisions and pricing. Since this is a global market, inputs were balanced across APAC, EMEA, and the Americas to confirm adoption direction by vehicle class and to sanity check AR-HUD ramp timelines. When a key assumption moved the total materially, it was revisited with additional calls until the range narrowed to a defensible level.
Distribution of primary research fieldwork respondents
| Company type | Respondent position | Region |
|---|---|---|
| Top tier: 29% | CXOs: 13% | APAC: 40% |
| Mid tier: 56% | Functional/Unit leaders: 29% | EMEA: 36% |
| Smaller Players: 15% | Managers: 58% | Americas: 24% |
Market-Sizing & Forecasting
Sizing started with a top-down demand pool build that reconstructs HUD value from vehicle production and sales, and then applies fitment rates by vehicle type, region, and installation channel (OEM-fitted versus aftermarket). Into that structure, we layer technology mix shifts between conventional HUD and AR-HUD, because these have different bill-of-material intensity and pricing paths.
The model is kept grounded using a small set of repeatable inputs, such as passenger car versus commercial vehicle output, premium vehicle share trends that influence take rates, AR-HUD penetration targets shared by industry experts, typical unit pricing and its decline curve as volumes scale, and regional safety and driver-assistance feature adoption that indirectly pushes HUD inclusion. Results are then corroborated with selective bottom-up approximations, including sampled ASP times estimated shipments and supplier revenue share checks. Where disclosure is limited for a given region, we use conservative ranges first, and then normalize against global totals.
For forecasting, we leaned on scenario analysis supported by expert consensus on two swing factors, namely AR-HUD timing and HUD fitment expansion into mid-priced models. This approach keeps the forecast explainable, while still reflecting how faster model launches or slower optics cost-down can move the market.
Data Validation & Update Cycle
Outputs are checked against independent signals like vehicle build trends, known program launches, and whether implied per-vehicle HUD spending stays realistic across regions. If a segment shows a sharp jump that cannot be explained by production, pricing, or mix change, the assumptions are reopened and the calculations are replayed before internal sign-off.
Reviews happen in steps, starting with analyst self-checks, followed by peer review for logic and consistency, and then final editorial validation for alignment to scope. Reports are refreshed annually, and interim updates are made when material events occur, such as major platform wins, regulatory shifts, or supply constraints. Before delivery, a fresh pass is completed so clients receive the most current view available at that time.
Mordor Intelligence's Automotive Head Up Display Market Size Compared Against Other Published Estimates
It is normal to see different market sizes for automotive HUDs, even when everyone is trying to measure the same demand. The spread usually comes from what is counted in scope, how base-year pricing is treated, and whether adoption is tied to real vehicle output or to broader technology narratives.
By tracking OEM-fitted versus aftermarket splits and refreshing currency timing and ASP progression, Mordor Intelligence keeps the estimate aligned to vehicle production and realistic HUD take rates, rather than mixing adjacent cockpit displays or using aggressive AR-HUD ramp assumptions. Differences also come from year selection, where some sources cite 2024 or 2025 as the current year, and from whether AR-HUD is priced using early launch premiums or a faster cost-down curve.
Benchmark comparison
| Source | Market Size | Gaps in Research Methodology |
|---|---|---|
| Mordor Intelligence | USD 1.79 B (2026) | |
| Regional Consultancy A | USD 1.10 B (2024) | Uses an earlier base year and typically applies narrower fitment assumptions, which can undercount the OEM ramp in newer model years and regions where HUD penetration is accelerating. |
| Global Consultancy B | USD 2.36 B (2025) | Assumes faster adoption and higher pricing uplift from advanced HUD types across vehicle classes, which can inflate totals if AR-HUD volumes and price declines are not phased in with production-linked checks. |
Looking across the three numbers, the main drivers are the base year chosen and how adoption and pricing are connected to actual vehicle build and trim mix. Keeping the scope limited to automotive HUD systems, and then translating penetration and pricing into a vehicle-linked revenue build, makes the final value easier to trace and reproduce.


Key Questions Answered in the Report
How large is the Automotive Head-Up Display market in 2026?
The Automotive Head-Up Display market size is USD 1.79 billion in 2026.
What CAGR is expected for Automotive Head-Up Display solutions through 2031?
The market is projected to grow at a 15.65% CAGR during 2026-2031.
Are AR-HUD systems set to overtake conventional HUDs?
AR-HUD deployments are expanding at 16.52% CAGR, outpacing conventional units and narrowing the cost gap.
Do aftermarket HUD kits represent a significant opportunity?
Yes, aftermarket channels are expected to grow at 17.05% CAGR as retrofit solutions become more affordable and easier to install.
What limits HUD integration in compact cars?
Windshield packaging space and ghost-image mitigation remain key engineering challenges for small-format vehicles.
Page last updated on:






