Automotive Green Tires Market Size and Share
Market Overview
| Study Period | 2020 - 2031 |
|---|---|
| Market Size (2026) | USD 148.22 Billion |
| Market Size (2031) | USD 247.90 Billion |
| Growth Rate (2026 - 2031) | 10.84% CAGR |
| Fastest Growing Market | Asia-Pacific |
| Largest Market | Asia-Pacific |
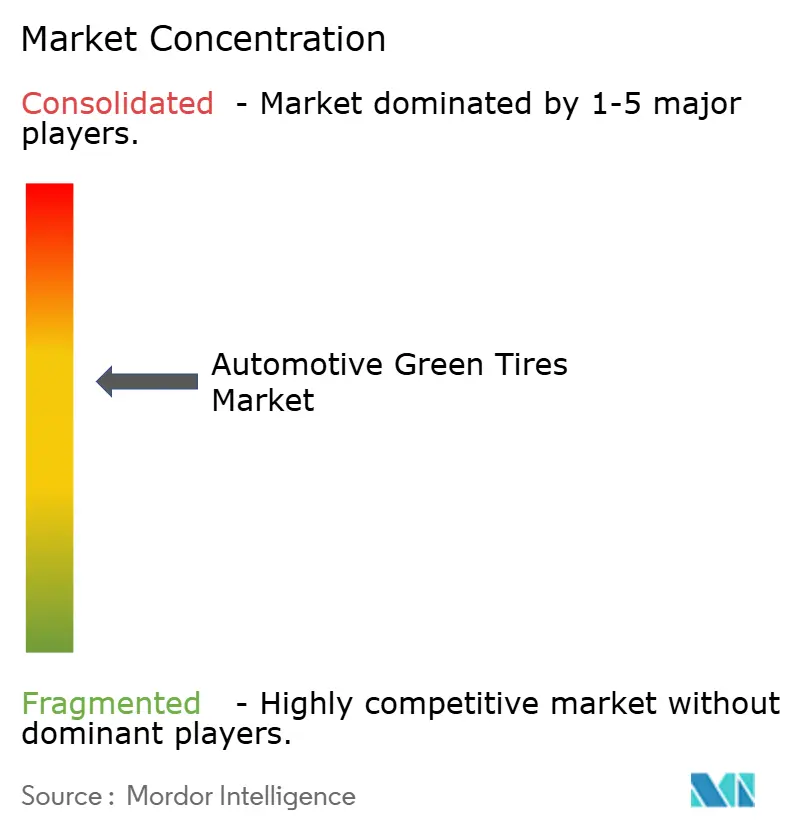
| Market Concentration | Medium |
Major Players *Disclaimer: Major Players sorted in no particular order Image © Mordor Intelligence. Reuse requires attribution under CC BY 4.0. | |
Automotive Green Tires Market Analysis by Mordor Intelligence
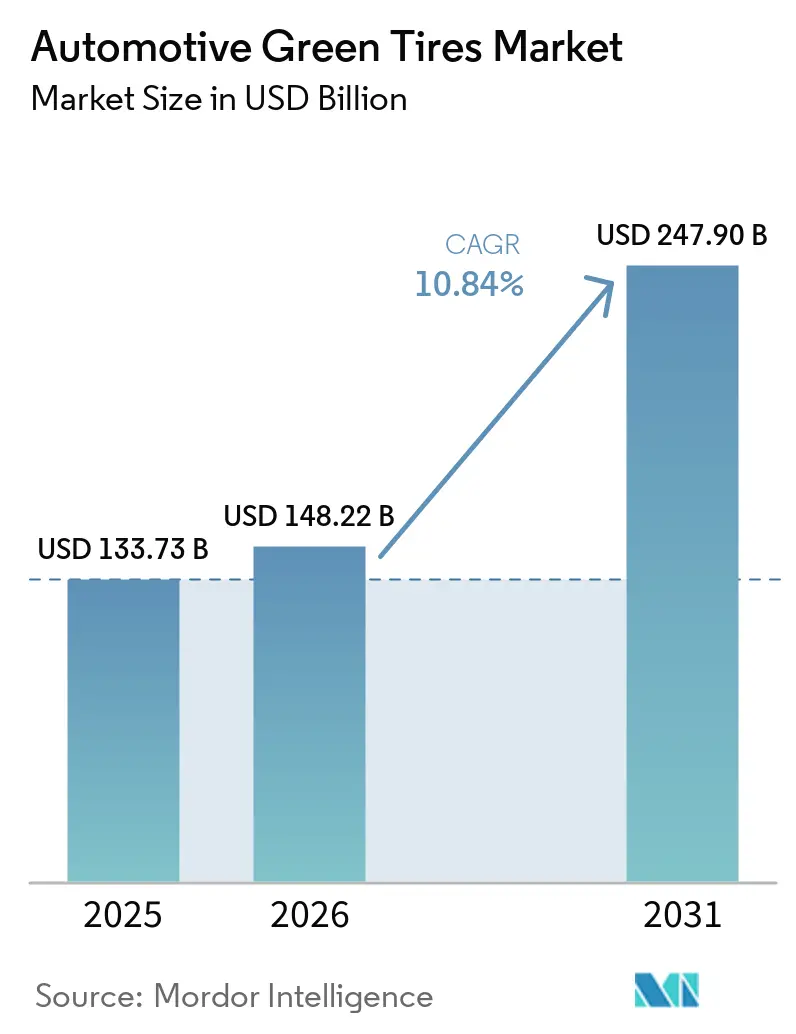
The Automotive Green Tires market size is expected to grow from USD 133.73 billion in 2025 to USD 148.22 billion in 2026 and is forecast to reach USD 247.9 billion by 2031 at 10.84% CAGR over 2026-2031. Electrification of global vehicle fleets, Euro 7 tire particulate limits, and corporate Scope-3 decarbonization targets have turned environmental performance into a core design metric. Scaling of rice-husk-ash silica in ASEAN, rapid smart-sensor deployment, and government funding for bio-based polymers are lowering lifecycle costs and widening addressable demand. Consolidation is accelerating as large manufacturers acquire circular-economy capabilities and secure bio-rubber feedstocks. Supply-chain exposure to Southeast-Asian latex and pending global test-method harmonization for tire particulates remains the principal execution risk.
Key Report Takeaways
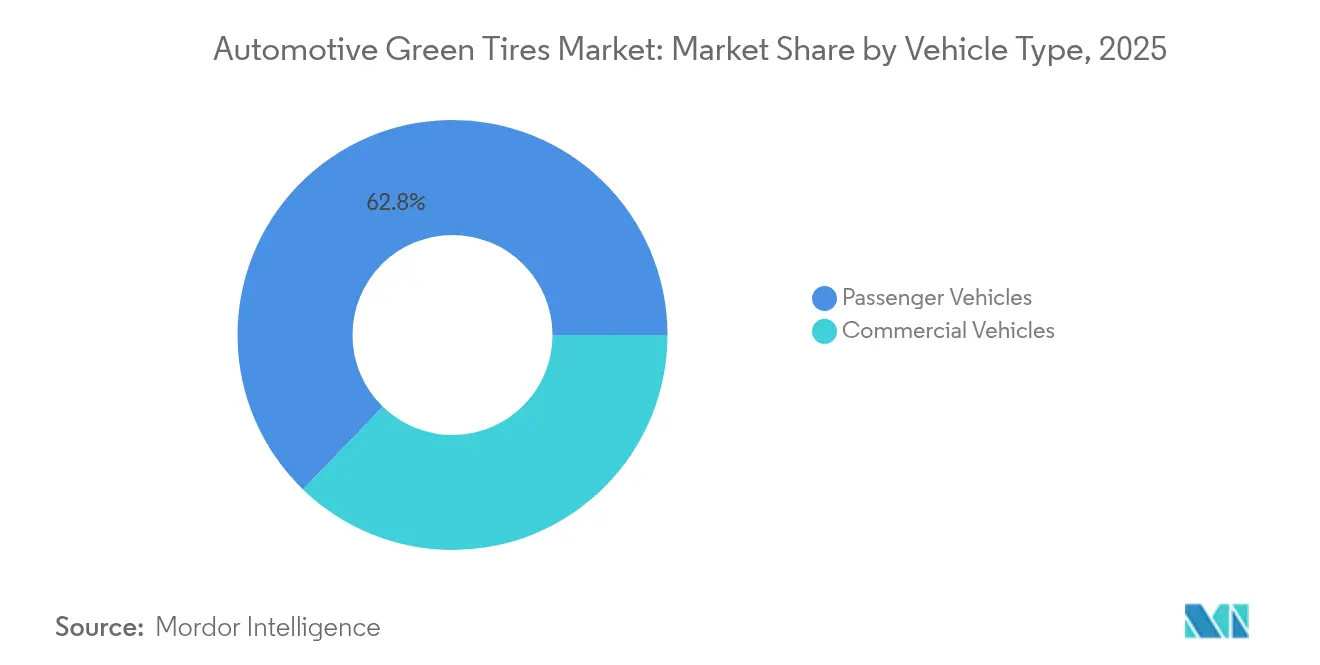
- By vehicle type, passenger vehicles held 62.76% of revenue in 2025, while commercial vehicles are forecast to post the highest 12.05% CAGR through 2031.
- By end-user, the OEM led with a 67.85% share in 2025; Aftermarket fitments are projected to expand at a 9.55% CAGR to 2031.
- By material type, silica-based composite tires accounted for 52.83% of the sustainable tire market share in 2025, and the recycled-material segment is set to grow fastest at a 9.28% CAGR.
- By distribution channel, offline sales dominated with an 82.52% share in 2025, whereas online platforms are expected to advance at a 9.41% CAGR between 2026 and 2031.
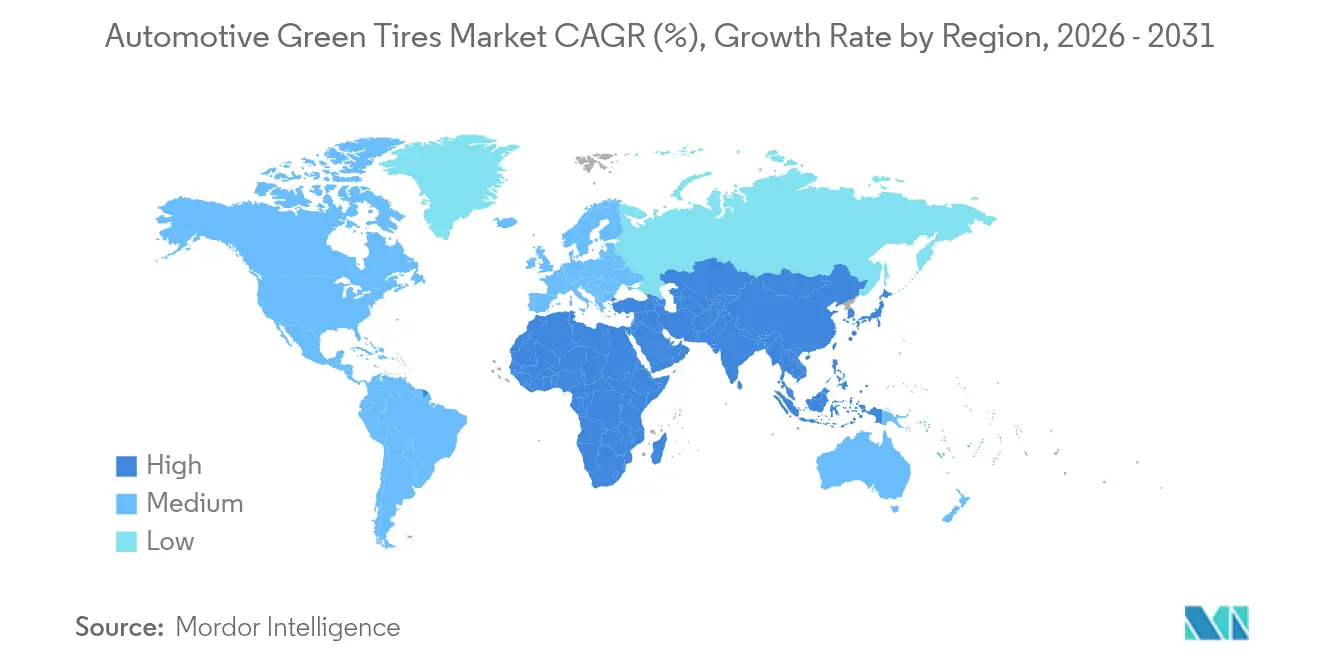
- By geography, Asia-Pacific captured 49.10% of 2025 revenue and is projected to lead regional growth with a 9.37% CAGR through 2031.
Note: Market size and forecast figures in this report are generated using Mordor Intelligence’s proprietary estimation framework, updated with the latest available data and insights as of 2026.
Global Automotive Green Tires Market Trends and Insights
Drivers Impact Analysis*
| Driver | (~) % Impact on CAGR Forecast | Geographic Relevance | Impact Timeline |
|---|---|---|---|
| EV-Production Surge | +2.1% | Global – Asia-Pacific & North America lead | Medium term (2–4 years) |
| CO₂- and Labeling Rules | +1.8% | Europe & North America, spreading to Asia-Pacific | Short term (≤ 2 years) |
| Replacement-Tire Boom | +1.4% | Global, aftermarket-heavy in mature markets | Short term (≤ 2 years) |
| Smart-Sensor Integration | +1.2% | North America & Europe first, Asia-Pacific next | Medium term (2–4 years) |
| OEM Scope-3 Focus | +0.9% | Multinational OEMs worldwide | Long term (≥ 4 years) |
| ASEAN Rice-Husk Silica | +0.7% | ASEAN core, exporting to wider Asia-Pacific | Long term (≥ 4 years) |
| Source: Mordor Intelligence | |||


Surging Electric-Vehicle (EV) Production
Global EV assembly lines require tires that handle instant torque, low noise, and minimal rolling resistance. New FMVSS 305a rules, effective December 2025, align tire safety with battery-electric drivetrains [1]“FMVSS upgrades for electric vehicles,”, National Highway Traffic Safety Administration, nhtsa.gov. General Motors plans 1 million EV units of annual North American capacity by 2025, magnifying demand for specialized compounds. Environmental standards for 2027–2032, EPA multi-pollutant standards target a 50% GHG cut in light-duty vehicles, reinforcing the shift. These regulations embed EV-centric performance in every new passenger and commercial platform. As automakers race to extend driving range, tires optimized for battery efficiency become a procurement priority
Stricter global CO₂ & Tire-Labelling Regulations Reshape Product Development
Euro 7 introduces the world’s first mandatory tire-wear particulate caps beginning July 2028 [2]“Euro 7 standards and ESPR work plan,”, European Commission, ec.europa.eu. The Ecodesign for Sustainable Products Regulation will add digital product passports for tires by April 2025, capturing the end-to-end lifecycle. China’s 2024 carbon footprint standard obliges tire producers to quantify emissions across manufacturing stages. The U.S. Tire Manufacturers Association has identified five potential 6PPD alternatives to meet California’s Safer Consumer Products rule. Compliance now confers a tangible branding advantage, rewarding firms that embed environmental metrics into core design rather than bolt-on labeling.
Booming Replacement-Tire Demand Creates Aftermarket Opportunities
Post-pandemic driving rebounds and larger rim sizes are lifting replacement volumes. California’s Heavy-Duty Inspection and Maintenance program steers fleets toward low-rolling-resistance models to pass OBD-linked checks. Updated FMVSS reference tire specifications signal industry-wide movement to higher load classes. Rising CAFE targets of 2% yearly for passenger cars through 2031 pressure fleets to adopt tires that trim fuel use. Replacement buyers increasingly compare lifetime savings against upfront premiums.
Smart-Tire Sensor integration Transforms Lifecycle Economics
TPMS in 49 CFR 571.138 required on vehicles under 10,000 lb lays the groundwork for richer telemetry. The Global Data Service Organisation is standardizing data pipes that feed predictive maintenance dashboards [3]“Standardized tire data platform,” , Global Data Service Organisation, gdso.org. UNECE Reg. 141 and 142 harmonize global sensor-readiness slots unece.org. Road-condition IoT studies reveal 3.4% energy swings tied to pavement roughness, showing value in adaptive pressure control. When paired with low-carbon materials, data-rich tires unlock new cost-of-ownership models for fleets.
Restraints Impact Analysis*
| Restraint | (~) % Impact on CAGR Forecast | Geographic Relevance | Impact Timeline |
|---|---|---|---|
| Cost Premium Vs. Conventional | -1.6% | Global, price-sensitive emerging markets | Short term (≤ 2 years) |
| Load Limit in Heavy Fleet | -0.8% | North America & Europe | Medium term (2–4 years) |
| Bio-Rubber Feedstock Competition | -0.6% | Global, sourcing in Southeast Asia | Medium term (2–4 years) |
| EU Particulate Caps Delay | -0.4% | Europe with global spillover | Long term (≥ 4 years) |
| Source: Mordor Intelligence | |||
High Upfront Cost Premium Challenges Market Penetration
EPA hazardous-air-pollutant rules add USD 13.3 million in annual compliance expense to U.S. tire plants [4]“Multi-pollutant emissions standards 2027–2032,”, Environmental Protection Agency, epa.gov. China’s 2024-2025 Energy Conservation action plan tightens industrial emissions, raising local production costs. DOE’s USD 88 million Vehicle Technologies grants acknowledge that greener mobility still needs subsidies to close cost gaps. Premium pricing strains fleet budgets that prioritize payback horizons shorter than tire life. Credit access in emerging economies further slows uptake.
Load-Bearing Limits in Heavy Commercial Fleets Constrain Adoption
EPA Phase 3 GHG rules for heavy-duty trucks heighten interest in sustainable options, but payload tolerance remains non-negotiable. DOE notes that polymer science for tires trails battery R&D in funding and maturity. Haulers value reliability over environmental gains, requiring bio-rubber blends that match steel-belt endurance. Without material breakthroughs, adoption in long-haul trucking will lag passenger and light commercial segments.
*Our forecasts treat driver/restraint impacts as directional, not additive. The impact forecasts reflect baseline growth, mix effects, and variable interactions.
Segment Analysis
By Vehicle Type: Commercial fleets accelerate adoption
Commercial vehicles added a 12.05% CAGR growth lane, even though passenger cars retained the largest share with 62.76% in 2025. Smart-sensor packages and lower rolling resistance allow operators to cut fuel bills, offsetting the price premium. EPA CAFE increments and fleet electrification mandates amplify this calculus. In contrast, consumer uptake depends on brand messaging and dealership influence. As commercial trials validate durability, the sustainable tire market continues diversifying, encouraging volume scaling that benefits all categories. Over time, passenger-vehicle adoption will gain from cost curves established in freight.
Commercial platforms also expose tires to higher torque from electric drivetrains, accelerating compound innovation. Fleet managers use telematics to analyze wear, reinforcing demand for data-ready, low-carbon models. California and the EU policies link commercial-fleet emissions to procurement credits, further tipping decisions toward sustainable technologies. Passenger market growth remains steady but faces income-elastic buying behavior, slowing conversion outside subsidized jurisdictions.


By End-User: OEM integration rises
Aftermarket programs are growing at a 9.55% CAGR, slowly eroding the OEM's 67.85% hold. Automakers embed tire carbon data in supplier scorecards to hit Scope-3 targets. GM’s carbon-neutral pledge by 2040 exemplifies the direction. Large volume contracts give tire firms forecast clarity, supporting long R&D paybacks. Meanwhile, aftermarket channels rely on consumer awareness and installer recommendations, factors less reliable for rapid penetration.
OEM growth shifts bargaining power, requiring manufacturers to align with vehicle development cycles and digital passport requirements. Suppliers that meet automaker thresholds gain repeat volume and brand exposure on every new model. Aftermarket demand remains sizeable, especially for replacement in aging vehicle parks, but growth moderates as OEM fitments lock in sustainable options at first sale.
By Material Type: Recycled compounds gain ground
Given their proven rolling-resistance benefits, Silica composites still dominate with a 52.83% share. Yet recycled-compound tires chart a 9.28% CAGR on the back of EU end-of-life directives mandating 25% recycled plastic in new vehicles. European demonstration plants convert textile fibers from scrap tires into new asphalt and polymers, validating circular flows. The sustainable tire market size for recycled materials will expand fastest within the segment.
Bio-polymers such as ethanol-based butadiene attract DOE funding and Bridgestone partnerships. Soy-derived rubber and cellulose nanofibers backed by Japanese grants promise strength comparable to synthetic rubber. If performance parity is achieved, recycled and bio-based mixes will chip away at legacy silica’s lead.

By Distribution Channel: Online commerce accelerates within an offline-dominated landscape
Offline dealers and retail chains accounted for 82.52% of the sustainable tire market share in 2025. This dominance reflects the need for professional installation, sensor calibration, and post-sale support that most consumers still expect from brick-and-mortar outlets. Long-standing relationships with fleet operators allow dealers to bundle tires with maintenance contracts, reinforcing channel stickiness. Because many sustainable tire SKUs require specialized handling and end-of-life recycling advice, physical outlets hold an advisory edge that online sites have yet to match.
Even so, online platforms form the fastest-growing distribution segment and are set to expand at a 9.41% CAGR between 2026 and 2031. E-commerce vendors use standardized data feeds from the Global Data Service Organisation to present rolling-resistance scores and lifecycle carbon footprints in user-friendly formats, GDSO. Digital storefronts also broaden access to niche recycled-compound lines, adding incremental gains to the sustainable tire market size among tech-savvy buyers. Fleet managers increasingly rely on web portals integrating procurement with telematics dashboards, further shifting demand toward online channels. As omnichannel strategies mature, manufacturers that synchronize inventory across physical and digital shelves can capture growth while preserving the hands-on service quality that underpins offline loyalty.
Geography Analysis
Asia-Pacific held 49.10% of the sustainable tire market share in 2025 and is projected to grow at a 9.37% CAGR through 2031. China’s 14th Five-Year Plan seeks a 20% rise in resource productivity and identifies tire-rubber recycling as a priority. India enforces wet-grip, rolling-resistance, and noise limits that align domestic production with export expectations. Japan funds cellulose-nanofiber pilot lines that can cut lifecycle emissions in tire compounds. These coordinated policies build localized supply chains, buffer import risks, and keep Asia-Pacific at the center of sustainable tire innovation.
Europe anchors growth by writing environmental criteria directly into law, giving manufacturers predictable demand for low-impact compounds. Euro 7 particulate caps and the Ecodesign digital passport will soon require verifiable data on tire wear and carbon footprints. Investments in recovered carbon black and pyrolysis clusters help companies close material loops and secure compliance credits. Firms that meet these benchmarks gain export leverage because many emerging markets adopt EU norms.
North America blends federal research grants with state recycling incentives, steering the sustainable tire market toward circular models. DOE funding for bio-butadiene and California’s Tire Incentive Program illustrate the mix of upstream innovation and downstream demand pulls. Fleet operators value data-rich tires that simplify compliance with tighter heavy-duty greenhouse-gas standards, lifting uptake on long-haul routes. South America, the Middle East, and Africa expand more slowly yet adopt EU labeling to safeguard export access. Multinational OEM procurement guidelines diffuse sustainable technologies into these price-sensitive regions, gradually lifting the sustainable tire market size beyond its traditional strongholds.

Competitive Landscape
Global producers cluster R&D around bio-based polymers, circular partnerships, and integrated sensing. Goodyear targets net-zero operations by 2050 and promises 100% sustainable-material tires by 2030, already marketing an EcoReady line with 70% renewable content. Bridgestone works with the DOE and Pacific Northwest National Laboratory on ethanol-to-butadiene conversion, a step toward synthetic rubber with lower carbon intensity.
Data standardization opens service revenues are gaining momentum, companies are aligning with the data service organisations embed diagnostics that feed fleet dashboards, allowing predictive maintenance contracts. Smaller brands struggle to match this digital plus material innovation mix. M&A activity centers on pyrolysis startups and recovered-carbon-black producers as incumbents secure feedstock.
Regulatory foresight becomes a moat, early compliance with Euro 7 particulate metrics and ESPR digital passports eases market entry once rules activate. Players lacking certified compounds risk exclusion from OEM tenders. Specialized niches remain in agriculture and mining where performance thresholds differ, offering space for new entrants with tailored formulations.
Automotive Green Tires Industry Leaders
Michelin Group
Bridgestone Corporation
Continental AG
The Goodyear Tire & Rubber Company
Pirelli & C. S.p.A.
- *Disclaimer: Major Players sorted in no particular order

Recent Industry Developments
- October 2024: Pacific Northwest National Laboratory and Bridgestone launched a USD 10 million pilot to scale ethanol-derived butadiene for synthetic rubber.
- October 2024: Bridgestone Americas received a DOE grant to design a bio-butadiene pilot plant aiming for 100% sustainable raw materials in tires by 2050.
- February 2024: Life for Tyres Group committed USD 46 million for a Louisiana plant turning end-of-life tires into recovered carbon black and bio-oil.


Research Methodology Framework and Report Scope
Market Definitions and Key Coverage
Our study defines the automotive green tires market as all new pneumatic passenger and commercial vehicle tires engineered for measurably lower rolling resistance, higher silica or bio-based compound content, and verifiable end-of-life recyclability. These products are factory-fitted or sold as replacement units for on-road cars, vans, buses, and trucks that operate at speeds governed by public road regulations.
Scope exclusion: retreaded casings, two or three wheeler tires, and heavy off-the-road mining or agricultural tires are outside this assessment.
Segmentation Overview
- By Vehicle Type
- Passenger Vehicles
- Commercial Vehicles
- By End-User
- OEM
- Aftermarket
- By Material Type
- Natural-Rubber-Rich Tires
- Synthetic-Rubber-Rich Tires
- Silica-Based Composite Tires
- Bio-Based Polymer Tires
- Recycled-Material Tires
- By Distribution Channel
- Offline (Dealers & Retail Chains)
- Online (E-commerce Platforms)
- By Geography
- North America
- United States
- Canada
- Rest of North America
- South America
- Brazil
- Argentina
- Rest of South America
- Europe
- Germany
- United Kingdom
- France
- Italy
- Spain
- Russia
- Rest of Europe
- Asia-Pacific
- China
- India
- Japan
- South Korea
- Rest of Asia-Pacific
- Middle East and Africa
- Saudi Arabia
- United Arab Emirates
- South Africa
- Egypt
- Rest of Middle East and Africa
- North America
Detailed Research Methodology and Data Validation
Primary Research
Interviews with tire chemists, raw material vendors, fleet managers, and regional distributors across Asia-Pacific, North America, and Europe helped us verify silica loading trends, OEM fitment targets, and average replacement mileage. Follow-up email surveys with labeling scheme officials clarified enforcement timelines that desk research left ambiguous.
Desk Research
Mordor analysts first drew boundary lines by reviewing open data from agencies such as the US Energy Information Administration, Eurostat transport statistics, China MIIT tire label databases, and UN Comtrade customs records. Industry-level insights were then layered from trade bodies like the U.S. Tire Manufacturers Association and ETRMA, patent libraries accessed through Questel, and corporate filings housed on D&B Hoovers and Dow Jones Factiva. Marklines vehicle production tables, Volza shipment logs, and peer-reviewed LRR compound studies supplied volume, price, and technology fingerprints.
We cross-matched these secondary inputs to remove double counts, reconcile unit disparities, and flag outlier ASPs. Additional press coverage, investor decks, and regulatory notes filled smaller gaps. The sources listed are illustrative only, and many other public and subscription assets supported validation.
Market-Sizing and Forecasting
A top-down vehicle parc and new build reconstruction provides the core market pool. We multiply registered vehicles and production units by green tire penetration rates derived from labeling compliance audits and OEM sourcing policies, which are then sanity checked with sampled supplier roll-ups and distributor channel checks. Key variables driving the model include global EV stock, ICE fuel economy mandates, silica price indices, tire replacement intervals, and fleet average mileage.
Five-year projections rely on a multivariate regression that links penetration, ASP progression, and macro indicators to GDP and battery electric share. ARIMA smoothing handles short-term shocks, while scenario analysis adjusts for step change regulation in Europe or China.
Where bottom-up estimates lack granularity, we scale volumes with regional tire duty import data and adjust ASPs using dealer-level mark-up ranges gathered during interviews.
Data Validation and Update Cycle
Outputs face three passes: automated variance flags, senior analyst peer review, and leadership sign-off. We refresh each model annually, with interim updates triggered by material events such as a new EU label class or a spike in silica costs. Before publication, an analyst revalidates every assumption so clients receive the latest view.
Why Mordor's Automotive Green Tires Baseline Commands Reliability
Published estimates often differ because firms draw boundaries around tire types, apply varied penetration assumptions, convert currencies at different dates, or refresh models irregularly.
Key gap drivers include whether off-road and retreaded units are counted, how ASPs adjust for silica premiums, and if future EV share is modeled from announced or installed capacity. Mordor's base case uses a consistent definition, annual refresh, and dual-source price validation, producing a balanced figure buyers can track year after year.
Benchmark comparison
| Market Size | Anonymized source | Primary gap driver |
|---|---|---|
| USD 133.73 billion (2025) | Mordor Intelligence | - |
| USD 154.8 million (2025) | Global Consultancy A | Counts only OE passenger car units and reports in USD million, leading to a scale mismatch |
| USD 11.68 billion (2025) | Industry Association B | Excludes Asia-Pacific and applies constant 2019 ASPs without silica cost escalation |
| USD 11.5 billion (2023) | Trade Journal C | Uses 2023 base year, omits aftermarket sales, and forecasts with single factor EV adoption curve |
These comparisons show that scope breadth, price treatment, and refresh cadence explain much of the variation. Mordor Intelligence combines clear boundaries with regularly updated multi-variable models, giving decision makers a dependable, transparent baseline.


Key Questions Answered in the Report
What is the projected size of the sustainable tire market in 2031?
The sustainable tire market size is forecast to reach USD 247.9 billion by 2031.
Which region leads sustainable tire demand?
Asia-Pacific holds 49.10% revenue and posts the fastest 9.37% CAGR through 2031.
Why are commercial fleets adopting sustainable tires faster than passenger-car owners?
Fleets quantify fuel and maintenance savings, validating payback on premium materials and sensor packages.
How do Euro 7 rules impact tire makers?
Euro 7 sets particulate wear caps from July 2028, forcing manufacturers to redesign compounds and integrate lifecycle tracking.
What technology trend complements green materials?
Smart-tire sensor integration lowers lifecycle costs by enabling predictive maintenance and efficiency analytics.
Page last updated on:


