Automatic Labeling Machine Market Size and Share
Market Overview
| Study Period | 2020 - 2031 |
|---|---|
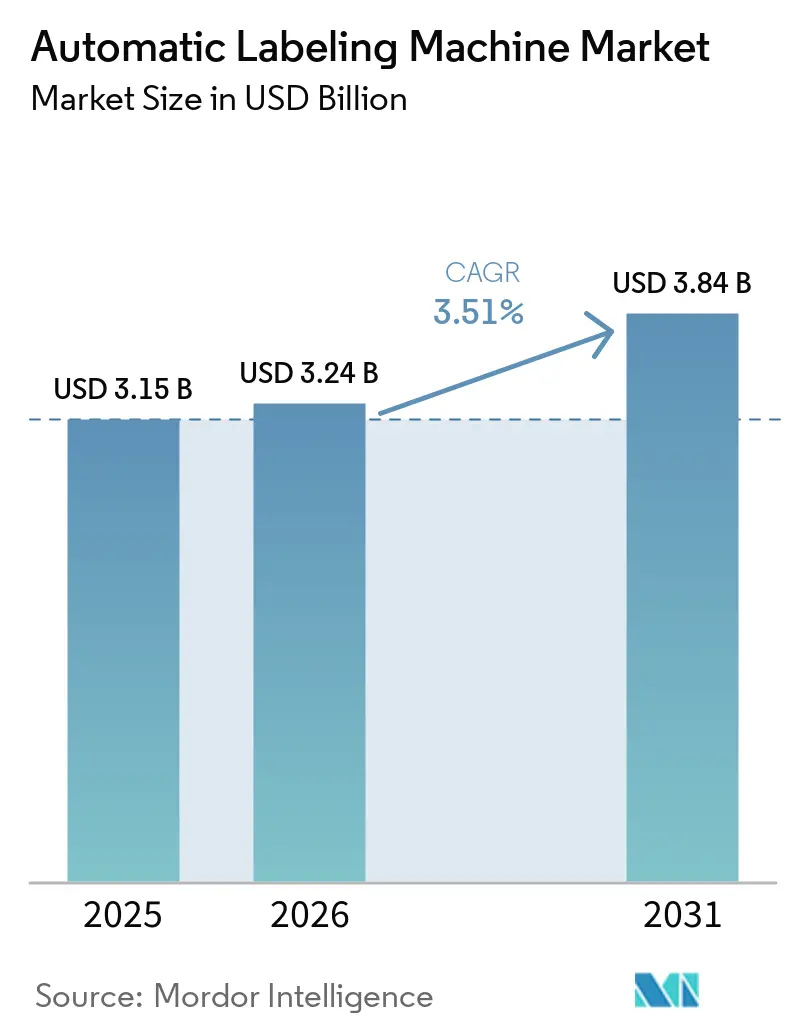
| Market Size (2026) | USD 3.24 Billion |
| Market Size (2031) | USD 3.84 Billion |
| Growth Rate (2026 - 2031) | 3.51% CAGR |
| Fastest Growing Market | Asia Pacific |
| Largest Market | Asia Pacific |
| Market Concentration | Low |
Major Players.webp) *Disclaimer: Major Players sorted in no particular order Image © Mordor Intelligence. Reuse requires attribution under CC BY 4.0. | |
Automatic Labeling Machine Market Analysis by Mordor Intelligence
The automatic labeling machine market size is projected to expand from USD 3.15 billion in 2025 and USD 3.24 billion in 2026 to USD 3.84 billion by 2031, registering a CAGR of 3.51% between 2026 to 2031. The automatic labeling machine market continues to benefit from pharmaceutical serialization deadlines, e-commerce fulfillment velocity, and sustainability mandates that accelerate capital spending on modular, print-on-demand platforms. Pharmaceutical upgrades buoy near-term demand even as food and beverage producers tactically defer broader packaging investments. Beverage and personal-care brands are shifting toward sleeve- and linerless formats that enable 360-degree graphics, tamper-evidence, and waste reduction. Contract packagers and mid-scale craft producers increasingly favor compact, hybrid systems that support rapid SKU proliferation while minimizing floor-space requirements. Vendors able to integrate vision inspection, cloud analytics, and OPC-UA communication into applicators command premium pricing and lock in multi-year service revenues.
Key Report Takeaways
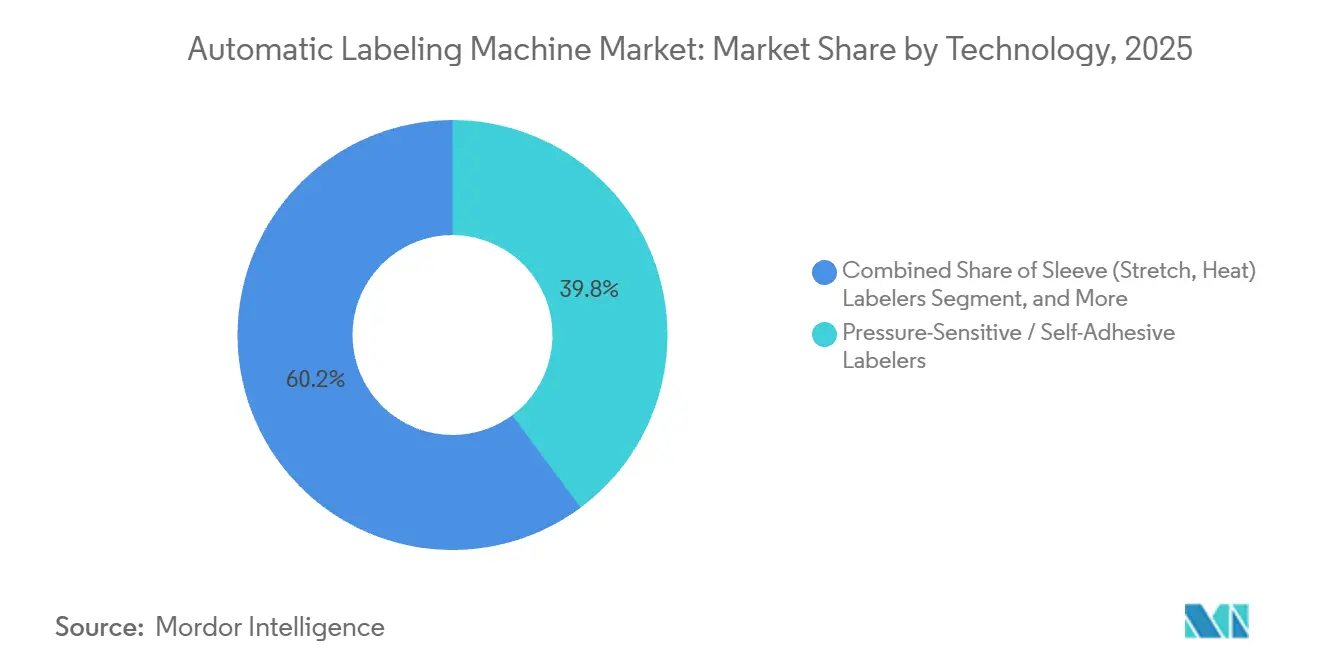
- By technology, pressure-sensitive labeling commanded 39.83% of 2025 automatic labeling machine market share, while sleeve labelers are projected to register the fastest 4.24% CAGR through 2031.
- By machine configuration, in-line systems led with 62.42% market share in 2025, whereas modular and hybrid platforms are forecast to expand at a 4.52% CAGR to 2031.
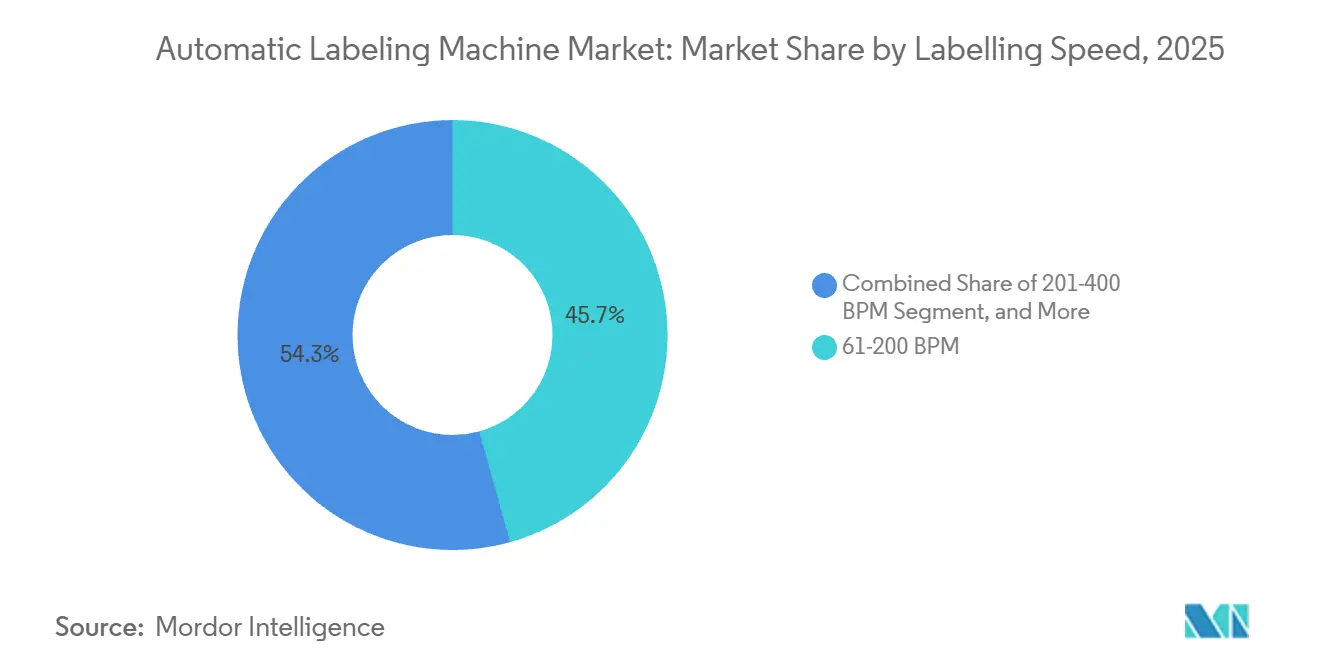
- By labeling speed, the 61-200 BPM tier accounted for 45.68% of market share in 2025, and 201-400 BPM equipment is expected to post the highest 4.67% CAGR over 2026-2031.
- By end user, beverages held 27.71% of the market share in 2025, yet pharmaceuticals are anticipated to grow at a 5.28% CAGR, the quickest pace among all segments.
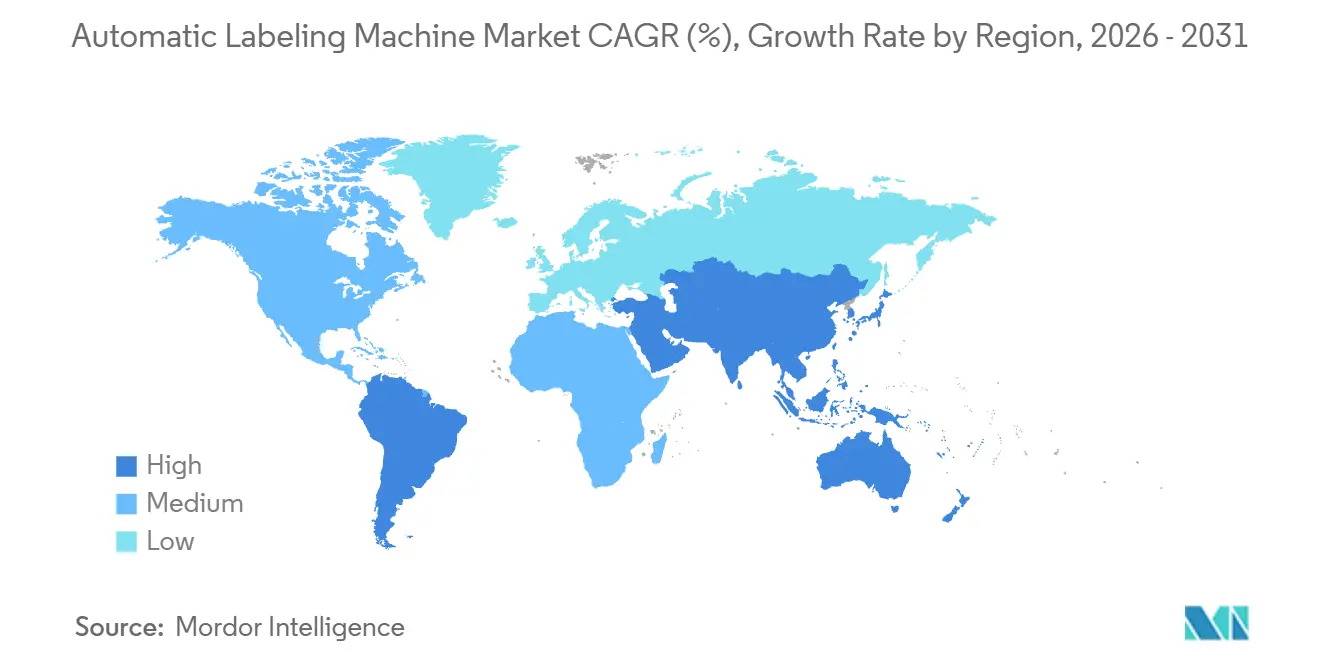
- By geography, Asia-Pacific captured 40.37% market share in 2025, and is set to advance at a 4.78% CAGR through 2031.
Note: Market size and forecast figures in this report are generated using Mordor Intelligence’s proprietary estimation framework, updated with the latest available data and insights as of January 2026.
Global Automatic Labeling Machine Market Trends and Insights
Drivers Impact Analysis*
| Driver | (~) % Impact on CAGR Forecast | Geographic Relevance | Impact Timeline |
|---|---|---|---|
| Rising Demand for Smart Packaging Traceability | +0.9% | Global, early adoption in North America and Europe | Medium term (2-4 years) |
| Surge in Craft Beverage Short-Run SKUs | +0.7% | North America and Europe core, expanding to Asia-Pacific | Short term (≤ 2 years) |
| Growth of E-Commerce Fulfillment Centers | +0.6% | Global, concentrated in Asia-Pacific and North America | Short term (≤ 2 years) |
| Stricter Serialization and UDI Rules in Pharma and Med-Device | +0.8% | North America, Europe, and Asia-Pacific | Medium term (2-4 years) |
| Digital Print-On-Demand Integration | +0.5% | Global, led by North America and Europe | Long term (≥ 4 years) |
| Sustainability-Driven Shift to Linerless Labels | +0.4% | Europe and Asia-Pacific, emerging in North America | Long term (≥ 4 years) |
| Source: Mordor Intelligence | |||


Stricter Serialization and UDI Rules in Pharma and Med-Device
Pharmaceutical and medical-device producers must imprint unique identifiers on every saleable unit, case, and pallet to comply with the U.S. DSCSA, Europe’s Falsified Medicines Directive, and China’s 2024 Drug Administration Law. Companies that once relied on standalone mechanical labelers are retrofitting lines with 2D DataMatrix printers, vision verification, and database connectivity that synchronize serial numbers in real time.[1]U.S. Food and Drug Administration, “Drug Supply Chain Security Act (DSCSA),” FDA.gov Contract manufacturers are fast-tracking these upgrades to retain export certifications, diverting procurement budgets toward integrated print-and-apply modules rather than general packaging assets.[2]European Medicines Agency, “Falsified Medicines Directive,” EMA.europa.eu The shift rewards suppliers certified under ISO 9001 and FDA 21 CFR Part 11 because they can furnish validation protocols required during regulatory audits.
Surge in Craft Beverage Short-Run SKUs
Craft brewers and artisanal distilleries now average 75 distinct SKUs per plant, compared with 20 just five years ago, a proliferation that makes pre-printed label inventories uneconomical.[3]Rockwell Automation, “Craft Beverage Manufacturing Solutions,” rockwellautomation.com Modular automatic labeling machine platforms that combine inkjet or thermal transfer printing with pressure-sensitive application enable producers to switch graphics in minutes, squeezing obsolescence out of seasonal or collaboration runs. Solutions such as the SwiftColor SCC-4000D deliver full-color, variable-data labels at up to 60 ft/min, letting limited-edition beverages reach shelves within days of concept approval. This trend is spilling into specialty foods and direct-to-consumer cosmetics, broadening the revenue base for mid-speed, quick-change applicators.
Growth of E-Commerce Fulfillment Centers
Same-day and next-day delivery commitments push logistics providers to automate parcel labeling inside distribution hubs. AI-enabled vision systems read damaged barcodes, trigger corrective print-and-apply sequences, and track items at more than 120 packages per minute, shrinking mis-ship rates and labor costs. Global 3PLs such as Kuehne+Nagel installed automatic labeling machine market solutions at 15 multi-story centers during 2025, integrating them with sorters and robotic palletizers for uninterrupted 24/7 operations. Fulfillment-driven demand is carving out a high-growth niche for compact applicators that tolerate dust, temperature swings, and mezzanine floor loads.
Sustainability-Driven Shift to Linerless Labels
Regulators and brand owners aim to eliminate release-liner waste that represents roughly 40% of traditional label mass. Extended producer-responsibility rules issued by Japan’s Ministry of the Environment penalize packaging waste, prompting retailers to stipulate linerless labeling on private brands. Avery Dennison’s AD Stretch portfolio and ILTI’s Eco-Flex applicator cut material usage and double roll length, halving changeover frequency on beverage and logistics lines. Although adhesive residue and retrofit costs still restrain adoption, cold-chain food and refrigerated pharma packaging demonstrate compelling payback, anchoring long-term momentum.
Restraints Impact Analysis*
| Restraint | (~) % Impact on CAGR Forecast | Geographic Relevance | Impact Timeline |
|---|---|---|---|
| High CAPEX Versus Rental or Contract Packaging Options | -0.6% | Global, pronounced in North America and Europe | Short term (≤ 2 years) |
| Skill Shortage in Controls and Maintenance | -0.3% | Global, acute in North America and Europe | Medium term (2-4 years) |
| Volatile Raw-Material (Label Stock) Prices | -0.5% | Global, with stress in Europe and Asia-Pacific | Short term (≤ 2 years) |
| Interoperability Gaps Across Multi-Vendor Lines | -0.2% | Global, affecting pharma and food plants | Medium term (2-4 years) |
| Source: Mordor Intelligence | |||
High CAPEX Versus Rental or Contract Packaging Options
Cash-constrained food and personal-care brands increasingly rent equipment or outsource production, delaying outright purchases. ProMach noted a 35% jump in rental inquiries during 2024 as marketers funneled capital toward digital campaigns instead of machinery. Subscription models such as Domino’s Labeling-as-a-Service bundle hardware, consumables, and remote monitoring into monthly fees, shifting risk from brand owners to suppliers. While these offerings expand access, they compress up-front revenues, tempering automatic labeling machine market growth in the near term.
Volatile Raw-Material (Label Stock) Prices
A 12% spike in European acrylic-resin costs during 2024 drove several converters to impose surcharges on pressure-sensitive rolls. Packagers working under fixed-price contracts postponed line upgrades and pivoted toward direct-thermal or linerless alternatives that reduce adhesive consumption. Dependence on Chinese silicone capacity heightens exposure to export curbs, turning raw-material volatility into a strategic restraint until supply diversity improves.
*Our forecasts treat driver/restraint impacts as directional, not additive. The impact forecasts reflect baseline growth, mix effects, and variable interactions.
Segment Analysis
By Technology: Sleeve Labelers Accelerate Beverage Differentiation
Sleeve applicators expanded at a 4.24% CAGR between 2025 and 2031, the briskest pace among technologies in the automatic labeling machine market. Pressure-sensitive units still delivered 39.83% automatic labeling machine market share in 2025, favored for compliance text, variable data, and easy changeovers. Full-body shrink sleeves attract energy drink and ready-to-drink cocktail brands that seek tamper evidence and 360-degree graphics without bottle embossing. Stretch sleeves, promoted for mono-material recyclability, appeal to juice and dairy processors complying with European producer-responsibility rules. Although cold-glue stations dominate legacy beer lines for their low per-label cost, their rigid format lengthens downtime during SKU switches, nudging brewers toward modular sleeves or pressure-sensitive heads. Innovations such as servo-controlled seam overlap trimming reduce film waste by 15%, aligning cost and sustainability goals.
Print-on-demand integration is redefining technological boundaries. Domino’s N610i inkjet head bolts onto existing pressure-sensitive applicators and supports 300 m/min variable-data streams, erasing the historical divide between printing and labeling. Suppliers embedding RFID inlays within pressure-sensitive webs let logistics users track parcels without manual scans, widening application breadth. Sustainability, decoration, and compliance thus coalesce to propel technology diversification within the automatic labeling machine market.


By Machine Configuration: Modular Platforms Capture Flexibility Premium
Modular and hybrid systems are projected to grow 4.52% from 2026-2031, outpacing in-line workhorses that owned 62.42% of market share in 2025. These frames accept pressure-sensitive, glue, or sleeve heads on a common chassis, allowing co-packers to amortize investment across multiple brands and products. KHS Innoket Neo Flex cuts footprint by 30% and delivers tool-free changeovers, translating into higher overall equipment effectiveness for midsized dairies and breweries. Rotary-servo machines exceeding 600 BPM remain indispensable in mega-plants but risk under-utilization as portfolio fragmentation shortens run lengths. Print-and-apply boxes proliferate in e-commerce distribution centers where variable-dimension parcels demand dynamic label sizing and shipping data.
The automatic labeling machine market size tied to modular systems is expanding as subscription pricing removes up-front barriers. Vendors guarantee uptime via IoT diagnostics, secure a consumable revenue stream, and sidestep procurement freezes that stalled capital expenditure during pandemic years. As a result, configuration choice is now a strategic lever that can future-proof packaging lines against SKU volatility.
By Labeling Speed: Mid-Range Tier Balances Cost And Uptime
Lines rated 61-200 BPM delivered 45.68% of market share in 2025, reflecting their sweet spot between affordability and flexibility. This mid-range automatic labeling machine market size aligns with craft-beverage, regional-dairy, and specialty-food throughput expectations. Servo-driven upgrades like Kosme Flectra elevate accuracy while retaining tool-less changeovers, putting premium capabilities within smaller budgets. The 201-400 BPM band is on track for a 4.67% CAGR as pharmaceutical contract packers retrofit serialization cameras without stepping into ultra-high-speed complexity. Systems below 60 BPM serve pilot labs and micro-distilleries where manual intervention remains acceptable, whereas lines above 400 BPM increasingly sit idle between frequent flavor or size changes, diluting their historical cost advantage.
Energy efficiency further strengthens the appeal of the 61-200 BPM class because new servo architectures cut power draw by about 15% relative to pneumatic predecessors, lowering monthly utility costs and easing sustainability reporting. Vendors now embed cloud analytics that flag bearing wear or label-feed tension drift early, keeping overall equipment effectiveness above 90% and shrinking maintenance overtime. Compact footprints allow regional breweries to slot machines between fermenters without rerouting conveyors, a layout gain that becomes decisive as SKU counts climb and space tightens. Subscription and rental contracts translate this value into predictable operating expenses, letting start-ups tap premium performance without breaching capital-expenditure thresholds. Print-on-demand modules are also migrating into this speed band, enabling nutraceutical or cosmetics brands to merge variable-data printing with application in one pass, which broadens the automatic labeling machine market size accessible to mid-range platforms.
By End User: Pharma Surges Past Beverage Growth
Beverages retained the largest 27.71% share in 2025, anchored by soft drinks and beer, yet pharmaceuticals are set to post the highest 5.28% CAGR through 2031 as compliance deadlines multiply. Hospital pharmacies and clinical-trial units require real-time database lookups and vision inspection at line speed, favoring turnkey solutions over mechanical applicators. Personal-care labels demand opaque films, metallic foils, and NFC chips for brand authentication, sustaining demand for high-tension pressure-sensitive heads. Food processors are switching to linerless rolls that cut landfill fees, while logistics operators expand print-and-apply installations to satisfy omnichannel delivery promises.
Pharmaceutical investment is also spilling over into veterinary vaccines and over-the-counter nutraceuticals, two categories now subject to serialization in several Asian and European markets, which widens the automatic labeling machine market addressable to life-science players. Beverage producers, meanwhile, channel budgets toward sleeve applicators that support low-sugar functional drinks and hard seltzers, lifting the share of equipment capable of running shrink film alongside glue labels in quick succession. Personal-care brands intensify demand for smart labels embedded with QR codes that unlock digital loyalty programs, nudging suppliers to integrate variable-data inkjet modules directly at the applicator head. Food manufacturers accelerate adoption of direct-thermal wrap labels for meal kits and fresh produce, balancing cost control with traceability mandates tied to allergen disclosures. E-commerce fulfillment centers round out growth by specifying print-and-apply stations that sync with order-management systems, ensuring same-day shipping accuracy even during seasonal volume spikes.
Geography Analysis
Asia-Pacific contributed 40.37% of automatic labeling machine market share in 2025 and is forecast to advance at 4.78% CAGR. China’s amended Drug Administration Law extends serialization to traditional Chinese medicine, compelling thousands of regional packagers to add vision and reject modules. India’s contract manufacturers invest in high-speed lines to meet FDA-aligned export specs, reinforcing the region’s volume dominance. Japan’s extended producer-responsibility rules accelerate linerless adoption, while South Korea’s battery supply chain demands traceability for EU compliance.
North America capitalizes on e-commerce logistics, with U.S. fulfillment centers embedding AI vision and print-and-apply cells that uplift automatic labeling machine market revenue despite beverage producers stretching replacement cycles. Pharmaceutical lines meeting the final 2026 DSCSA milestone continue to drive U.S. upgrades, especially among contract development and manufacturing organizations that require redundant, validated equipment.Europe balances sustainability and regulation. Germany, France, and Italy adopt mono-material films and modular heads to meet the 2030 Packaging and Packaging Waste Regulation recycle mandate. Beverage firms transition from multi-material sleeves to recyclable shrink films, sustaining mid-speed system sales. Contract packers in Spain and Poland lease in-line units to service multinational brand owners, reinforcing modest but steady growth.
South America leverages Brazil’s beverage sector and Argentina’s pharma exports to support incremental installations, though currency volatility encourages rental or used-equipment channels. Middle East and Africa concentrate on Saudi localization of generics and South African food exports, where mid-range machines with vision inspection satisfy both halal labeling and EU traceability requirements. Government incentives in Colombia and Chile now provide tax abatements for plants that adopt energy-efficient labeling lines, nudging hesitant packagers to revive automation plans. Across these regions, suppliers that bundle remote monitoring with subscription pricing gain traction because the approach shields converters from foreign-exchange swings and unexpected maintenance expenses.

Competitive Landscape
The Market is fragmented, with players such as Krones, Sidel, KHS, and others offering high-speed beverage projects and bundling filling, labeling, and packaging lines to secure turnkey contracts. Their latest platforms embed IoT sensors that feed predictive-maintenance dashboards, locking customers into software subscriptions. Avery Dennison, HERMA, and Domino compete on consumable ecosystems and variable-data expertise, positioning themselves as end-to-end traceability partners.
ProMach enlarged its automatic labeling machine market footprint through the 2024 Weiler acquisition, adding rotary and in-line heads that enable rental programs for North American co-packers. Henkel’s 2024 purchase of Ravenwood underscores rising linerless potential, while ILTI focuses on cold-chain adaptations. Smaller innovators address craft beverage and direct-to-consumer needs with compact chassis that integrate digital presses and require minimal utilities, eroding entry barriers for new brands.
Technology adoption remains the decisive lever. Suppliers offering OPC-UA native communication ease MES integration, winning bids from pharma clients that cannot tolerate data silos. Patent filings around RFID inlay insertion and antenna tuning suggest that smart labels will be a next-wave differentiator, with Avery Dennison and SATO holding early-stage advantages. Price pressure persists at the mechanical end, where Asian manufacturers supply simple wrap-around machines at aggressive margins.
Automatic Labeling Machine Industry Leaders
Krones AG
Nita Labeling Systems
Bobst Group SA
KHS GmbH
Accutek Packaging Company, Inc.
- *Disclaimer: Major Players sorted in no particular order

Recent Industry Developments
- December 2025: Avery Dennison unveiled Gen 2 RFID inlays optimized for high-speed e-commerce lines, extending read range without slowing parcel throughput.
- November 2025: ILTI rolled out the Eco-Flex linerless applicator featuring a direct-thermal head and chill roller to prevent adhesive bleed on frozen foods.
- October 2025: KHS expanded its Innoket Neo Flex assembly line in Germany to meet surging modular system demand from Asian and European dairies.
- August 2025: ACMI launched the Opera Omnia platform that hosts pressure-sensitive, hot-melt, and cold-glue modules on one chassis, trimming floor space by 35%.


Global Automatic Labeling Machine Market Report Scope
Automatic labeling machines are specialized equipment designed to apply labels to products or packaging with minimal human intervention. They streamline the labeling process, increasing efficiency and accuracy in various industries, such as manufacturing, food and beverage, pharmaceuticals, and logistics. These machines can handle multiple label types, including pressure-sensitive, shrink sleeves, and wrap-around labels. They can apply labels to various product shapes and sizes, from small vials to large containers. Automatic labeling machines often incorporate advanced features such as barcode printing, vision systems for quality control, and integration with production line management systems.
The Automatic Labeling Machine Market Report is Segmented by Technology (Pressure-Sensitive, Shrink-Sleeve, Glue-Based, Sleeve, In-Mold, and Other Technologies), Machine Configuration (In-Line, Rotary, Print-and-Apply, and Modular / Hybrid), Labelling Speed (Less Than 60 BPM, 61-200 BPM, 201-400 BPM, and More Than 400 BPM), End User (Food, Beverages, Pharmaceuticals, Personal Care and Cosmetics, Chemicals and Industrial, Logistics and E-Commerce, and Other End Users), and Geography (North America, South America, Europe, Asia-Pacific, and Middle East and Africa). The Market Forecasts are Provided in Terms of Value (USD).
| Pressure-Sensitive / Self-Adhesive Labelers |
| Shrink-Sleeve Labelers |
| Glue-Based (Cold Glue, Hot-Melt) Labelers |
| Sleeve (Stretch, Heat) Labelers |
| In-Mold Labelers |
| Other Technologies |
| In-Line Labeling Machines |
| Rotary / Rotary-Servo Labelers |
| Print-and-Apply Systems |
| Modular / Hybrid Systems |
| Less Than 60 BPM |
| 61-200 BPM |
| 201-400 BPM |
| More Than 400 BPM |
| Food |
| Beverages |
| Pharmaceuticals |
| Personal Care and Cosmetics |
| Chemicals and Industrial |
| Logistics and E-Commerce |
| Other End Users |
| North America | United States | |
| Canada | ||
| Mexico | ||
| South America | Brazil | |
| Argentina | ||
| Rest of South America | ||
| Europe | Germany | |
| United Kingdom | ||
| France | ||
| Spain | ||
| Italy | ||
| Rest of Europe | ||
| Asia-Pacific | China | |
| Japan | ||
| India | ||
| Australia | ||
| South Korea | ||
| Rest of Asia-Pacific | ||
| Middle East and Africa | Middle East | Saudi Arabia |
| United Arab Emirates | ||
| Turkey | ||
| Rest of Middle East | ||
| Africa | South Africa | |
| Kenya | ||
| Rest of Africa | ||
| By Technology | Pressure-Sensitive / Self-Adhesive Labelers | ||
| Shrink-Sleeve Labelers | |||
| Glue-Based (Cold Glue, Hot-Melt) Labelers | |||
| Sleeve (Stretch, Heat) Labelers | |||
| In-Mold Labelers | |||
| Other Technologies | |||
| By Machine Configuration | In-Line Labeling Machines | ||
| Rotary / Rotary-Servo Labelers | |||
| Print-and-Apply Systems | |||
| Modular / Hybrid Systems | |||
| By Labelling Speed | Less Than 60 BPM | ||
| 61-200 BPM | |||
| 201-400 BPM | |||
| More Than 400 BPM | |||
| By End User | Food | ||
| Beverages | |||
| Pharmaceuticals | |||
| Personal Care and Cosmetics | |||
| Chemicals and Industrial | |||
| Logistics and E-Commerce | |||
| Other End Users | |||
| By Geography | North America | United States | |
| Canada | |||
| Mexico | |||
| South America | Brazil | ||
| Argentina | |||
| Rest of South America | |||
| Europe | Germany | ||
| United Kingdom | |||
| France | |||
| Spain | |||
| Italy | |||
| Rest of Europe | |||
| Asia-Pacific | China | ||
| Japan | |||
| India | |||
| Australia | |||
| South Korea | |||
| Rest of Asia-Pacific | |||
| Middle East and Africa | Middle East | Saudi Arabia | |
| United Arab Emirates | |||
| Turkey | |||
| Rest of Middle East | |||
| Africa | South Africa | ||
| Kenya | |||
| Rest of Africa | |||


Key Questions Answered in the Report
What is the current size of the automatic labeling machine market?
The automatic labeling machine market size reached USD 3.15 billion in 2025 and is projected at USD 3.24 billion for 2026, en route to USD 3.84 billion by 2031.
Which segment is growing fastest within the market?
Sleeve labeling technology is forecast to grow at 4.24% CAGR through 2031, outpacing other technologies.
Why are pharmaceuticals investing heavily in labeling equipment?
Serialization and UDI mandates in the United States, Europe, and Asia require unit-level traceability, driving pharmaceutical demand at a 5.28% CAGR.
How are sustainability goals influencing equipment purchases?
Brand owners adopt linerless and mono-material labels to cut waste, prompting investment in applicators compatible with these formats.
Which region leads global demand for labeling machinery?
Asia-Pacific holds the largest share at 40.37% in 2025 and is set to expand further on the back of Chinese and Indian pharmaceutical growth.
How are vendors responding to high CAPEX barriers?
Suppliers now offer rental, subscription, and Labeling-as-a-Service models that bundle hardware, software, and consumables into monthly fees.
Page last updated on:


