Smart Ticketing Market Size and Share
Market Overview
| Study Period | 2020 - 2031 |
|---|---|
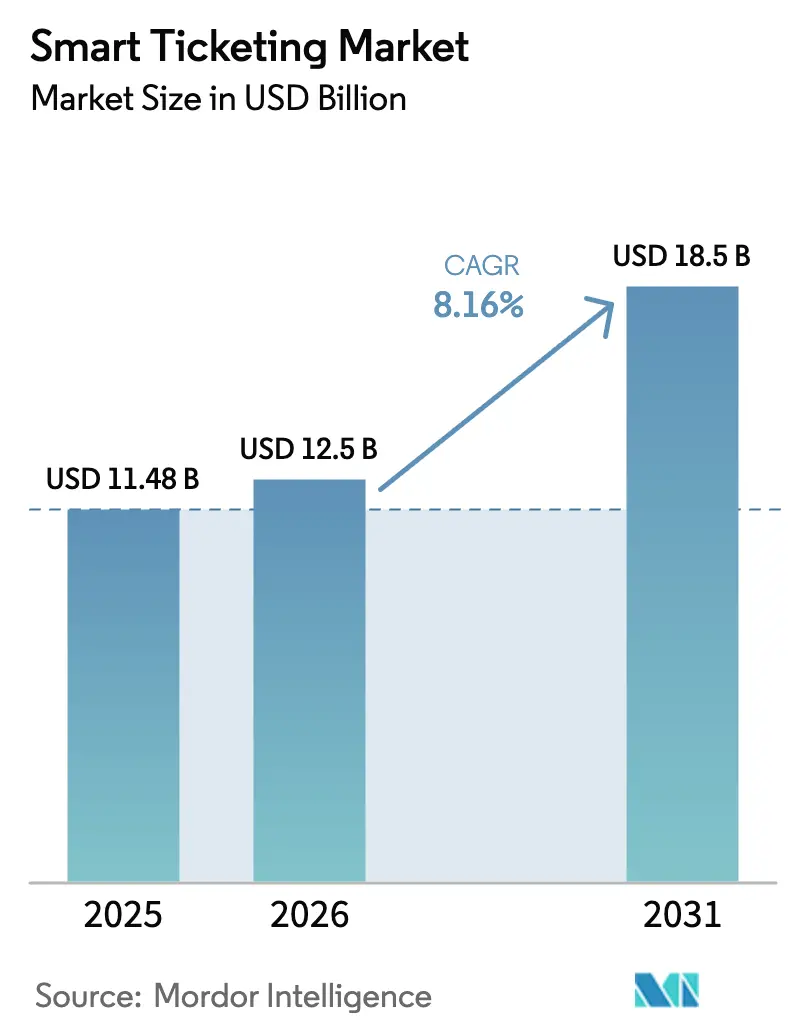
| Market Size (2026) | USD 12.5 Billion |
| Market Size (2031) | USD 18.5 Billion |
| Growth Rate (2026 - 2031) | 8.16% CAGR |
| Fastest Growing Market | Asia-Pacific |
| Largest Market | Europe |
| Market Concentration | Medium |
Major Players *Disclaimer: Major Players sorted in no particular order Image © Mordor Intelligence. Reuse requires attribution under CC BY 4.0. | |
Smart Ticketing Market Analysis by Mordor Intelligence
The smart ticketing market size was valued at USD 11.48 billion in 2025 and estimated to grow from USD 12.5 billion in 2026 to reach USD 18.5 billion by 2031, at a CAGR of 8.16% during the forecast period (2026-2031). A rapid move toward contactless EMV open-loop payments, the embedding of tokenized fares into super-apps, and the shift to cloud-native Ticketing-as-a-Service platforms are recasting how agencies monetize every trip. Hardware still dominates revenue because city networks continue to install automatic fare-collection gates and validators, yet software is climbing faster as operators embrace subscription pricing that slices upfront cost. Europe remains the largest regional buyer today, but Asia-Pacific is on a steeper trajectory thanks to national digital-identity programs that make cross-operator account-based travel easy. Competitive pressure is intensifying as global payment networks bypass proprietary media, forcing long-time hardware leaders to pivot toward modular, API-first solutions that cut agencies’ total cost of ownership.
Key Report Takeaways
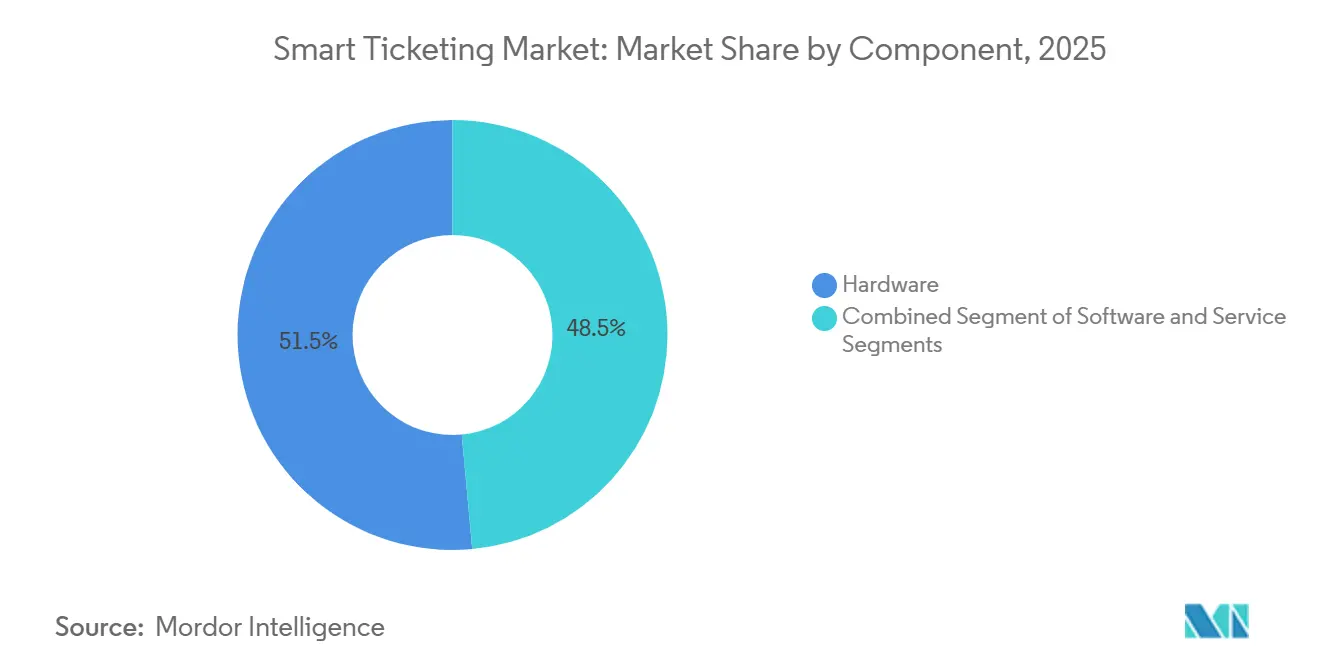
- By component, hardware led with 51.47% of smart ticketing market share in 2025, while software is forecast to advance at an 8.91% CAGR through 2031.
- By fare media, smart cards accounted for 47.81% revenue in 2025; mobile and QR tickets are projected to expand at an 8.71% CAGR to 2031.
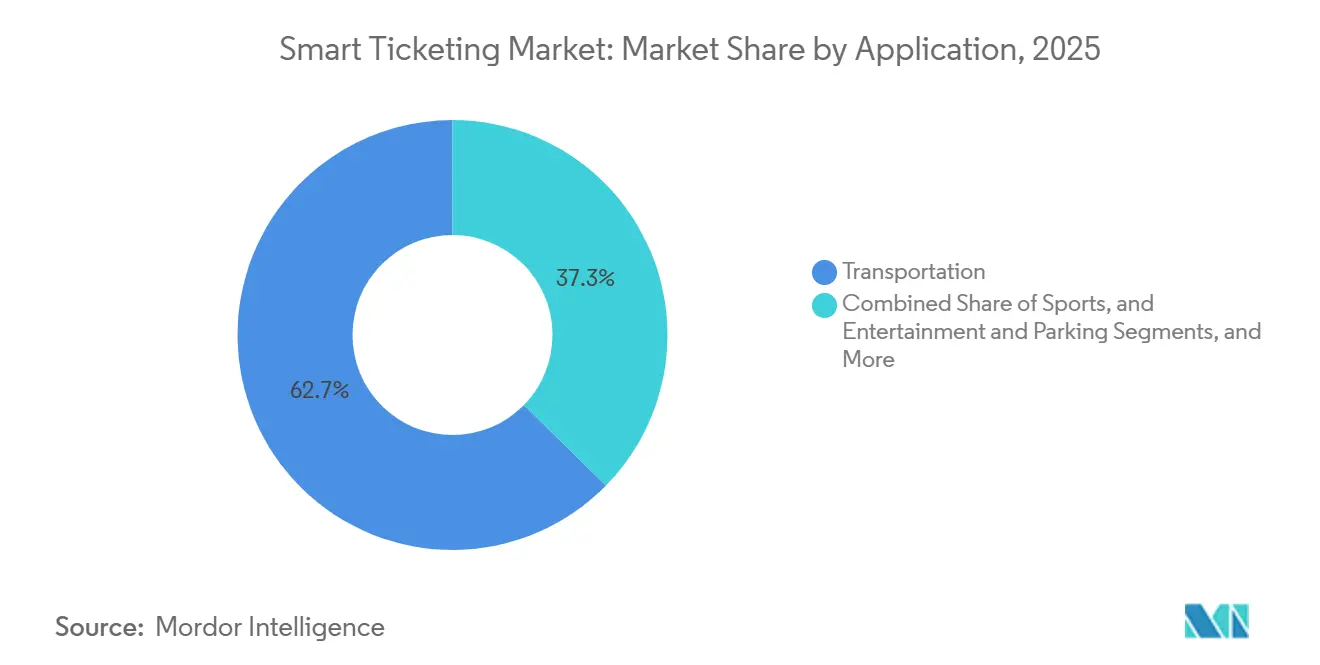
- By application, transportation captured 62.66% of spending in 2025, whereas parking is set to deliver the strongest growth at an 8.89% CAGR.
- By end user, public transport authorities held 54.39% revenue in 2025, yet mobility-as-a-service providers are on course for a 9.05% CAGR to 2031.
- By technology, closed-loop smart card systems represented 49.64% revenue in 2025, with open-loop EMV poised to rise at a 9.11% CAGR through 2031.
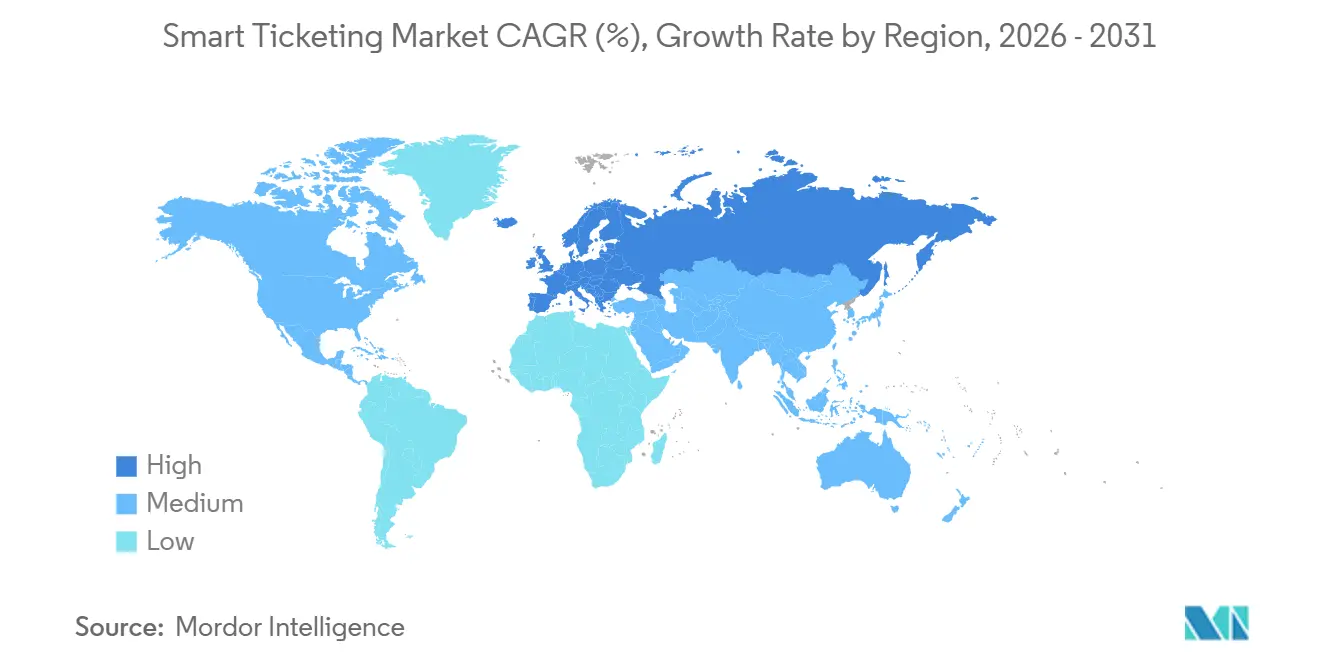
- By geography, Europe commanded 34.53% smart ticketing market share in 2025, but Asia-Pacific is primed for the fastest 8.96% CAGR between 2026 and 2031.
Note: Market size and forecast figures in this report are generated using Mordor Intelligence’s proprietary estimation framework, updated with the latest available data and insights as of January 2026.
Global Smart Ticketing Market Trends and Insights
Drivers Impact Analysis*
| Driver | (~) % Impact on CAGR Forecast | Geographic Relevance | Impact Timeline |
|---|---|---|---|
| Rapid Adoption of Contactless EMV Open-Loop Payments | +2.10% | Global, with early concentration in London, New York, Singapore, Madrid | Short term (≤ 2 years) |
| Government Smart-City and ITS Funding Programmes | +1.80% | North America, Europe, Asia-Pacific (India Smart Cities Mission, EU Urban Mobility Framework, US IIJA) | Medium term (2-4 years) |
| Expansion of Mobility-as-a-Service Platforms | +1.40% | Europe core, spill-over to North America and Asia-Pacific urban clusters | Medium term (2-4 years) |
| Tokenization APIs Enabling Super-App Ticketing Integration | +1.30% | Asia-Pacific (China, Hong Kong, Southeast Asia), secondary adoption in Europe and North America | Short term (≤ 2 years) |
| Cloud-Native Ticketing-as-a-Service Lowers TCO | +1.00% | Global, with faster uptake among mid-tier agencies lacking legacy infrastructure | Medium term (2-4 years) |
| ESG-Linked Municipal Bonds Accelerate Ticketing Capex | +0.70% | Europe, North America, Singapore | Long term (≥ 4 years) |
| Source: Mordor Intelligence | |||
Rapid Adoption of Contactless EMV Open-Loop Payments
Transit agencies are replacing proprietary cards with bank-card acceptance to eliminate issuance, distribution, and reconciliation overhead. New York finished the OMNY rollout in January 2026, shutting every MetroCard machine and automatically capping fares without advance purchase, a change that boosted rider convenience and reduced cash handling.[1]Metropolitan Transportation Authority, “OMNY,” new.mta.info London processes about 30 million contactless journeys per day and continues to widen tap-to-pay coverage.[2]Transport for London, “Contactless Payment,” tfl.gov.uk A Visa survey shows 83% of remaining non-adopters expect to go open-loop within two years, underscoring the momentum.[3]Visa, “Contactless Transit Study,” visa.com Agencies in Philadelphia and Dubai have committed more than USD 360 million combined to retrofit validators, proving that capital is flowing toward EMV enablement.
Government Smart-City and Intelligent Transport Funding Programs
Federal, state, and municipal grants are underwriting large-scale fare-system upgrades. The United States Federal Transit Administration allocated USD 3.8 billion in Capital Investment Grants for fiscal 2026, and its SMART initiative delivers another USD 100 million each year for technology pilots. Singapore’s Land Transport Authority has raised SGD 9.2 billion (USD 6.8 billion) since 2022 through green bonds that fund rail expansion and nationwide EMV acceptance.[4]Land Transport Authority, “Green Bonds,” lta.gov.sg India’s Smart Cities Mission channels national and state resources to automatic fare collection in Ahmedabad, Surat, and other tier-two cities, often with NEC as system integrator. These programs reduce the hurdle rates for agencies, making it viable to adopt cloud-hosted account-based systems that otherwise would have strained operating budgets.
Expansion of Mobility-as-a-Service Platforms
Mobility-as-a-service aggregators merge trip planning, booking, and payment inside single smartphone screens, shifting revenue from station kiosks to cloud back-offices. Moovit has layered more than 40 European intercity bus brands, Brazilian long-distance routes, and North American paratransit onto its interface, giving users one funnel to book end-to-end journeys. Masabi’s Justride platform, offered as software-as-a-service, powers over 200 agencies, letting them issue QR codes, mobile tickets, or EMV taps without self-hosting fare servers. JR East’s Suica Renaissance will move its iconic card to a cloud account model, adding code payments and subscription fares beginning autumn 2026. These examples show how platform economics favour vendors that provide open APIs and standardized data formats, eroding the advantage of hardware-centric incumbents.
Tokenization APIs Enabling Super-App Integration
Tokenization allows wallets such as AlipayHK or MPay to embed virtual transit cards, sparing riders a new app download. Ant Group’s Alipay+ spans more than 100 countries with 1.8 billion users and posted a 50% jump in transport transactions during the first half of 2025. Guangzhou Metro added both wallets in April 2025, enabling over 10 million cross-border journeys for Hong Kong commuters. Hong Kong’s Public Transport Fare Subsidy Scheme now reimburses trips bought through AlipayHK, illustrating public-sector support. OfflinePay SDK issues secure codes even without cellular coverage, critical for underground segments where real-time network signals are weak. Tokenization slashes acquisition cost for agencies because super-apps already hold massive active-user bases.
Restraints Impact Analysis*
| Restraint | (~) % Impact on CAGR Forecast | Geographic Relevance | Impact Timeline |
|---|---|---|---|
| High Upfront AFC Infrastructure Costs | -1.20% | Global, acute in emerging markets with limited capital budgets | Medium term (2-4 years) |
| Cybersecurity and Data-Privacy Concerns | -0.90% | Global, heightened in Europe (GDPR) and North America (PCI-DSS) | Short term (≤ 2 years) |
| PSD2 and PCI-DSS SCA Compliance Cost Burden | -0.60% | Europe and North America | Short term (≤ 2 years) |
| Fragmented Digital-Identity Frameworks Impede Interoperability | -0.50% | Global, most pronounced in cross-border corridors (EU, ASEAN) | Long term (≥ 4 years) |
| Source: Mordor Intelligence | |||
High Upfront AFC Infrastructure Costs
Transforming magnetic-stripe or first-generation smart-card estates into open-loop systems demands large capital outlays. SEPTA committed USD 211 million for Cubic’s platform, while Dubai earmarked AED 550 million (USD 149.7 million) for its nol upgrade scheduled to complete in Q3 2026. New York City’s capital plan sets aside more than USD 3 billion for traffic systems, ferries, and IT over the next decade, demonstrating the scale required for dense networks. Smaller agencies without bond access must choose piecemeal retrofits that preserve legacy compatibility, creating a tiered adoption curve between high-income and developing regions.
Cybersecurity and Data-Privacy Concerns
Open-loop architectures expose transport operators to retail-style cyber threats. PCI-DSS regulations obligate end-to-end encryption, segmented networks, and annual penetration tests, all of which carry ongoing labour and audit costs. Europe’s PSD2 strong customer authentication rules raise friction unless low-value transit exemptions are coded correctly. Biometric gates must satisfy GDPR principles of explicit consent and data minimization, otherwise agencies risk multimillion-euro fines. MTA assembled a blue-ribbon panel in 2023 to double-check OMNY’s over-air updates and AI-based evasion detection, highlighting the governance burden. These compliance hurdles can slow project timelines, especially for operators lacking dedicated information-security teams.
*Our forecasts treat driver/restraint impacts as directional, not additive. The impact forecasts reflect baseline growth, mix effects, and variable interactions.
Segment Analysis
By Component: Hardware Remains Anchor While Software Scales
Hardware represented 51.47% of 2025 revenue, reflecting the high price of gates, validators, and kiosks that underpin the smart ticketing market size at the station level. Software grew more quickly, posting an 8.91% CAGR outlook as agencies adopt subscription models that convert capital expense into predictable operating outflows. Cubic’s modular FEnX gate lets operators swap card readers or biometrics instead of replacing whole cabinets, extending asset life. Masabi and Bytemark show how cloud delivery unhooks agencies from on-premises servers, broadening addressable demand.
Growth prospects favour vendors that blend hardware with continuous software updates. As payment networks certify more consumer devices for transit open-loop, proprietary readers risk commoditization, pressing hardware makers to package analytics, fraud detection, and fare capping tools. Services around PCI compliance and integration further enlarge revenue, signalling that while fixed equipment keeps the largest absolute pool, incremental gains will shift toward recurring software and managed-service lines.


By Fare Media: Smart Cards Still Dominant, Digital Tickets Climb
Smart cards held 47.81% revenue in 2025 thanks to entrenched programs such as Oyster, Octopus, and Suica that bind local ridership. Mobile and QR tickets, however, are forecast to rise 8.71% annually, underpinned by smartphone penetration above 80% in major metros. TfL Go logs more than 1.2 million users each month, highlighting digital uptake. Edinburgh’s Tap-On Tap-Off recorded one million taps inside six months after launching Apple Pay Express Mode.
Open-loop bank cards erode the need for agency-branded media and may soon exceed wearables and barcode formats on suburban routes. Still, smart ticketing market share for legacy cards will unwind slowly, since public authorities must serve cash-dependent or unbanked groups who rely on reloadable plastic. Consequently, mixed-media acceptance will remain standard through 2031, requiring fare engines to map multiple tokens to a single back-office account.
By Technology: EMV Open-Loop Advances on Closed-Loop Stronghold
Closed-loop smart card standards held 49.64% revenue in 2025, yet open-loop EMV is moving faster at a projected 9.11% CAGR, reflecting agencies’ wish to scrap card issuance costs. MTA finished removing MetroCard machines in 2026 and now accepts any contactless bank card or wallet tap. A Visa study notes 80% of agencies that already deployed open loop saw ridership improve, reinforcing the financial logic.
Account-based engines enable capping and cross-operator settlement that static stored-value cards cannot match. Biometric pilot programs in Moscow, Vietnam, and Osaka show promising sub-second entry times, though privacy and cost keep rollouts cautious. Blockchain clearing remains experimental, but projects such as Indicio’s Proven AI indicate where decentralized identity could fit border-crossing travel.
By Application: Transportation Commands, Parking Accelerates
Transportation captured 62.66% of 2025 spend, with railways absorbing the bulk because metros need high-throughput gates. Parking, projected to post an 8.89% CAGR, benefits from cities linking curb management and transit payment to optimize traffic flow. Flowbird supports more than 5,000 cities and EasyPark now spans 3,200, proving commercial appetite for integrated kerb-side transactions.
Sports and entertainment remain smaller but strategic. Stadium operators such as SoFi and Tottenham leverage NFC ticketing to accelerate entry and capture concession revenue. As operators converge parking, event, and transit tokens under single wallets, vendors able to deliver multi-vertical solutions will win cross-selling upside within the smart ticketing market.
By End User: Public Authorities Lead, MaaS Providers Sprint
Public transport authorities generated 54.39% revenue in 2025, reflecting their control of heavy-rail and bus budgets. Mobility-as-a-service platforms, however, carry the quickest 9.05% CAGR as they bundle trip discovery, booking, and payment across operators. Littlepay supplies EMV acceptance to regional bus fleets, showing how nimble fintech meet small operator needs.
Private operators and event organizers trail but innovate faster on pricing, loyalty, and biometrics because they face fewer equity constraints. The smart ticketing market size for private shuttles and intercity buses is widening as aggregators such as Distribusion and Travelier plug them into global trip planners. As riders grow comfortable with account-based wallets, public agencies may adopt similar elastic pricing tools, blurring lines between segments.
Geography Analysis
Europe contributed 34.53% of global revenue in 2025, supported by mature infrastructures in London, Paris, and Madrid and reinforced by forthcoming Single Digital Booking and Ticketing Regulation that compels open APIs. Deutsche Bahn’s Deutschland-Ticket hit 13 million subscribers, and Ireland’s Next Generation Ticketing project, valued at EUR 211.2 million (USD 238 million), will bring open payments to Dublin in 2027. The United Kingdom awarded Vix Technology a GBP 885,795 (USD 1.1 million) contract to extend ITSO on Mobile, underscoring demand for backwards-compatible upgrades.
Asia-Pacific is projected to deliver the fastest 8.96% CAGR, lifting its smart ticketing market size sharply by 2031. Singapore has already enabled nationwide EMV across MRT, LRT, and buses and finances expansion via SGD 9.2 billion (USD 6.8 billion) in green bonds. China’s Alipay+ growth and Guangzhou Metro’s 10-million cross-border taps show how super-apps shorten adoption curves. India’s Smart Cities Mission seeds deployments in tier-two metros, with NEC as lead integrator. Japan’s JR East timetable moves Suica fully to the cloud by 2027, adding barcode acceptance and subscription fares.
North America benefits from federal funding streams. Beyond MTA’s completed OMNY rollout, Los Angeles secured USD 12.12 million in SMART grants for QR infrastructure before the 2028 Olympics. Latin America remains smaller but growing: Moovit’s partnership with Travelier unlocks Brazilian intercity buses, and São Paulo’s BOM serves 4.6 million daily riders. The Middle East invests to serve tourism; Dubai’s AED 550 million upgrade finishes in 2026, and studies show 43% of regional agencies plan contactless within five years. Africa is in early trials: Cape Town began account-based pilots in July 2026 to cover 1.1 million residents.

Competitive Landscape
The smart ticketing industry reflects moderate concentration. Cubic, Thales, Conduent, and Scheidt and Bachmann anchor the hardware-plus-integration tier, leveraging installed bases, long contracts, and proprietary interfaces. Payment networks Visa and Mastercard bypass traditional media by treating agencies as merchants, letting any EMV card tap trains or buses, a direct challenge to closed-loop revenue. Software-as-a-service players such as Masabi and Bytemark deliver modular stacks that bolt onto existing gates, shifting margins to recurring fees.
Niche challengers target focused gaps. Littlepay offers lightweight EMV acceptance for bus operators in the United Kingdom, Australia, and North America, avoiding complex back-office builds. INIT blends telematics with fare modules for mid-sized fleets. HID Global differentiates through tamper-resistant chips that meet high-security transport standards. Compliance costs under PCI-DSS and PSD2 raise barriers to entry, favouring vendors that can bundle security services.
Strategic moves include Cubic’s September 2025 launch of open payments on its Umo platform, Thales teaming with Mastercard on biometric EMV cards, and Scheidt and Bachmann extending FareGo Plus to eleven Ontario agencies. As agencies demand turnkey systems that combine EMV, biometrics, and blockchain clearing while still honoring existing smart cards for unbanked riders, vendors that deliver flexible, PCI-compliant suites will consolidate share across the smart ticketing market.
Smart Ticketing Industry Leaders
Cubic Corporation
Infineon Technologies AG
Conduent Inc
HID Global
Gemalto Nv ( Thales Group)
- *Disclaimer: Major Players sorted in no particular order


Recent Industry Developments
- February 2026: Indicio launched Proven AI for Digital Travel, deploying artificial-intelligence agents to verify digital passports and streamline border-crossing authentication for airports and international rail.
- January 2026: New York Metropolitan Transportation Authority completed the OMNY rollout, removed every MetroCard machine, and activated system-wide fare capping.
- December 2025: Rail Delivery Group awarded Vix Technology a GBP 885,795 (USD 1.1 million) contract to update ITSO on Mobile firmware across the United Kingdom rail network.
- September 2025: Cubic Corporation introduced open payments on its Umo mobility platform, enabling bank-card acceptance without proprietary media.


Global Smart Ticketing Market Report Scope
The Smart Ticketing Market Report is Segmented by Component (Hardware, Software, Services), Fare Media (Smart Cards, Mobile/QR/Barcode Tickets, Wearables, Bank Cards, Validators/Machines), Technology (Closed-Loop, Open-Loop EMV, Account-Based, Biometric/Blockchain), Application (Transportation Railways, Airways, Roadways, Marine/Ferry Sports/Entertainment, Parking), End User (Public Transport Authorities, Private Operators, MaaS Providers, Event Organizers), and Geography. Market Forecasts are Provided in Terms of Value (USD).
| Hardware |
| Software |
| Services |
| Smart Cards |
| Mobile, QR and Barcode Tickets |
| Wearables |
| Bank Cards (EMV) |
| Ticket Validators and Machines |
| Closed-Loop Systems |
| Open-Loop EMV |
| Account-Based Ticketing |
| Biometric and Blockchain Authentication |
| Transportation | Railways |
| Airways | |
| Roadways | |
| Marine and Ferry | |
| Sports and Entertainment | |
| Parking |
| Public Transport Authorities |
| Private Transportation Operators |
| Mobility-as-a-Service Providers |
| Event Organizers and Venue Operators |
| North America | United States |
| Canada | |
| South America | Brazil |
| Argentina | |
| Rest of South America | |
| Europe | Germany |
| United Kingdom | |
| France | |
| Italy | |
| Spain | |
| Russia | |
| Rest of Europe | |
| Asia-Pacific | China |
| Japan | |
| India | |
| Australia and New Zealand | |
| South-East Asia | |
| Rest of Asia-Pacific | |
| Middle East | Saudi Arabia |
| United Arab Emirates | |
| Turkey | |
| Rest of Middle East | |
| Africa | South Africa |
| Nigeria | |
| Rest of Africa |
| By Component | Hardware | |
| Software | ||
| Services | ||
| By Fare Media | Smart Cards | |
| Mobile, QR and Barcode Tickets | ||
| Wearables | ||
| Bank Cards (EMV) | ||
| Ticket Validators and Machines | ||
| By Technology | Closed-Loop Systems | |
| Open-Loop EMV | ||
| Account-Based Ticketing | ||
| Biometric and Blockchain Authentication | ||
| By Application | Transportation | Railways |
| Airways | ||
| Roadways | ||
| Marine and Ferry | ||
| Sports and Entertainment | ||
| Parking | ||
| By End User | Public Transport Authorities | |
| Private Transportation Operators | ||
| Mobility-as-a-Service Providers | ||
| Event Organizers and Venue Operators | ||
| By Geography | North America | United States |
| Canada | ||
| South America | Brazil | |
| Argentina | ||
| Rest of South America | ||
| Europe | Germany | |
| United Kingdom | ||
| France | ||
| Italy | ||
| Spain | ||
| Russia | ||
| Rest of Europe | ||
| Asia-Pacific | China | |
| Japan | ||
| India | ||
| Australia and New Zealand | ||
| South-East Asia | ||
| Rest of Asia-Pacific | ||
| Middle East | Saudi Arabia | |
| United Arab Emirates | ||
| Turkey | ||
| Rest of Middle East | ||
| Africa | South Africa | |
| Nigeria | ||
| Rest of Africa | ||


Key Questions Answered in the Report
What is the projected value of the smart ticketing market in 2031?
The sector is forecast to reach USD 18.5 billion by 2031.
Which region will grow fastest through 2031?
Asia-Pacific is expected to post the quickest 8.96% CAGR, driven by national digital-identity programs and high smartphone use.
Which component currently contributes the most revenue?
Hardware leads at 51.47% of 2025 revenue because agencies continue to invest in gates, validators, and other fixed equipment.
What technology is overtaking closed-loop smart cards?
Open-loop EMV contactless is projected to expand at a 9.11% CAGR as agencies phase out proprietary fare media.
Who are notable challengers offering software-as-a-service ticketing?
Masabi, Bytemark, and Littlepay provide modular, cloud-based fare-collection platforms that integrate with existing hardware.
Why are mobility-as-a-service providers growing rapidly?
They bundle trip discovery, booking, and payment in one interface, driving a 9.05% CAGR by reducing friction for multimodal journeys.
Page last updated on:


