Market Overview
| Study Period | 2021 - 2031 |
|---|---|
| Forecast Data Period | 2026 - 2031 |
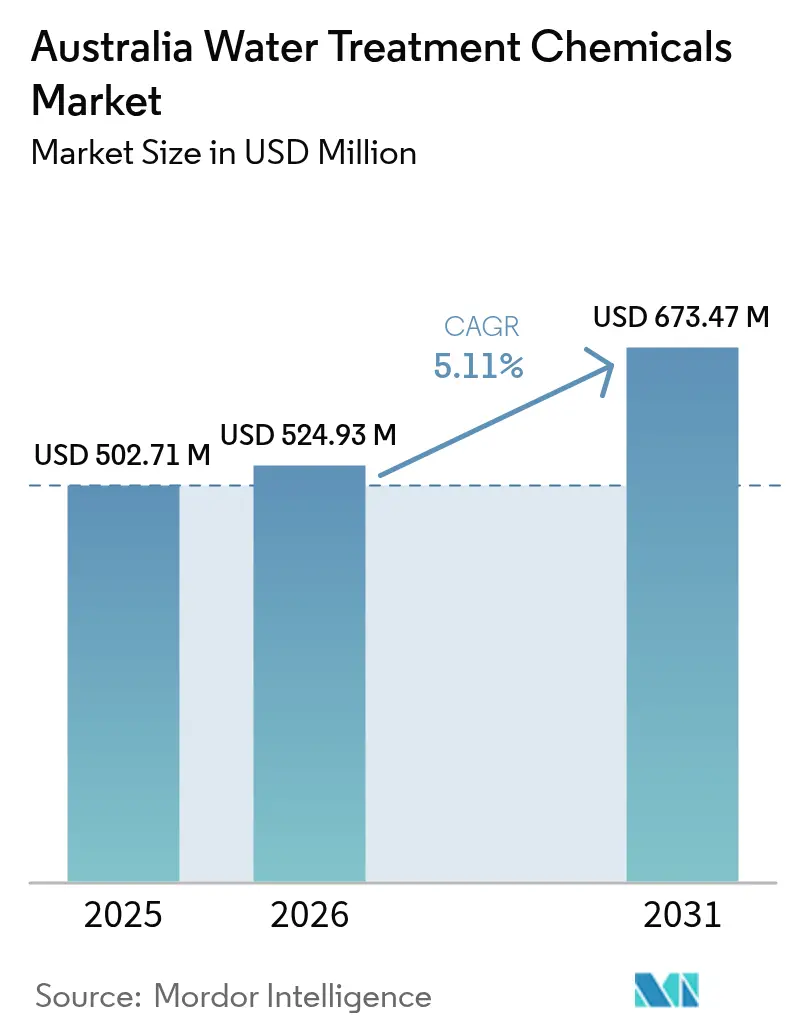
| Base Year Market Size (2025) | USD 502.71 Million |
| Market Size (2026) | USD 524.93 Million |
| Market Size (2031) | USD 673.47 Million |
| Growth Rate (2026 - 2031) | 5.11% CAGR |
| Market Concentration | Medium |
Major Players *Disclaimer: Major Players sorted in no particular order Image © Mordor Intelligence. Reuse requires attribution under CC BY 4.0. | |
Australia Water Treatment Chemicals Market Analysis by Mordor Intelligence
The Australia Water Treatment Chemicals Market size is expected to increase from USD 502.71 million in 2025 to USD 524.93 million in 2026 and reach USD 673.47 million by 2031, growing at a CAGR of 5.11% over 2026-2031. Uptake is being propelled by nutrient-discharge caps that now limit total nitrogen to 3-5 mg/L and total phosphorus to 0.5-1.0 mg/L across New South Wales municipal plants, a sharp reduction in permitted Per- and polyfluoroalkyl substances (PFAS) levels, and the refurbishment wave sweeping the country’s desalination fleet. Mining operators are adopting closed-loop water circuits to meet zero-liquid-discharge obligations, drawing in higher volumes of antiscalants and corrosion inhibitors. Meanwhile, coal-fired power’s gradual retirement constrains demand for boiler chemicals, although the deferred closure of Eraring to 2027 offers a two-year reprieve. Price instability for caustic soda and hydrochloric acid has dented commodity-grade margins, but suppliers of PFAS-free coagulants and digital dosing platforms are commanding premiums as utilities accelerate compliance spending.
Key Report Takeaways
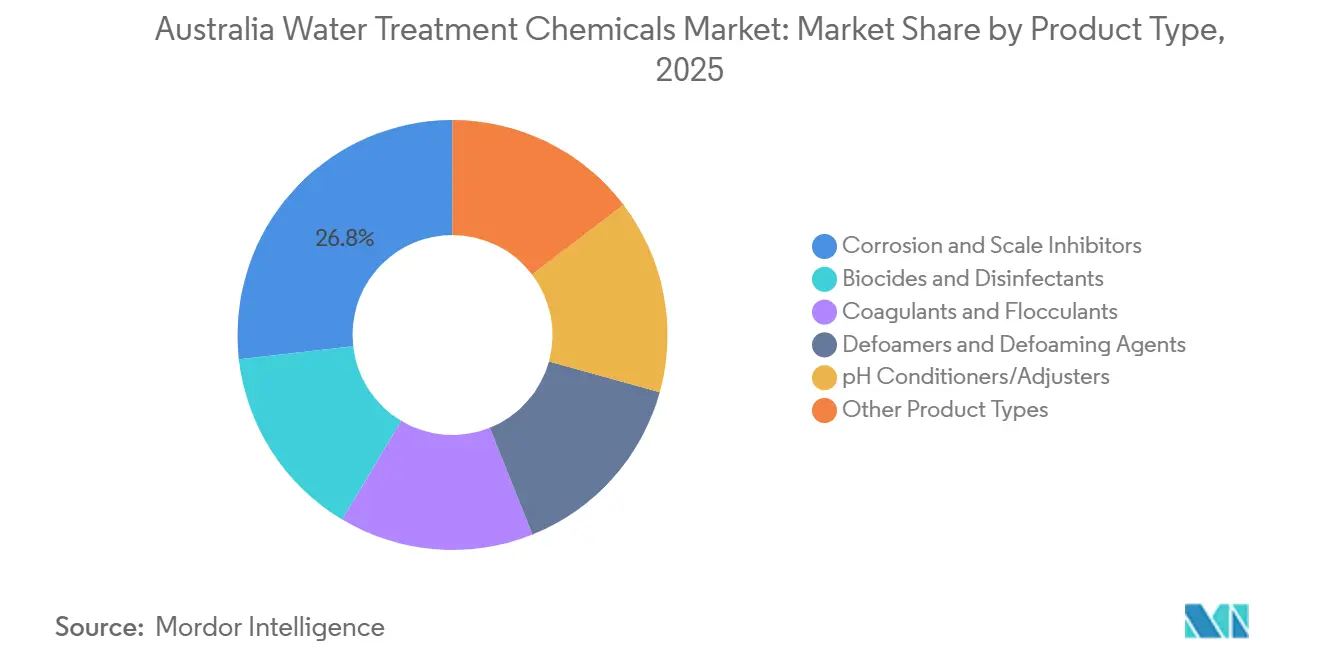
- By product type, corrosion and scale inhibitors led with 26.79% of the Australia Water Treatment Chemicals market share in 2025, while biocides and disinfectants are expected to grow at a CAGR of 5.31% during the forecast period (2026-2031).
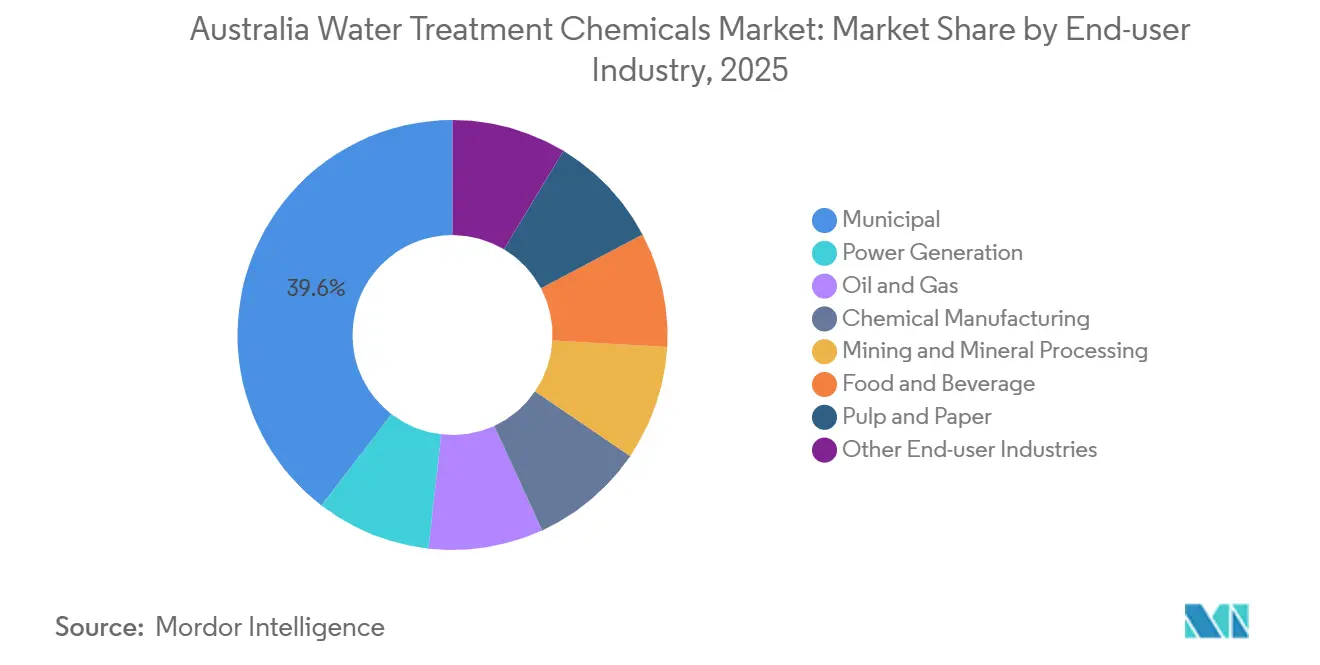
- By end-user industry, the municipal segment held 39.58% revenue in 2025 and is projected to expand at a 5.62% CAGR during the forecast period (2026-2031).
Note: Market size and forecast figures in this report are generated using Mordor Intelligence’s proprietary estimation framework, updated with the latest available data and insights as of 2026.
Australia Water Treatment Chemicals Market Trends and Insights
Drivers Impact Analysis*
| Driver | (~) % Impact on CAGR Forecast | Geographic Relevance | Impact Timeline |
|---|---|---|---|
| Tightening nutrient-discharge caps on municipal WWTP licences | +1.2% | New South Wales, Queensland, Victoria | Medium term (2-4 years) |
| Accelerating shift of coal-ash dams to zero-liquid-discharge | +0.8% | New South Wales, Queensland | Long term (≥ 4 years) |
| Rising desalination-plant refurbishments and expansions | +1.5% | New South Wales, Western Australia, South Australia | Medium term (2-4 years) |
| Ageing distribution networks causing higher leakage losses | +0.9% | National, concentrated in Sydney, Melbourne, Brisbane | Long term (≥ 4 years) |
| PFAS-driven surge in adsorptive coagulant demand | +1.3% | National, early adoption in Sydney, Perth, Adelaide | Short term (≤ 2 years) |
| Source: Mordor Intelligence | |||


Tightening Nutrient-Discharge Caps on Municipal WWTP Licences
The July 2025 Hawkesbury-Nepean framework capped total nitrogen at 3-5 mg/L and phosphorus at 0.5-1.0 mg/L for large plants, compelling Sydney Water to retrofit tertiary biological stages and step up ferric chloride dosing[1]New South Wales Environment Protection Authority, “Hawkesbury-Nepean Nutrient Management Framework,” epa.nsw.gov.au. Queensland’s Leading Practice standards impose similar limits and have already driven 94.2% nitrogen removal at South East Queensland sites. These tighter thresholds accelerate procurement of polyaluminum chloride blends that achieve phosphorus precipitation while minimizing sludge, shortening payback cycles for chemical suppliers. Liverpool and Glenfield upgrades inside the Malabar System Alliance will alone lift annual coagulant demand by more than 2,500 tonnes once fully online in 2028. Utilities delaying compliance face penalty regimes and reputational risk, further front-loading spending on pH conditioners and polymer flocculants.
Accelerating Shift of Coal-Ash Dams to Zero-Liquid-Discharge
Groundwater contamination traced to legacy ash ponds prompted the NSW (New South Wales) Environment Protection Authority in 2024 to mandate evaporator-crystallizer retrofits for remaining coal stations. Zero-liquid-discharge circuits consume antiscalants and corrosion inhibitors at 3-5 times the rate of conventional settling basins as brine concentrations rise. Refits at Eraring and Vales Point must be completed before scheduled closures, compressing capital spending and locking in multi-year specialty chemical contracts. While dry-ash handling can remove wet chemistry entirely, project costs above USD 50 million are steering most operators toward chemical remedies for the life-of-plant window. Formulators demonstrating National Sanitation Foundation/American National Standards Institute (NSF/ANSI) 60 certification under high-salinity stresses are securing agreements that shield them from commodity price swings.
Rising Desalination-Plant Refurbishments and Expansions
Sydney Water broke ground in March 2026 on a 250 ml/day expansion of the Kurnell seawater reverse-osmosis facility, an USD 800 million project that will double antiscalant and biocide demand when new trains start in 2028. Western Australia’s Water Corporation awarded Kemira a USD 15 million, multi-year supply of polyaluminum chloride and ferric sulfate for the 150,000 m³/day Alkimos plant slated for 2028 commissioning. Desalination recovery ratios of 40-50% intensify scaling tendencies, driving higher doses of proprietary phosphonate-based inhibitors. Gold Coast City Council opened a feasibility study in May 2025 to expand its plant, signaling a permanent shift toward desalination as a baseload supply rather than a drought reserve. Each refurbishment widens the Australia water treatment chemicals market by adding customers that need NSF-compliant formulations with low membrane fouling potential.
Ageing Distribution Networks Causing Higher Leakage Losses
Asbestos-cement and cast-iron mains laid in the 1950s now account for water-loss rates of 7-11% across major cities, translating into more than 200 GL (gigaliter) of non-revenue water each year. Pipe replacement programs are capital-intensive, so utilities inject orthophosphate and zinc-based corrosion inhibitors to extend asset life by up to a decade. The Australian Water Association estimates that every 1% leakage reduction defers USD 15 million in capital outlays. However, a gradual transition to polyethylene mains in greenfield suburbs is shrinking long-run inhibitor volumes, concentrating consumption in aging metropolitan cores. Suppliers offering real-time corrosion monitoring and AS/NZS (Australian/New Zealand Standard) 4020-compliant chemistries are winning framework contracts that ensure steady demand even as physical pipe upgrades progress.
Restraints Impact Analysis*
| Restraint | (~) % Impact on CAGR Forecast | Geographic Relevance | Impact Timeline |
|---|---|---|---|
| Electro-oxidation and UV-AOP as chemical-free substitutes | -0.7% | National, early adoption in industrial wastewater sectors | Medium term (2-4 years) |
| Volatility of bulk caustic-soda and HCl pricing | -0.5% | National, concentrated in chemical-intensive industries | Short term (≤ 2 years) |
| State bans on fluorinated defoamers and surfactants | -0.4% | National, immediate impact in industrial and municipal sectors | Short term (≤ 2 years) |
| Source: Mordor Intelligence | |||
Electro-Oxidation and UV-AOP as Chemical-Free Substitutes
Mining and beverage plants are piloting electro-oxidation cells that generate hydroxyl radicals in situ, achieving 85% dissolved-solids reduction without external reagents during a 2024 Queensland trial[2]Industry Queensland, “Electro-oxidation Pilot Cuts Chemical Use,” industry.qld.gov.au. UV-AOP (Ultraviolet-based Advanced Oxidation Process) systems pair ultraviolet lamps with peroxide for simultaneous oxidation and disinfection, lowering sludge disposal costs and simplifying permits. Capital outlays of USD 0.5-2 million per system and recurring electrode or lamp replacements curb wholesale substitution but still erode chemical volumes in high-value industrial niches. Municipal utilities remain wary of the higher upfront spend, preserving a core market for coagulants and disinfectants. Over time, hybrid plants blending electro-oxidation pretreatment with downstream chemical polishing may become the norm, gradually trimming overall reagent demand.
Volatility of Bulk Caustic-Soda and HCl Pricing
Quarterly spot swings above 15% in 2025 strained desalination and mining operators that dose more than 50 kg of caustic per megalitre of water treated. Domestic chlor-alkali plants run at near-full utilization, and scheduled maintenance outages leave little buffer. Import reliance exposes buyers to freight-rate spikes and exchange-rate risk, prompting six-to-12-month contracts with energy-indexed escalation clauses. End-users are testing sodium carbonate and magnesium hydroxide as partial alkali substitutes, but formulation costs and performance trade-offs have slowed adoption. Until new capacity or renewable energy price declines stabilize the input market, operators will face budgeting uncertainty that delays project approvals and clips the Australia water treatment chemicals market’s near-term volume upside.
*Our forecasts treat driver/restraint impacts as directional, not additive. The impact forecasts reflect baseline growth, mix effects, and variable interactions.
Segment Analysis
By Product Type: Corrosion Inhibitors Lead, Biocides Accelerate
Corrosion and Scale Inhibitors captured 26.79% of the Australia Water Treatment Chemicals market share in 2025, reflecting their indispensability in desalination, cooling-tower, and mining circuits where fouling can halve membrane life. The segment’s prominence anchors the Australia Water Treatment Chemicals market size for upstream suppliers, who continue to improve phosphonate blends that tolerate high-silica brines. Biocides and Disinfectants sit second in value but first in growth, registering a 5.31% CAGR during the forecast period (2026-2031) as utilities migrate from chlorine gas to sodium hypochlorite, chlorine dioxide, and peracetic acid to meet lower disinfection-by-product limits.
Coagulants and Flocculants benefit from PFAS remediation and nutrient-removal retrofits, with polyaluminum chloride preferred for simultaneous turbidity and phosphorus knockdown. pH Conditioners and Adjusters rely heavily on caustic soda and sulfuric acid; volatility has nudged some sites toward sodium carbonate, though adoption remains limited. Defoamers experienced disruption due to the PFAS ban but are rebounding on the strength of newly certified silicone lines. Niche chemistries such as oxygen scavengers and chelants remain tied to power boiler cycles and boutique industrial polishing lines, tapering alongside coal plant retirements yet stable inside zero-liquid-discharge installations.


By End-User Industry: Municipal Dominance, Mining Resilience
Municipal operators held 39.58% of 2025 demand and are projected to post the fastest 5.62% CAGR during the forecast period (2026-2031), powered by desalination expansions, leakage mitigation dosing, and PFAS compliance schedules. Their purchasing volume cements the Australia Water Treatment Chemicals market’s baseline, even if individual plants periodically pause procurement during audits. Mining and Mineral Processing rank second and remain resilient thanks to the USD 6.5 billion Olympic Dam expansion and Fortescue’s 70% water-reuse target, both of which underpin long-run contracts for corrosion inhibitors, biocides, and antiscalants.
Power Generation’s chemical use is easing as coal units retire, although temporary extensions at Eraring and the ash-pond closure mandate extend residual demand into 2027. Oil and Gas stays steady on the back of produced-water treatment at offshore platforms, while Chemical Manufacturing tracks refinery and petrochemical utilization rates. Food and Beverage processors, notably dairy and soft-drink plants, are incorporating membrane and UV systems that demand biofilm control but lower chlorine use. Smaller contributors, from electronics to pharmaceuticals, show above-average gains as manufacturers install closed-loop rinse systems to lower freshwater fees, adding incremental volume to the Australia water treatment chemicals market.
Geography Analysis
New South Wales leads current demand as Sydney Water’s desalination expansion and nutrient-cap retrofits converge, making the state the single largest buyer of polyaluminum chloride, ferric salts, and specialized biocides. Western Australia follows, anchored by the Alkimos plant build-out and high-salinity bore-field treatment at Pilbara mining camps, which together elevate antiscalant and corrosion-inhibitor needs. South Australia’s 5.3 GL/year Eyre Peninsula seawater project, coupled with BHP’s mining expansion, positions the state for the fastest regional CAGR between 2026 and 2031. Victoria contributes significant volume through the Wonthaggi desalination plant, recently allocated a 50 GL order for 2025/26, and through Melbourne’s aggressive leakage-reduction dosing strategy. Queensland maintains steady consumption via nutrient-cap compliance and mining tailings management, but records slower growth compared with the desalination-heavy states.
Rural regions in the Northern Territory and Tasmania represent smaller absolute volumes yet offer specialty-chemistry opportunities tied to hydroelectric reservoir management and aquaculture effluent polishing. The Australia Water Treatment Chemicals market size for these peripheral zones remains modest but enjoys margin upside due to logistical complexities and low competitive intensity. Across all jurisdictions, utilities favor suppliers capable of stocking product in-country to mitigate import delays, a lesson reinforced during 2025’s freight bottlenecks.
Competitive Landscape
The Australia Water Treatment Chemicals market is moderately consolidated. Global majors, Ecolab, Kemira, and Solenis, leverage wide product catalogs and digital dosing technologies, while domestic groups such as IXOM, Waterco, and IWTS retain share through localized manufacturing and faster site support. Specialty niches, especially PFAS-free coagulants and silicone defoamers, deliver double-digit margins due to regulatory urgency and limited qualified competition.
Australia Water Treatment Chemicals Industry Leaders
Ecolab
Solenis
SNF
Ixom
Kemira
- *Disclaimer: Major Players sorted in no particular order

Recent Industry Developments
- January 2026: ACCIONA, in collaboration with Snowy Mountains Engineering Corporation (SMEC), secured a partnership with Sydney Water, the largest water utility in Australia. Spanning a decade, this initiative seeks to bolster and broaden Sydney's wastewater treatment capabilities. As a result, this expansion is expected to drive up the demand for water treatment chemicals across Australia.
- November 2024: Centurion Group Ltd., based in Australia, unveiled a new chemical range from Centurion Water and Wastewater Solutions, aimed at enhancing the performance of water and wastewater infrastructure.


Australia Water Treatment Chemicals Market Report Scope
Water treatment is a process that extracts or reduces the level of pollutants and undesirable components from water to make it suitable for use. The chemicals used in this method are referred to as water treatment chemicals. Algicide, chlorine, and chlorine dioxide are some examples of water treatment chemicals.
The water treatment chemicals market is segmented by product type and end-user industry. By product type, the market is segmented into biocides and disinfectants, coagulants and flocculants, corrosion and scale inhibitors, defoamers and defoaming agents, pH conditioners/adjusters, and other product types. By end-user industry, the market is segmented into power generation, oil and gas, chemical manufacturing, mining and mineral processing, municipal, food and beverage, pulp and paper, and other end-user industries. For each segment, the market sizing and forecasts have been done on the basis of value (USD).
By Product Type
| Biocides and Disinfectants |
| Coagulants and Flocculants |
| Corrosion and Scale Inhibitors |
| Defoamers and Defoaming Agents |
| pH Conditioners/Adjusters |
| Other Product Types |
By End-user Industry
| Power Generation |
| Oil and Gas |
| Chemical Manufacturing |
| Mining and Mineral Processing |
| Municipal |
| Food and Beverage |
| Pulp and Paper |
| Other End-user Industries |
| By Product Type | Biocides and Disinfectants |
| Coagulants and Flocculants | |
| Corrosion and Scale Inhibitors | |
| Defoamers and Defoaming Agents | |
| pH Conditioners/Adjusters | |
| Other Product Types | |
| By End-user Industry | Power Generation |
| Oil and Gas | |
| Chemical Manufacturing | |
| Mining and Mineral Processing | |
| Municipal | |
| Food and Beverage | |
| Pulp and Paper | |
| Other End-user Industries |


Key Questions Answered in the Report
How large will Australia’s water treatment chemicals spending be by 2031?
It is forecast to reach USD 673.47 million by 2031, growing at a 5.11% CAGR from 2026.
Which product category currently holds the greatest share?
Corrosion and Scale Inhibitors led with 26.79% of 2025 revenue.
What is driving the fastest growth among product types?
Biocides and Disinfectants benefit from the shift toward chlorine-dioxide and peracetic-acid dosing, advancing at a 5.31% CAGR to 2031.
Why are municipal utilities increasing chemical purchases?
Drought-proof desalination expansions, PFAS remediation timelines, and tighter nutrient caps are simultaneously lifting coagulant, antiscalant, and biocide demand.
How are PFAS regulations reshaping formulators’ product lines?
The 2025 ban on PFOS, PFOA, and PFHxS forced suppliers to launch PFAS-free coagulants and defoamers, opening premium niches for certified alternatives.
Page last updated on:


