Market Overview
| Study Period | 2018 - 2031 |
|---|---|
| Forecast Data Period | 2026 - 2031 |
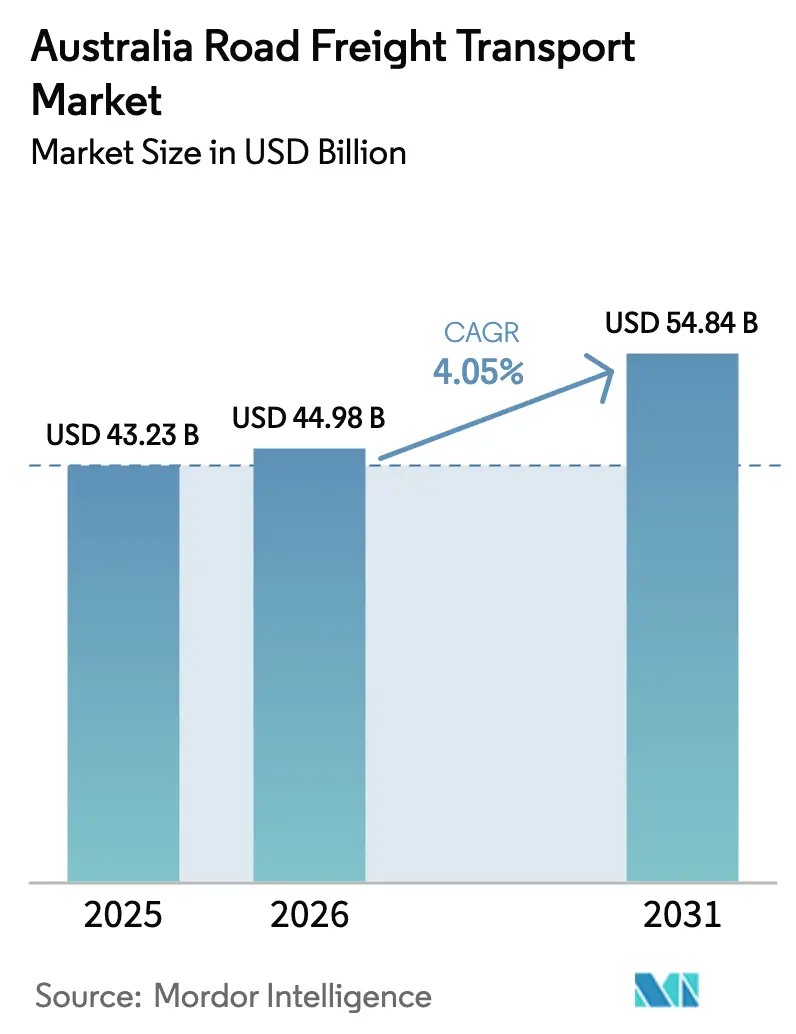
| Base Year Market Size (2025) | USD 43.23 Billion |
| Market Size (2026) | USD 44.98 Billion |
| Market Size (2031) | USD 54.84 Billion |
| Growth Rate (2026 - 2031) | 4.05% CAGR |
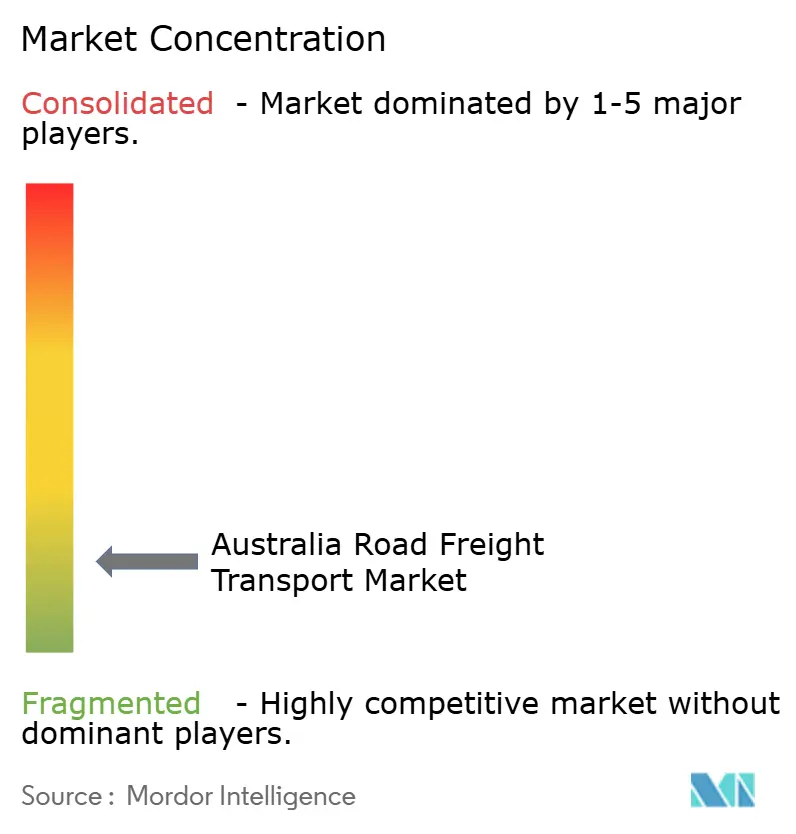
| Market Concentration | Low |
Major Players *Disclaimer: Major Players sorted in no particular order Image © Mordor Intelligence. Reuse requires attribution under CC BY 4.0. | |
Australia Road Freight Transport Market Analysis by Mordor Intelligence
The Australia road freight transport market size is expected to grow from USD 43.23 billion in 2025 to USD 44.98 billion in 2026 and is forecast to reach USD 54.84 billion by 2031 at 4.05% CAGR over 2026-2031. This expansion reflects surging demand from e-commerce, mining, and infrastructure programs, along with growing investment in electric and hydrogen trucks. Intensifying competition, accelerating cold-chain adoption, and tighter environmental regulations are reshaping service models, pricing structures, and fleet strategies within the Australia road freight transport market. High capital outlays for fleet renewal and data-driven optimization give large operators a scale advantage, yet nimble regional carriers continue to win share in last-mile and specialized niches. The market’s growth outlook remains closely tied to the AUD 120 billion (USD 81.66 billion) federal infrastructure pipeline, sustained mineral export volumes, and the speed of technology rollouts. Renewed focus on driver retention, safety upgrades, and carbon-reduction initiatives rounds out the immediate priorities influencing investment decisions across the Australia road freight transport market.
Key Report Takeaways
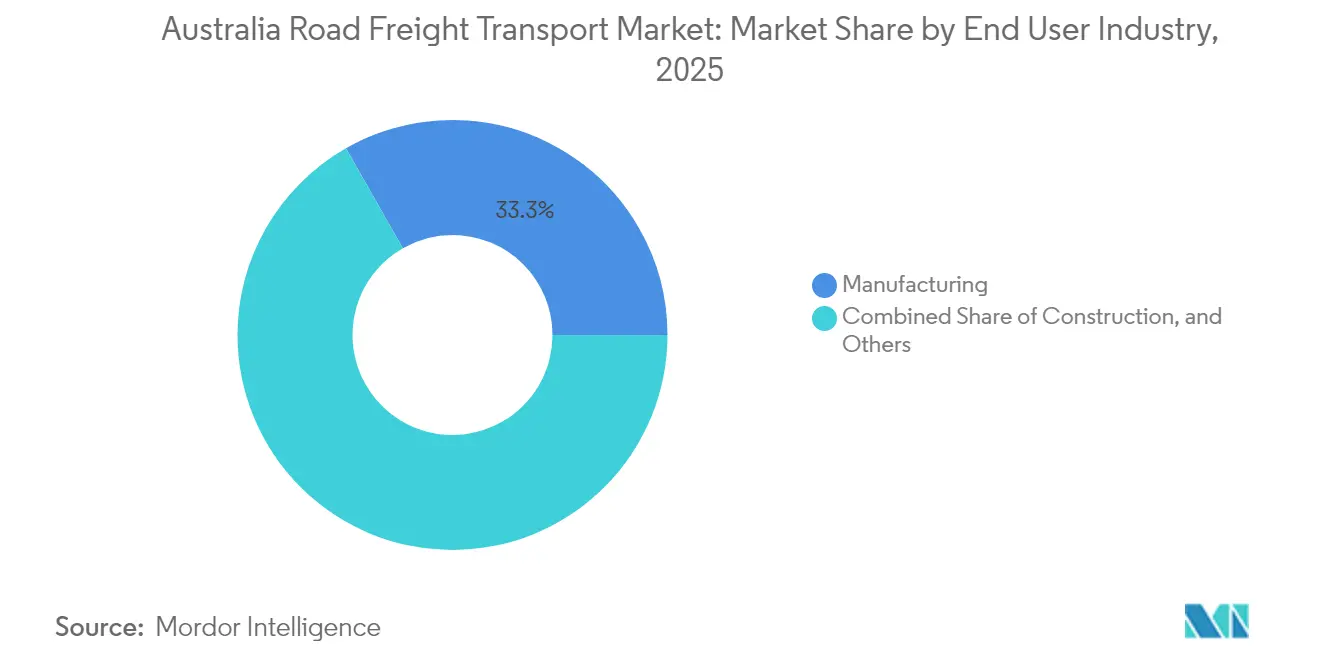
- By end user industry, manufacturing led with a 33.25% of the Australia road freight transport market share in 2025, while wholesale and retail trade is projected to expand at a 4.63% CAGR between 2026-2031.
- By truckload specification, full-truck-load operations commanded 81.65% of the Australia road freight transport market size in 2025, and less-than-truck-load services are forecast to grow at a 4.58% CAGR between 2026-2031.
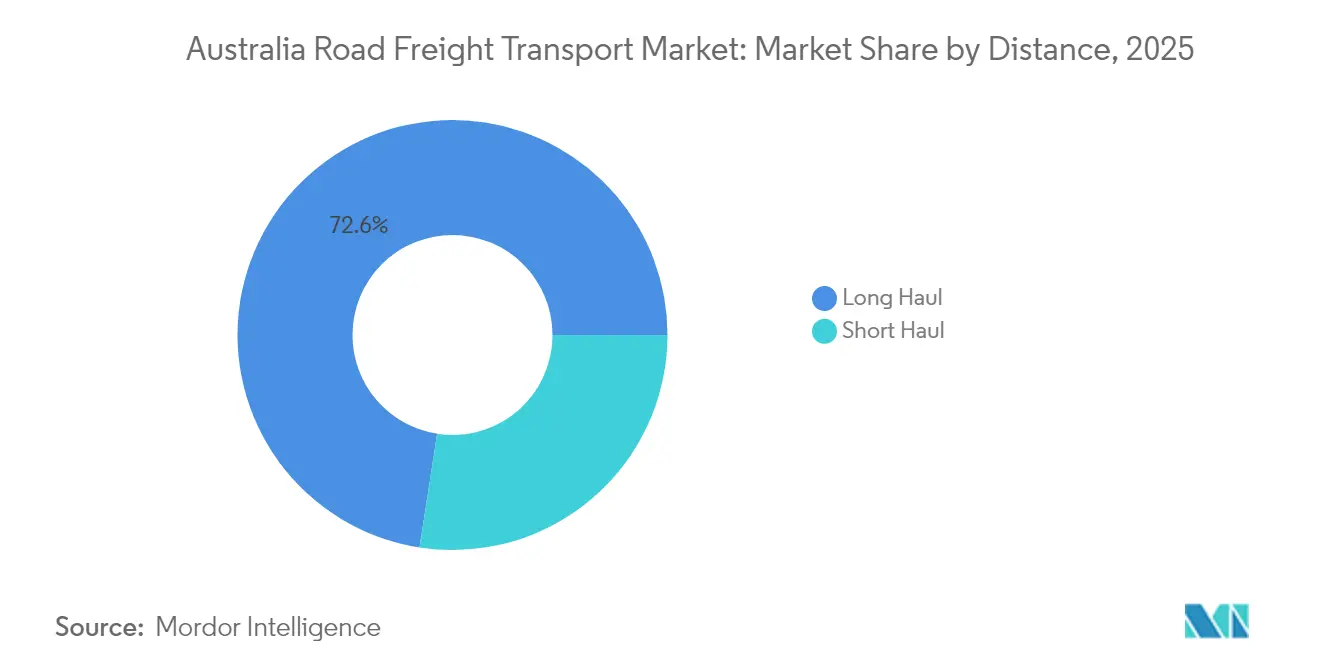
- By distance, long-haul corridors captured 72.55% of market share in 2025 and are expected to post the fastest 4.32% CAGR during 2026-2031.
- By containerization, non-containerized freight dominated with an 87.05% share in 2025, whereas containerized cargo is set to rise at a 4.18% CAGR between 2026-2031.
- By goods configuration, solid goods held a 64.85% share in 2025, while fluid goods are positioned for a 4.33% CAGR between 2026-2031.
- By temperature control, non-temperature-controlled freight accounted for 94.10% of 2025 revenue, and the temperature-controlled segment is anticipated to grow at a 4.48% CAGR between 2026-2031.
- By destination, domestic operations represented the entire market with a 100.00% share in 2025 and are projected to expand in line with the overall 4.05% CAGR between 2026-2031.
Note: Market size and forecast figures in this report are generated using Mordor Intelligence’s proprietary estimation framework, updated with the latest available data and insights as of 2026.
Australia Road Freight Transport Market Trends and Insights
Drivers Impact Analysis*
| Driver | (~) % Impact on CAGR Forecast | Geographic Relevance | Impact Timeline |
|---|---|---|---|
| Federal AUD 120 billion (USD 81.66 billion) infrastructure pipeline | +1.2% | National, early gains in Queensland, NSW, Victoria | Long term (≥ 4 years) |
| Explosive e-commerce parcel growth | +0.9% | Major metropolitan areas | Medium term (2-4 years) |
| Mining and critical-minerals export surge | +0.8% | Western Australia, Queensland, Northern Territory | Medium term (2-4 years) |
| Rapid fleet electrification and hydrogen corridors | +0.6% | Victoria, NSW, South Australia | Long term (≥ 4 years) |
| National Freight Data Hub roll-out | +0.4% | Key interstate corridors | Short term (≤ 2 years) |
| Modular AB-Triple road-train approvals | +0.3% | Northern Territory, Western Australia, Queensland | Medium term (2-4 years) |
| Source: Mordor Intelligence | |||
Federal AUD 120 Billion (USD 81.66 Billion) Infrastructure Pipeline Accelerates Freight Demand
Federal and state commitments totaling AUD 120 billion (USD 81.66 billion) are widening and strengthening road corridors, lifting heavy-vehicle capacity and dispatch frequencies. The Bruce Highway upgrade (AUD 7.2 billion) and Stage 1 of the Coomera Connector (AUD 3.026 billion) alone open substantial lane kilometers in Queensland, triggering higher runs of construction inputs, machinery, and maintenance supplies. With infrastructure works typically generating three to four times their spend in freight activity, operators anticipate over AUD 400 billion (USD 272.22 billion) in associated transport flows through 2030. Network densification in growth corridors enables higher-capacity vehicles, encourages backhaul utilization, and underpins sustained rate stability across the Australia road freight transport market[1]“Coomera Connector (Stage 1),” Queensland Department of Transport and Main Roads, tmr.qld.gov.au
E-Commerce Parcel Growth Transforms Last-Mile Operations
Australia Post deregulation in 2024 unlocked parcel delivery competition, prompting a wave of tech-enabled entrants that emphasize speed, visibility, and emissions tracking. Digital marketplace providers report monitoring 22 million km of freight each year to optimize routes and carbon output. Urban consolidation centers in Sydney’s Outer West and Melbourne’s western corridor anchor hub-and-spoke models favoring smaller, frequent loads. The shift from palletized freight to parcel volumes heightens demand for agile fleets, data analytics, and flexible labor pools, supporting double-digit revenue growth among specialized last-mile operators within the Australia road freight transport market[2]“State of Australia’s Regions 2024,” Department of Infrastructure, Transport, Regional Development, and Communications, infrastructure.gov.au .
Mining Export Surge Drives Heavy-Haul Corridor Development
Iron ore, lithium, and critical-minerals exports continue to set tonnage records, reinforcing Western Australia’s and Queensland’s roles in heavy-haul logistics. Investment cases such as the 150 km autonomous haul road with 330-ton payload capacity illustrate capital intensity and the pivot toward unmanned transport systems. Mining‐oriented contractors capture premium rates for specialized vehicles, oversized permits, and remote-area expertise. The resulting corridor traffic supports rest-area upgrades, refueling hubs, and predictive maintenance services that together stabilize long-haul volumes across the Australia road freight transport market.
Rapid Fleet Electrification Despite Infrastructure Challenges
Operators are steadily ordering battery-electric and hydrogen trucks to shield against fuel volatility and impending carbon levies. Toll Group’s purchase of 28 heavy-duty electric units, backed by AUD 9 million (USD 6.12 million) in federal assistance, signals mainstream fleet adoption. Volvo Trucks will commence domestic production in 2026, anchoring a local supply chain for zero-emission rigs. Charging and hydrogen‐refuel coverage remains limited outside capital corridors, however, reinforcing the need for public-private financing models to match the long-haul footprint of the Australia road freight transport market.
Restraints Impact Analysis*
| Restraint | (~) % Impact on CAGR Forecast | Geographic Relevance | Impact Timeline |
|---|---|---|---|
| Chronic driver shortage and aging workforce | -0.8% | National, acute in remote mining regions | Short term (≤ 2 years) |
| Volatile diesel prices and forthcoming carbon levy | -0.6% | National, heavier toll on long-haul operators | Medium term (2-4 years) |
| State road-user charge on zero-emission trucks | -0.4% | Victoria leading, potential national adoption | Medium term (2-4 years) |
| Fragmented oversize-permit system | -0.3% | National, high impact on heavy haulage | Short term (≤ 2 years) |
| Source: Mordor Intelligence | |||
Chronic Driver Shortage Constrains Capacity Expansion
The median driver age stands at 48 years and retirements outpace new entrants, especially in remote corridors. With 185,300 professional drivers nationally, vacancy rates push upward wage pressure and accelerate automation pilots. Operators invest in training subsidies and flexible rosters to counter attrition, but short-term capacity tightness elevates freight rates and limits rapid fleet scaling across the Australia road freight transport market[3]“Lineage Logistics–Fremantle Coldstores,” Australian Competition and Consumer Commission, accc.gov.au .
Volatile Diesel Prices and Carbon Levy Pressure Margins
Fuel constitutes roughly 25-30% of operating costs, exposing carriers to currency swings and Middle East supply risks. Upcoming international carbon pricing on shipping will filter through to domestic diesel import costs, while Australia’s New Vehicle Efficiency Standard boosts equipment purchase prices. Operators with modern, fuel-efficient tractors and index-linked contracts are best placed to defend margins; spot-market carriers remain vulnerable to margin erosion[4]“Lindsay Australia Member Profile,” Refrigerated Warehouse & Transport Association, rwta.com.au.
*Our forecasts treat driver/restraint impacts as directional, not additive. The impact forecasts reflect baseline growth, mix effects, and variable interactions.
Segment Analysis
By End User Industry: Manufacturing Stability, Retail Momentum
Manufacturing retained a 33.25% share of the Australia road freight transport market in 2025, thanks to steady component inflows and finished-goods dispatches nationwide. High plant uptime and predictable replenishment cycles support year-round truck demand, underpinning continuous fleet deployment and warehouse throughput. Wholesale and retail trade, propelled by e-commerce micro-fulfillment, is projected to clock the fastest 4.63% CAGR between 2026-2031. Retailers consolidate stock in edge warehouses near Sydney and Melbourne, driving dense shuttle loops that favor agile carriers. Construction freight rises in line with the infrastructure pipeline, while mining continues to generate substantial tonnage on bulk corridors. Agriculture and forestry present seasonal peaks that challenge asset utilization, prompting carriers to mix contract and spot work to smooth revenue flows. Niche areas, from renewable-energy equipment moves to critical-minerals processing inputs, offer incremental volume and higher yields, diversifying revenue streams within the Australia road freight transport industry.
The Australia road freight transport market size tied to manufacturing is expected to advance in tandem with on-shoring trends, while retail-related tonnage should outpace GDP as consumer expectations for next-day delivery intensify. Government innovation grants aim to uplift small carriers serving fragmented sectors, keeping competition lively and rates responsive to service quality. Consolidated route planning and backhaul partnerships between shippers mitigate empty mileage and environmental impact.


By Destination: Domestic Dominance Shapes Strategy
The domestic segment captured 100.00% of the Australia road freight transport market share in 2025 and is projected to expand in lockstep with the 4.05% CAGR between 2026-2031. Australia’s geographic isolation and the absence of land borders make road freight indispensable for connecting production hubs, ports, and consumer centers spread across a continent-sized landmass. Long-haul east-to-west and north-to-south corridors handle the bulk of ton-kilometers, while dense urban networks in Sydney, Melbourne, and Brisbane manage the majority of last-mile deliveries. National infrastructure projects such as the Bruce Highway and Coomera Connector upgrades further entrench domestic flows by shortening transit times and reducing vehicle operating costs.
With no cross-border trucking to compete for capacity, carriers calibrate fleets around interstate legislation, differing road-user charges, and diverse terrain—from desert corridors in Western Australia to alpine routes in New South Wales. Domestic exclusivity amplifies the need for backhaul optimization because empty running directly erodes margins across vast distances. Climate resilience planning has grown in priority as floods and bushfires disrupt key arteries, prompting investment in alternate routes and multimodal contingency plans that keep time-sensitive shipments moving within Australia’s wholly domestic road freight ecosystem.
By Truckload Specification: FTL Dominance Faces LTL Upshift
Full-truck-load commands 81.65% of 2025 revenue, reflecting the geography and bulk shipment profile of mining, agriculture, and construction freight. Dedicated contract hauls offer predictable cycles, higher asset turns, and longer driver tenure. Less-than-truck-load, rising at 4.58% CAGR between 2026-2031, benefits from digital load-matching tools that aggregate small consignments, trim empty legs, and cut emissions. Urban congestion charges and sustainability pledges encourage shippers to pool freight, tilting share gains toward LTL operators able to orchestrate multi-stop routes efficiently.
The Australia road freight transport market size linked to LTL remains smaller than FTL but commands premium yield per ton thanks to added handling, sorting, and technology overlays. Cross-dock terminals in Melbourne and Brisbane optimize break-bulk operations, while dynamic pricing algorithms match capacity to real-time demand. FTL retains the edge in payload efficiency and regulatory simplicity, especially along mining corridors where over-dimension loads prevail. Together, hybrid fleet strategies that mix FTL backbone legs with LTL feeders are emerging as a competitive norm.
By Containerization: Standardization Gains but Bulk Prevails
Non-containerized cargo accounted for 87.05% of 2025 revenue, dominated by bulk ores, machinery, and construction materials. Containerized freight, rising at a 4.18% CAGR between 2026-2031, gains traction where standardized handling slashes wait times and enables intermodal hand-offs. Melbourne trials show up to 25% cost reduction when carriers embrace uniform swap-body units. Logistics parks retrofit with reach-stackers and automated gates to expedite box flow, attracting exporters of processed foods and value-added minerals.
Standardization supports digitized track-and-trace, temperature monitoring, and customs pre-clearance, enhancing supply-chain transparency. Nonetheless, heavy machinery, steel, and oversize mining equipment continue to rely on bespoke flatbeds and extendables. Operators maintain mixed asset pools to tap both streams, protecting utilization across commodity cycles in the Australia road freight transport market.
By Distance: Long-Haul Superiority with Corridor Optimization
Long-haul routes held 72.55% of 2025 revenues and are forecast to expand at a 4.32% CAGR between 2026-2031, bolstered by interstate trade and resource exports. The Sydney–Melbourne and Melbourne–Brisbane lanes remain the country’s heaviest corridors, supported by rest-area refurbishments and telematics-based fatigue management. Short-haul services face rising competition from rail intermodal and last-mile specialists, yet they remain essential for port drays, regional milk runs, and store replenishment. The impending Inland Rail route could siphon some container traffic, but road transport retains time-sensitive and door-to-door advantages.
Long-haul carriers leverage AB-Triple permits to lift payloads, deploy aero kits for fuel savings, and roll out predictive analytics that synchronize refueling and maintenance stops. Short-haul fleets emphasize electric delivery vans and route density to cut urban emissions. Corridor planning tightly integrates with warehousing nodes, ensuring seamless switch between trunk and distribution legs within the Australia road freight transport market.
By Goods Configuration: Solid Backbone, Fluid Growth Path
Solid goods made up 64.85% of revenue in 2025 and include everything from supermarket stock to fabricated steel. Predictable replenishment cycles align with fixed weekly delivery grids. Fluid goods, expanding at 4.33% CAGR between 2026-2031, capitalize on hydrogen pilot corridors, biodiesel blending mandates, and chemical inputs for battery production. Tanker fleets upgrade to multi-compartment designs that boost backhaul potential and comply with evolving dangerous-goods codes.
Shippers demand real-time pressure and temperature telemetry, prompting carriers to integrate IoT sensors into fluid trailers. Insurance premiums reward operators with proven monitoring systems, lowering total cost of ownership. Solid-goods carriers retrofit drop-deck curtainsiders with forklift-friendly flooring to expedite dock turns, supporting the continuous flow model central to the Australia road freight transport market.
By Temperature Control: Cold-Chain Acceleration Across Sectors
Ambient freight still dominates at 94.10% in 2025, but temperature-controlled volumes, although only 5.90%, post the highest 4.48% CAGR between 2026-2031. Vaccine distribution, fresh produce exports, and ready-meal penetration fuel specialized demand. Networks such as Lindsay Australia’s multi-state cold-store grid underpin nationwide chilled coverage. Reefer fleets deploy multi-zone units, door sensors, and satellite tracking that prove compliance during audits.
Higher capital thresholds limit new entrants, fostering moderate consolidation and pricing resilience. Pharmaceutical clients award multi-year contracts with stringent KPI clauses, favoring carriers that certify GDP and ISO standards. Food retailers seek carbon footprint reporting, spurring uptake of solar-assisted refrigeration and alternative refrigerants, reinforcing sustainability leadership within the Australia road freight transport market.
Geography Analysis
Australia’s domestic freight captures 100% share, with the Australia road freight transport market growing at a steady 4.05% CAGR between 2026-2031. Queensland records outsized gains as the Bruce Highway and Coomera Connector build-outs ease bottlenecks and expand access to rapidly urbanizing coastal hubs. Victoria’s Freight Sector Innovation Fund injects AUD 8 million into SME digitalization and low-emission trials, reinforcing its reputation as a logistics technology testbed. New South Wales benefits from Sydney’s role as the largest import gateway, yet land scarcity drives distribution centers outward to Western Sydney and the Hunter Valley.
Western Australia remains distinct, anchored by mining exports through Port Hedland and Kwinana. Heavy-haul road trains dominate the Pilbara, where distances, 50°C heat, and red-dust conditions dictate rugged vehicle specifications. South Australia and Tasmania participate mainly through agricultural and wine flows, relying on Bass Strait ferries and Adelaide-centric warehousing nodes. The Northern Territory, with sparse population density, presents niche opportunities in oversize mining equipment and remote community resupply, relying heavily on high-productivity road-train permits.
Climate extremes intensify, prompting governments to allocate resilience funding for flood-prone arterial repairs and elevated causeways. Carriers integrate weather-based routing to minimize delays, while insurers differentiate premiums by telematics penetration and driver training levels. State road-user-charge proposals for electric trucks create planning uncertainty; national harmonization remains a critical policy ambition to streamline interstate operations across the Australia road freight transport market.
Competitive Landscape
The Australia road freight transport market exhibits fragmentation, with the top five carriers controlling a little over 30% revenue. Toll Group’s AUD 200 million (USD 136.11 million) Euro 6 fleet overhaul in 2024 reduced emissions up to 10% and strengthened its contract renewal prospects among blue-chip shippers. Linfox placed Australia’s largest electric-truck order, purchasing 30 Volvo FH/FM Electric units in 2025 to meet retailer sustainability mandates. Aurizon’s safety incident in July 2025 spotlighted ongoing challenges at rail-road interfaces and reinforced calls for upgraded crossing protections.
The 2024 DSV-DB Schenker merger created a global logistics heavyweight set to leverage integrated air, sea, and road solutions in Australia, potentially squeezing mid-tier carriers on multinational tenders. Autonomous truck pilots in Western Australia demonstrate early productivity wins, but high capex limits near-term adoption to resource majors and large 3PLs. Digital freight platforms connect small carriers to enterprise shippers, promoting price transparency yet compressing margins. Specialized niches such as cold-chain, dangerous goods, and oversize loads offer defensible profitability due to regulatory barriers and equipment specificity.
M&A appetite remains healthy as family-owned fleets seek succession options and strategic buyers chase density. Banks favor asset-backed lending to larger fleets with telemetry-verified utilization data, nudging independents toward consolidation. Sustainability credentials increasingly influence contract awards, so early movers in EVs, hydrogen trials, and verified carbon reporting gain a competitive edge within the Australia road freight transport market.
Australia Road Freight Transport Industry Leaders
K&S Group
Linfox Pty Ltd.
LINX Cargo Care Group
Toll Group
Team Global Express
- *Disclaimer: Major Players sorted in no particular order

Recent Industry Developments
- July 2024: Aurizon Holdings faced operational disruption when one of its CBH grain freight trains was involved in a fatal level-crossing collision in Redmond, Western Australia.
- May 2025: Linfox received an order for 30 battery-electric heavy-duty trucks from Volvo (29 FH Electric, 1 FM Electric), representing the largest electric truck order in Australia.
- October 2024: Toll Group invested AUD 200 million (USD 136.11 million) to renew 25% of its Australian fleet, purchasing nearly 400 Euro 6 prime movers and 20 rigid vehicles in partnership with Penske, Volvo Group Australia, and Isuzu.
- March 2024: DHL Group announced expansion of its Australian express network capabilities through enhanced last-mile delivery infrastructure in major metropolitan areas.


Australia Road Freight Transport Market Report Scope
Agriculture, Fishing, and Forestry, Construction, Manufacturing, Oil and Gas, Mining and Quarrying, Wholesale and Retail Trade, Others are covered as segments by End User Industry. Domestic are covered as segments by Destination. Full-Truck-Load (FTL), Less than-Truck-Load (LTL) are covered as segments by Truckload Specification. Containerized, Non-Containerized are covered as segments by Containerization. Long Haul, Short Haul are covered as segments by Distance. Fluid Goods, Solid Goods are covered as segments by Goods Configuration. Non-Temperature Controlled, Temperature Controlled are covered as segments by Temperature Control.End User Industry
| Agriculture, Fishing, and Forestry |
| Construction |
| Manufacturing |
| Oil and Gas, Mining and Quarrying |
| Wholesale and Retail Trade |
| Others |
Destination
| Domestic |
| International |
Truckload Specification
| Full-Truck-Load (FTL) |
| Less than-Truck-Load (LTL) |
Containerization
| Containerized |
| Non-Containerized |
Distance
| Long Haul |
| Short Haul |
Goods Configuration
| Fluid Goods |
| Solid Goods |
Temperature Control
| Non-Temperature Controlled |
| Temperature Controlled |
| End User Industry | Agriculture, Fishing, and Forestry |
| Construction | |
| Manufacturing | |
| Oil and Gas, Mining and Quarrying | |
| Wholesale and Retail Trade | |
| Others | |
| Destination | Domestic |
| International | |
| Truckload Specification | Full-Truck-Load (FTL) |
| Less than-Truck-Load (LTL) | |
| Containerization | Containerized |
| Non-Containerized | |
| Distance | Long Haul |
| Short Haul | |
| Goods Configuration | Fluid Goods |
| Solid Goods | |
| Temperature Control | Non-Temperature Controlled |
| Temperature Controlled |


Market Definition
- Agriculture, Fishing, and Forestry (AFF) - This end user industry segment captures the external (outsourced) logistics expenditure incurred by the AFF industry players on road freight transport service. The end user players considered are the establishments primarily engaged in growing crops, raising animals, harvesting timber, harvesting fish & other animals from their natural habitats and providing related support activities. Herein, across the value chain, Logistics Service Providers (LSPs) play a crucial role in acquisition, storage, handling, transportation, and distribution activities for the optimal & continuous flow of inputs (seeds, pesticides, fertilizers, equipment, and water) from manufacturers or suppliers to the producers and smooth flow of output (produce, agro-goods) to distributors/ consumers. This includes both termperature controlled and non-temperature controlled logistics, as and when required according to the shelf life of goods being transported or stored.
- Construction - This end user industry segment captures the external (outsourced) logistics expenditure incurred by the construction industry players, on road freight transport service. The end user players considered are the establishments primarily engaged in constructing, repairing and renovating residential & commercial buildings, infrastructure, engineering works, subdividing and developing land. Logistics Service Providers (LSPs) play a crucial role in increasing profitability of construction projects by maintaing the inventory of raw materials & equipment, time-critical supplies and by providing other value added services for effective project management.
- Containerized Road Freight Transport - The segment captures the external (outsourced) logistics expenditure incurred by the road freight transport service end users on Full-Truck-Load (FTL) services. FTL road freight transport is characterized as a full single load not combined with other shipments. It comprises of shipments (i) devoted to the goods of a single shipper (ii) taken directly from a point of origin to one or more destination points (iii) comprising of bulk mail truck transportation (iv) comprising of both Container (Full Container Load, FCL)/Non-Container trucking services (v)comprsing of goods requiring temperature controlled or non-temperature controlled transportation services (vi) comprising of bulk liquid tankering (vii) invoving trucking of waste (viii) hazardous material trucking. Related value added services (VAS) of sorting, consolidation, deconslidation are included in the other services segment of freight and logistics market.
- Export Trends and Import Trends - Overall logistics performance of an economy is positively and significantly (statistically) correlated to its trade performance (exports and imports). Hence, in this industry trend, total value of trade, major commodities/ commodity groups and the major trade partners, for the studied geography (country or region as per the scope of report) have been analysed alongside the impact of major trade/logistics infrastructure investments & regulatory environment.
- Fluid Goods - The segment captures the external (outsourced) logistics expenditure incurred by the road freight transport service end users for the transport of bulk liquids, that are often used in extraction, manufacturing, food processing, agriculture industries among others. It includes transportation of liquids like (i) Chemicals/ hazardous goods (for instance acids) (ii) Water (potable as well as waste) (iii) Oil and gas (upstream as well as downstream like gasoline, fuel, crude oil, or propane), (iv) Food grade bulk liquids (like milk, or juice), (v) Rubber, (vi) Agrichemical products, among others. These goods are generally transported through tanker trucking.
- Fuel Price - Fuel price spikes can cause delays and diruption for logistics service providers (LSPs), while drops in the same can result in higher short-term profitability and increased market rivalry to offer consumers with the best deals. Hence, the fuel price variations have been studied over the review period and presented along with the causes as well as market impacts.
- Full-Truck-Load (FTL) Road Freight Transport - The segment captures the external (outsourced) logistics expenditure incurred by the road freight transport service end users on Full-Truck-Load (FTL) services. FTL road freight transport is characterized as a full single load not combined with other shipments. It comprises of shipments (i) devoted to the goods of a single shipper (ii) taken directly from a point of origin to one or more destination points (iii) comprising of bulk mail truck transportation (iv) comprising of both Container (Full Container Load, FCL)/Non-Container trucking services (v)comprsing of goods requiring temperature controlled or non-temperature controlled transportation services (vi) comprising of bulk liquid tankering (vii) invoving trucking of waste (viii) hazardous material trucking. Related value added services (VAS) of sorting, consolidation, deconslidation are included in the other services segment of freight and logistics market.
- GDP Distribution by Economic Activity - Nominal Gross Domestic Product and distribution of the same, across major economic sectors in the geography studied (country or region as per scope of the report) have been studied and presented in this industry trend. As GDP is positively related to the profitability and growth of logistics industry, this data has been used in adjunction to the input-output tables/ supply-use tables for analyzing the potential major contributing sectors towards the logistics demand.
- GDP Growth by Economic Activity - Growth of Nominal Gross Domestic Product across major economic sectors, for the geography studied (country or region as per scope of the report) have been presented in this industry trend. This data has been utilized for assessing the growth of logistics demand from all the market end users (economic sectors considered here).
- Inflation - Variations in both Wholesale Price Inflation (YoY change in producer price index) and Consumer Price Inflation have been presented in this industry trend. This data has been used to assess the inflationary environment as it plays a vital role in smooth functioning of the supply chain, directly impacting the logistics operational cost components e.g., pricing of tyres, driver wages & benefits, energy/fuel prices, maintenace costs, toll charges, warehousing rents, custom brokerage, forwarding rates, courier rates etc. hence impacting the overall freight and logistics market.
- Key Industry Trends - The report section named "Key Industry Trends" include all the key variables/parameters studied to better analyze the market size estimates and forecasts. All the trends have been presented in the form of data points (time series or latest available data points) along with analysis of the paramter in the form of concise market relevant commentary, for the geography studied (country or region as per the scope of report).
- Key Strategic Moves - The action taken by a company to differentiate from its competitor or used as a general strategy is referred to as a key strategic move (KSM). This includes (1) Agreements (2) Expansions (3) Financial Restructuring (4) Mergers and Acquisitions (5) Partnerships, and (6) Product Innovations. Key players (Logistics Service Providers, LSPs) in the market have been shortlisted, their KSM have been studied and presented in this section.
- Less than-Truck-Load (LTL) Road Freight Transport - The segment captures the external (outsourced) logistics expenditure incurred by the road freight transport service end users on Less than-Truck-Load (LTL) services. LTL road freight transport is characterized as multiple shipments combined onto a single truck for multiple deliveries within a network. It comprises of establishments (i) primarily engaged in general and specialized freight trucking of less than complete truck-loads, (ii) characterized by the use of terminals to consolidate shipments, generally from several shippers, into a single truck for haulage between a load assembly terminal and a disassembly terminal, where the load is sorted and shipments are re-routed for delivery (iv) Less than-Container-Load (LCL) shipping/ Groupage Shipping in case of trucking services. The activities in scope include (i) local pick-up, (ii) line-haul, and (iii) local delivery. Related value added services (VAS) of sorting, consolidation, deconslidation are included in the other services segment of freight and logistics market.
- Logistics Performance - Logistics Performance and Logistics Costs are the backbone of trade, and influences trade costs, making countries compete globally. Logistics performance is influenced by market wide adopted supply chain management strategies, government services, investments & policies, fuel/ energy costs, inflationary environment etc. Hence, in this industry trend, the logistics performance of the geography studied (country/ region as per the scope of report) has been analysed and presented over the review period.
- Major Truck Suppliers - Market share of truck brands is influenced by factors like geographical preferences, portfolio of truck types, truck prices, local production, truck repair & maintenance service peneteration, customer support, technological innovations (like electric vehicles, digitalization, autonomous trucks), fuel efficiency, financing options, annual maintenance costs, availability of substitutes, marketing startegies etc. Hence, the distribution (share % for base year of the study) of truck sales volume for leading truck brands and commentary on current market scenario & market anticipation over the forecast period have been presented in this industry trend.
- Manufacturing - This end user industry segment captures the external (outsourced) logistics expenditure incurred by the Manufacturing industry players, on road freight transport service. The end user players considered are the establishments primarily engaged in the chemical, mechanical or physical transformation of materials or substances into new products. Logistics Service Providers (LSPs) play a crucial role in maintaining a smooth flow of raw materials across the supply chain, enabling timely delivery of finished goods to distributors or end customers and storing & supplying the raw materials to clients for just-in-time manufacturing.
- Modal Share - Freight Modal Share is influenced by factors like modal productivity, government regulations, containerization, distance of shipment, temperature control requirements, type of goods, international trade, terrain, speed of delivery, shipment weight, bulk shipments, etc. Also, modal share by tonnage (tons) and modal share by freight turnover (ton-km) differ as per average distance of shipments, weight of major commodity groups transported in the economy and number of trips. This industry trend represents the distribution of freight transported by mode of transport (tons as well as ton-km), for the study base year.
- Oil and Gas, Mining and Quarrying - This end user industry segment captures the external (outsourced) logistics expenditure incurred by the extraction industry players, on road freight transport service. The end user players considered are the establishments that extract naturally occurring mineral solids, such as coal and ores; liquid minerals, such as crude petroleum; and gases, such as natural gas. Logistics Service Providers (LSPs) covers entire phases from upstream to downstream and plays a crucial role in the transportation of machinery, drilling equipments, extracted minerals, crude oil & natural gas and refined/ processed products from one place to another.
- Other End Users - Other end user segment captures the external (outsourced) logistics expenditure incurred by the financial services (BFSI), real estate, educational services, healthcare, and professional services (administrative, waste management, legal, architectural, engineering, design, consulting, scientific R&D), on road freight transport service. Logistics Service Providers (LSPs) plays a crucial role in the reliable movement of supplies and documents to/from these industries such as transporting any equipment or resources required, shipping confidential documents and files, movement of medical goods & supplies (surgical supplies and instruments, including gloves, masks, syringes, equipment) to name a few.
- Producer Price Inflation - It indicates inflation from viewpoint of the producers viz. the average selling price received for their output over a period of time. Annual change (YoY) of producer price index is reported as wholesale price inflation in the "Inflation" industry trend. As WPI captures dynamic price movements in most comprehensive way, it is widely used by governments, banks, industry, business circles and is deemed important in formulation of trade, fiscal and other economic policies. The data has been used in adjunction to consumer price inflation for better understanding the inflationary environment.
- Road Freight Pricing Trends - Freight pricing by mode of transport (USD/tonkm), over the review period, has been presented in this industry trend. The data has been used in assessing the inflationary environment, impact on trade, freight turnover (tonkm), road freight transport market demand and hence the road freight transport market size.
- Road Freight Tonnage Trends - Freight tonnage (weight of goods in tons) handled by mode of transport, over the review period, has been presented in this industry trend. The data has been used as one of the parameters apart from average distance per shipment (km), freight volume (tonkm), and freight pricing (USD/tonkm) to assess the freight transport market size.
- Road Freight Transport - Hiring a road freight transport logistics service provider (LSP) or haulier (outsourced logistics), for the transport of commodities constitutes road freight transport market. The scope of study includes (i) road transport of goods reported by hauliers registered in the reporting countries (ii) transport of raw materials or manufactured goods (solids as well as fluids) (iii) transport using commerical motor vehicles (rigid trucks or tractor-trailers, (iv) Full-Truck-Load (FTL) or Less than-Truck-Load (LTL) transport (v) containerized or non-containerized transport (vi) temperature controlled or non-temperature controlled trasnport, (vii) short haul or long haul (Over-the-road, OTR) transport, (viii) used office or household goods transport (movers and packers), (ix) other specialized cargo transport (dangerous goods, oversized cargo) and (x) outsourced first mile/ middle mile/last mile delivery shipments undertaken by road freight transport players. The scope does not include (i) transport undertaken by hauliers registered in other countries (ii) last mile meal delivery market (iii) grocery delivery market (iv) transportation via road network undertaken/ reported by Courier, Express, and Parcel (CEP) players.
- Road Length - As infrastructure plays a vital role in an economy's logistics performance, variables like length of roads, distribution of road length by surface category (paved v/s unpaved), distribution of road length by road classification (expressways v/s highways v/s other roads), have been analysed and presented in this industry trend.
- Segmental Revenue - Segmental Revenue has been triangulated or computed and presented for all the major players in the market. It refers to the road freight transport market specific revenue earned by the company, over the base year of study, in the geography studied (country or region as per the scope of report). It is computed through the study and analysis of major parameters like financials, service portfolio, employee strength, fleet size, investments, number of countries present in, major economies of concern, etc. that have been reported by the company in its annual reports, webpage. For companies having scarce financial disclosures, paid databases like D&B Hoovers, Dow Jones Factiva have been resorted to and verified through industry/expert interactions.
- Short Haul Road Freight Transport - The segment captures the external (outsourced) logistics expenditure incurred by the road freight transport service end users on local trucking (less than 100 miles). It includes the road transport of goods (i) within a single administrative area and its hinterland, (ii) by smaller trucks and pickup trucks (iii) via containerized as well as dry bulk services (iv) intermodal from ports, container terminals or airports, and (v) outsourced first mile/ last mile delivery shipments undertaken by road freight transport players.
- Transport and Storage Sector GDP - Value and growth of Transport and Storage Sector GDP has a direct relation to the freight and logistics market size, and hence road freight transport market size. Therefore, this variable has been studied and presented over the review period, in value terms (USD) and as share % of total GDP, in this industry trend. The data has been supported by concise and relevant commentary around the investments, developments, and current market scenario.
- Trends in E-Commerce Industry - Enhanced internet connectivity and boom in smartphone penetration, coupled with increasing disposable incomes, has led to a phenomenal growth in the e-commerce market globally. Online shoppers require fast and efficient delivery of their orders leading to an increase in the demand for logistics services especially e-commerce fulfilment services. Hence, the Gross Merchandise Value (GMV), historial and projected growth, breakup of major commodity groups in e-commerce industry for the studied geography (country or region as per scope of the report) have been analysed and presented in this industry trend.
- Trends in Manufacturing Industry - Manufacturing industry involves the transformation of raw materials into finished products, while logistics industry ensures the efficient flow of raw materials to the factory, and the transport of manufactured products to the distributors & consumers. Demand-Supply of both industries are highly cross-linked and critical for a seamless supply chain. Hence, the Gross Value Added (GVA), breakup of GVA into major manufacturing sectors, and growth of manufacturing industry over the review period have been analysed and presented, in this industry trend.
- Trucking Fleet Size By Type - Market share of truck types is influenced by factors like geographical preferences, major end user industries, truck prices, local production, truck repair & maintenance service peneteration, customer support, technological disruptions (like electric vehicles, digitalization, autonomous trucks) etc. Hence, the distribution (share % for base year of study) of truck parc volume by type of truck, market disruptors, truck manufacturing investments, truck specifications, truck use & import regulations, and market anticipation over the forecast period have been presented in this industry trend.
- Trucking Operational Costs - The prime reasons for measuring/ benchmarking logistics performance of any trucking company are to reduce operational costs and increase profitability. On the other hand, measuring operational costs helps to identify whether and where to make operational changes to control expenses and identify areas for improved performance. Hence, in this industry trend, trucking operational costs and the variables involved viz. driver wages & benefits, fuel prices, repairs & maintenance costs, tyre costs etc. have been studied over the base year of study, and presented for the geography studied (country or region as per the scope of report).
- Wholesale and Retail Trade - This end user industry segment captures the external (outsourced) logistics expenditure incurred by the wholesalers and retailers, on road freight transport service. The end user players considered are the establishments primarily engaged in wholesaling or retailing merchandise, generally without transformation, and rendering services incidental to the sale of merchandise. Logistics Service Providers (LSPs) plays a crucial role in the reliable movement of supplies to and finished products from production houses to the distributors and finally to the end customer covering activites like material sourcing, transportation, order fulfillment, warehousing & storage, demand forecasting, inventory management etc.
| Keyword | Definition |
|---|---|
| Cabotage | Road transport by a motor vehicle registered in a country performed on the national territory of another country. |
| Cross Docking | Cross docking is a logistics procedure where products from a supplier or manufacturing plant are distributed directly to a customer or retail chain with marginal to no handling or storage time. Cross docking takes place in a distribution docking terminal; usually consisting of trucks and dock doors on two (inbound and outbound) sides with minimal storage space. The name ‘cross docking’ explains the process of receiving products through an inbound dock and then transferring them across the dock to the outbound transportation dock. |
| Cross Trade | International road transport between two different countries performed by a road motor vehicle registered in a third country. A third country is a country other than the country of loading/embarkation and than the country of unloading/disembarkation. |
| Dangerous Goods | The classes of dangerous goods carried by Road are those defined by the fifteenth revised edition of the UN Recommendations on the Transport of Dangerous Goods, United Nations, Geneva 2007. They include Class 1: Explosives; Class 2: Gases; Class 3: Flammable Liquids; Class 4: Flammable solids- substances liable to spontaneous combustion; substances which, on contact with water, emit flammable gases; Class 5: Oxidizing substances and organic peroxides; Class 6: Toxic and infectious substances; Class 7: Radioactive material and Class 8: Corrosive substances, Class 9: Miscellaneous dangerous substances and articles. |
| Direct Shipment | Direct shipment is a method of delivering goods from the supplier or the product owner to the customer directly. In most cases, the customer orders the goods from the product owner. This delivery scheme reduces transportation and storage costs, but requires additional planning and administration. |
| Drayage | A drayage is a form of trucking service that connects the different modes of shipping (intermodal), such as ocean freight or air freight. It’s a short-haul trip that transports goods from one place to another, usually before or after its long-haul shipping process. Drayage trucks move cargo to and from various destinations, such as container ships, storage lots, order fulfillment warehouses, and rail yards. Typically, drayage only transports goods in short distances and operates only in one metropolitan area. It also requires only one trucker in a single shift. But despite this, but it plays an important role in long-haul shipping because it gets the goods to the cargo and vice versa. It makes intermodal transport much more efficient and enables the seamless transfer of goods to the end customer. |
| Dry van | A dry van is a type of semi-trailer that's fully enclosed to protect shipments from outside elements. Designed to carry palletized, boxed or loose freight, dry vans aren't temperature-controlled (unlike refrigerated “reefer” units) and can't carry oversized shipments (unlike flatbed trailers). |
| Final Demand | Final demand includes all types of commodities (goods as well as services) consumed as final use and might include personal consumption, or consumption by government, by businesses as capital investment, and as exports. includes all types of commodities (goods as well as services) consumed as final use and might include personal consumption, or consumption by government, by businesses as capital investment, and as exports. |
| Flatbed Truck | A flatbed truck is a type of truck with rigid design. It has a back body that is flatly shaped for easy loading and unloading of goods. The flatbed truck is mostly used to transport heavy, oversized, wide and indelicate goods such as machinery, building supplies or equipment. Due to the truck open body, the goods transported with it must not be vulnerable to rain. By functionality, the flatbed truck is comparable to a flatbed trailer. |
| Inbound Logistics | Inbound logistics is the way materials and other goods are brought into a company. This process includes the steps to order, receive, store, transport and manage incoming supplies. Inbound logistics focuses on the supply part of the supply-demand equation. |
| Intermediate Demand | Intermediate demand includes goods, services, and maintenance and repair construction sold to businesses, excluding capital investment. |
| International Loaded | Place of loading of goods in reporting country (i.e., country in which the vehicle performing the transport is registered) and place of unloading in a different country. |
| International Unloaded | Place of unloading of goods in reporting country (i.e., country in which the vehicle performing the transport is registered) and place of loading in a different country. |
| OOG cargo | Out of Gauge (OOG) cargo is any cargo that can not be loaded into six-sided shipping containers simply because it is too large. The term is a very loose classification of all cargo with dimensions beyond the maximum 40HC container dimensions. That is a length beyond 12.05 meters – a width beyond 2.33 meters – or a height beyond 2.59 meters. |
| Pallets | Raised platform, intended to facilitate the lifting and stacking of goods. |
| Part load | A part load describes goods which only fills a truck partially. In essence, the quantity of the shipment is bigger than the Less Than Truckload (LTL) shipment. Also, the shipment cannot fully occupy a truck i.e. its capacity is much lower than a Full Truckload (FTL) shipment. |
| Paved Road | Road surfaced with crushed stone (macadam) with hydrocarbon binder or bituminized agents, with concrete or with cobblestone. |
| Reverse Logistics | Reverse logistics comprises of the sector of supply chains that process anything returning inwards through the supply chain or traveling ‘backward’ through the supply chain. |
| Road Freight Transport Service | Hiring a trucking agency for transport of commodities (raw materials or manufactured goods including both solids and liquids) form the origin to a destination within the country (domestic) or cross-border (international) constitutes road freight transport market. The service might be Full-Truck-Load or Less than-Truck-Load, containerized or non-containerized, temperature controlled or non temperature controlled, short haul or long haul. |
| Tautliner vehicle | Tautliner and curtainsider are used as generic names for curtain sided trucks/trailers. The curtains are permanently fixed to a runner at the top and detachable rails/poles at front and rear, allowing the curtains to be drawn open and forklifts used all along the sides for easy and efficient loading and unloading. When closed for travel, vertical load restraint straps are attached to a rope rail beneath the truck bed, connecting the truck bed and curtain along both sides. Winches at either end of the curtain tension it, hence the 'Tautliner' name. This stops the curtain from flapping or drumming in the wind and can also help retain light loads from slipping sideways. |
| Transport for hire or reward | The carriage for remuneration of goods. |
| Unpaved Road | Road with a stabilized base not surfaced with crushed stone, hydrocarbon binder or bituminized agents, concrete or cobblestone. |


Research Methodology
Mordor Intelligence follows a four-step methodology in all our reports.
- Step-1: Identify Key Variables: In order to build a robust forecasting methodology, the variables and factors identified in Step-1 are tested against available historical market numbers. Through an iterative process, the variables required for market forecast are set and the model is built on the basis of these variables.
- Step-2: Build a Market Model: Market-size estimations for the forecast years are in nominal terms. Inflation is considered to be a part of the pricing, and the average selling price (ASP) is varying throughout the forecast period for each country
- Step-3: Validate and Finalize: In this important step, all market numbers, variables and analyst calls are validated through an extensive network of primary research experts from the market studied. The respondents are selected across levels and functions to generate a holistic picture of the market studied.
- Step-4: Research Outputs: Syndicated Reports, Custom Consulting Assignments, Databases & Subscription Platforms


