Market Overview
| Study Period | 2021 - 2031 |
|---|---|
| Forecast Data Period | 2026 - 2031 |
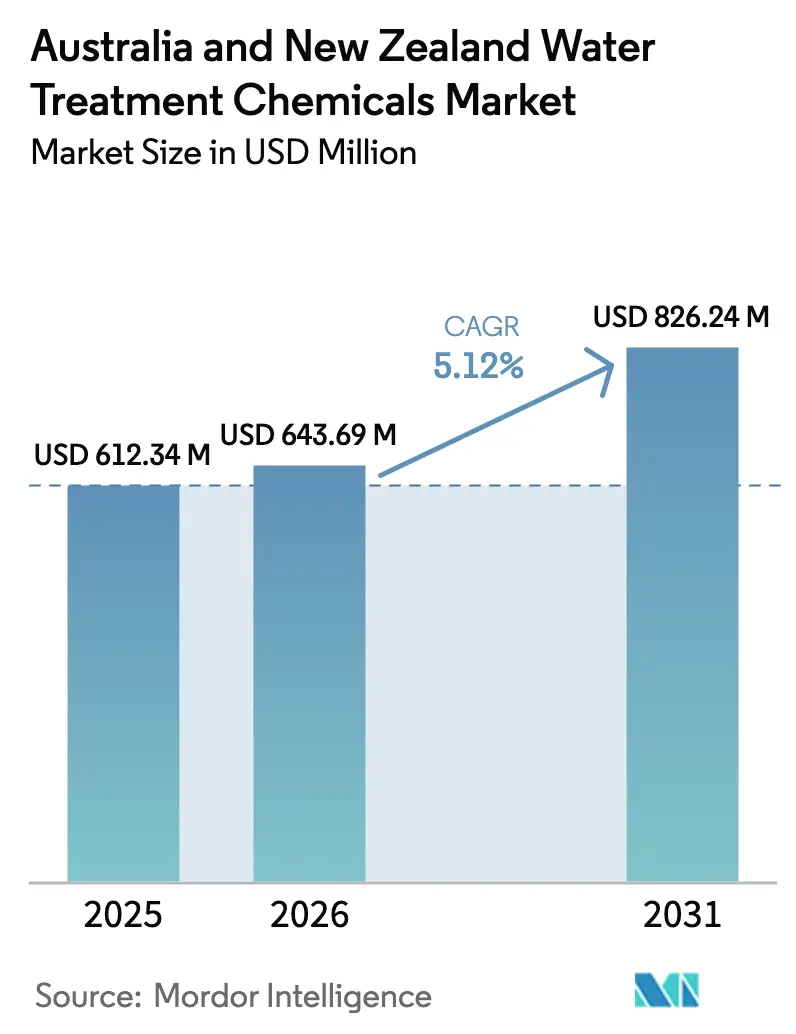
| Base Year Market Size (2025) | USD 612.34 Million |
| Market Size (2026) | USD 643.69 Million |
| Market Size (2031) | USD 826.24 Million |
| Growth Rate (2026 - 2031) | 5.12% CAGR |
| Market Concentration | Medium |
Major Players *Disclaimer: Major Players sorted in no particular order Image © Mordor Intelligence. Reuse requires attribution under CC BY 4.0. | |
Australia And New Zealand Water Treatment Chemicals Market Analysis by Mordor Intelligence
The Australia And New Zealand Water Treatment Chemicals Market size is expected to increase from USD 612.34 million in 2025 to USD 643.69 million in 2026 and reach USD 826.24 million by 2031, growing at a CAGR of 5.12% over 2026-2031. Stricter PFAS regulations, the ANZECC 2023 discharge framework, and the hydrogen economy's demand for ultrapure water are influencing portfolios toward specialty coagulants, phosphorus-free antiscalants, and digital dosing technologies. Membrane and ultraviolet (UV) systems are increasingly replacing chlorine in municipal disinfection processes. However, higher doses of polymers and ferric chloride required for PFAS removal are increasing chemical usage per megaliter. In Australia, desalination and mining activities drive chemical volumes, while New Zealand experiences faster growth due to UV retrofits, which necessitate post-UV stabilization chemistry. Suppliers that integrate local blending capabilities with predictive analytics are gaining a competitive edge as end-users focus on regulatory compliance and optimizing the total cost of ownership.
Key Report Takeaways
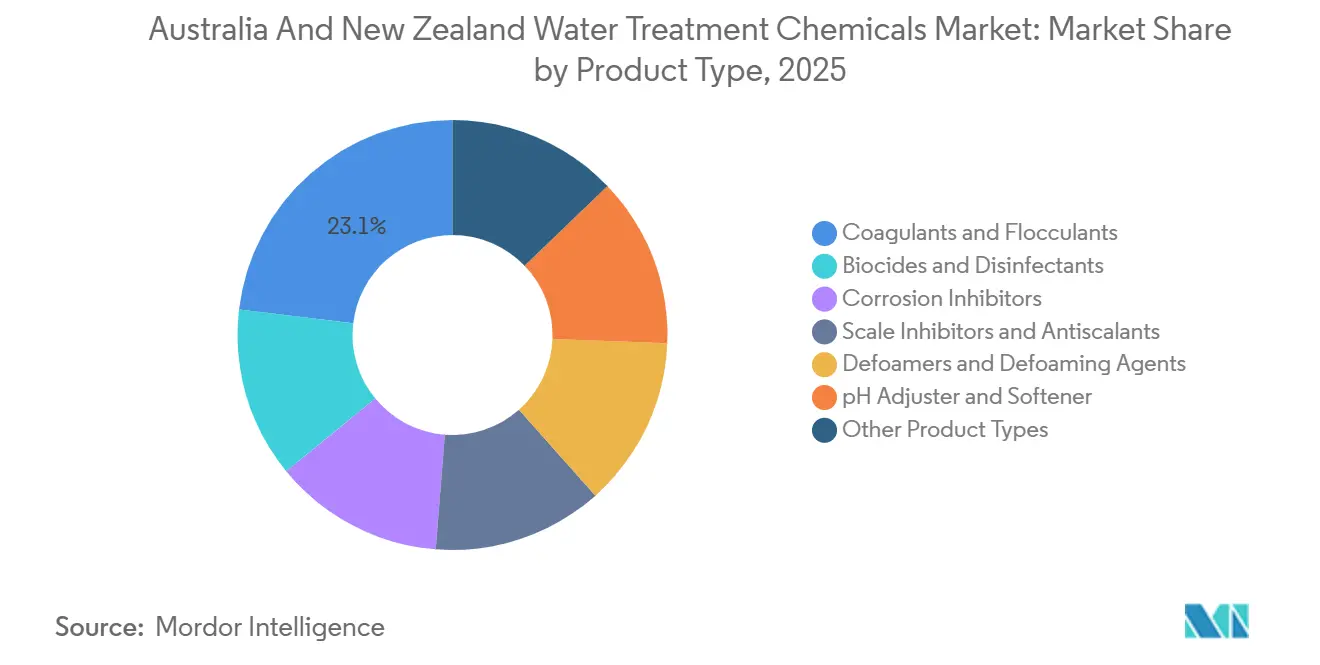
- By product type, coagulants and flocculants led with 23.11% of the water treatment chemicals market share in 2025 and are forecast to expand at a 5.96% CAGR through 2031.
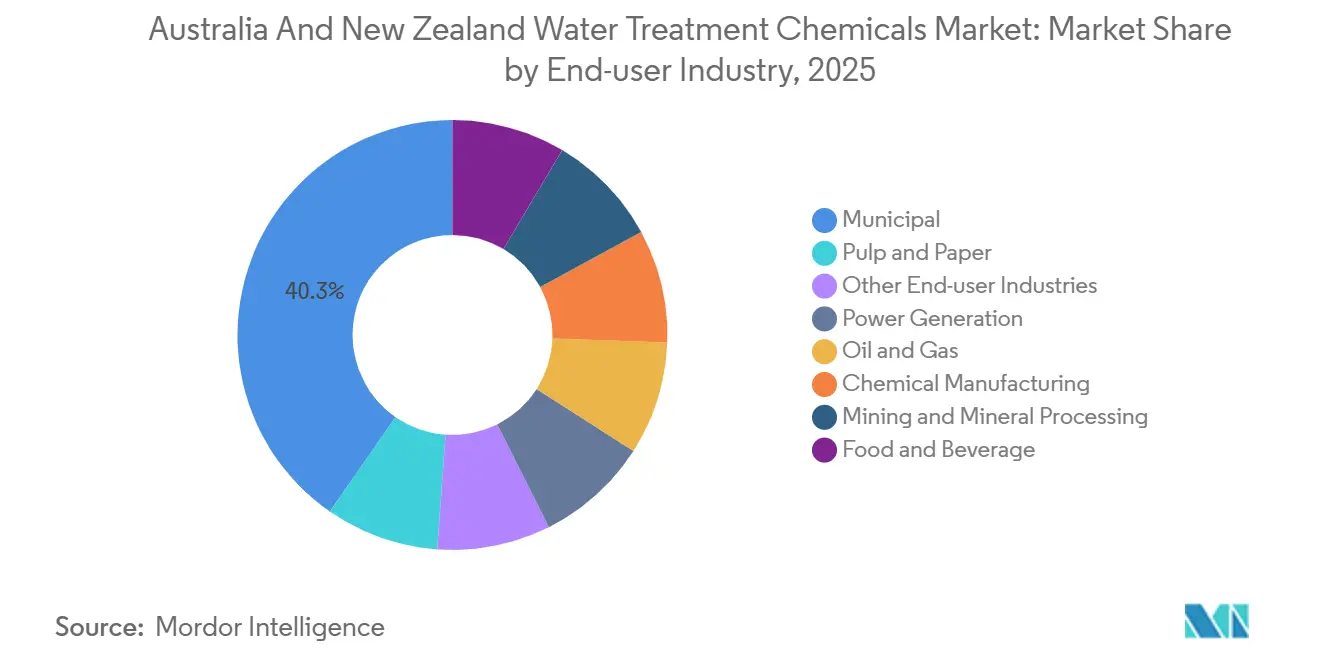
- By end-user industry, the municipal segment accounted for 40.34% share of the water treatment chemicals market size in 2025 and is projected to advance at a 5.82% CAGR through 2031.
- By geography, Australia accounted for 83.11% share of the water treatment chemicals market size in 2025, while New Zealand is projected to advance at a 5.41% CAGR through 2031.
Note: Market size and forecast figures in this report are generated using Mordor Intelligence’s proprietary estimation framework, updated with the latest available data and insights as of 2026.
Australia And New Zealand Water Treatment Chemicals Market Trends and Insights
Drivers Impact Analysis*
| Driver | (~) % Impact on CAGR Forecast | Geographic Relevance | Impact Timeline |
|---|---|---|---|
| Growing water-intensive industrial and power demand | +0.9% | Australia (Western Australia mining belt, Queensland LNG corridor) | Medium term (2-4 years) |
| Stricter wastewater-discharge licensing under ANZECC 2023 | +1.2% | Australia and New Zealand (national, with early enforcement in Victoria, Canterbury regions) | Short term (≤ 2 years) |
| Mandated PFAS removal standards boosting specialty coagulants | +1.4% | Australia (national, concentrated in NSW, Victoria, South Australia) | Short term (≤ 2 years) |
| Hydrogen-electrolyzer build-out demanding ultrapure make-up water | +0.6% | Australia (Pilbara, Hunter Valley hydrogen hubs) | Long term (≥ 4 years) |
| Desalination-asset life-extension needs for digital antiscalants | +0.8% | Australia (Perth, Adelaide, Sydney, Gold Coast plants) | Medium term (2-4 years) |
| Source: Mordor Intelligence | |||
Growing Water-Intensive Industrial and Power Demand
Mining and LNG operations in Western Australia and Queensland are driving higher process-water volumes, leading to increased consumption of coagulants, flocculants, and corrosion inhibitors. For instance, Newmont’s Cadia Valley Operations reused 68% of water in 2024, but the remaining flow still required ferric sulfate and phosphonate inhibitors. CSIRO pilot trials demonstrated that hybrid forward- and reverse-osmosis brine streams require up to 5 ppm of anionic polyacrylamide for tailings dewatering. Coal-fired units in New South Wales and Queensland use bromine oxidizers and zinc-phosphate blends to manage cycles of concentration exceeding five. Geothermal plants in New Zealand employ customized silica dispersants to control precipitation at 180 °C. Industrial applications consume two to three times more chemicals per megaliter than municipal systems, meaning a 4% increase in mining water throughput could raise specialty chemical demand by up to 10%.
Stricter Wastewater-Discharge Licensing Under ANZECC 2023
The ANZECC 2023 update introduced stricter numeric limits for nutrients and trace metals, compelling utilities to enhance dosing regimes[1]ANZECC, “2023 Water Quality Guidelines,” anzecc.gov.au. Sydney Water’s 2026 tender specifies ferric chloride and polyaluminum chlorhydrate for nutrient co-precipitation, with quarterly compliance audits. In 2025, Te Awamutu added alum to meet Waikato phosphorus caps, increasing annual chemical expenditure by NZD 150,000. Older plants built before 2010 lack automated pH control, necessitating retrofits that accelerate chemical-infrastructure investments. Victoria’s regulator has indicated tighter phosphorus limits by 2028, ensuring sustained demand for iron- and aluminum-based coagulants.
Mandated PFAS Removal Standards Boosting Specialty Coagulants
Australia’s 2025 NHMRC guideline limits PFOS+PFOA to 70 ng/L, while NEMP 3.0 mandates remediation of contaminated sites by 2027. Hydroflux’s 2025 PFAS-removal plant employs granular activated carbon, ion exchange, and ferric-chloride coagulation to achieve sub-10 ng/L effluent levels. Ferric salts at pH 8.5 enable co-precipitation of short-chain PFAS but increase sludge volume by 40%, raising polymer-dewatering costs. High-basicity PAC and polyaluminum-ferric hybrids reduce sludge and enhance cold-water flocculation, justifying 20-30% price premiums. Compliance deadlines in 2026 are accelerating procurement, concentrating demand that would otherwise spread over a decade.
Hydrogen-Electrolyzer Build-Out Demanding Ultrapure Make-Up Water
Green-hydrogen hubs in Pilbara and Hunter Valley require 9-11 liters of ultrapure water per kilogram of hydrogen, necessitating reverse-osmosis, electrodeionization, and mixed-bed ion exchange processes. These stages consume sulfuric acid, caustic soda, antiscalants, and regeneration chemicals. A 100 MW electrolyzer producing approximately 15 tons of hydrogen daily uses 0.3-0.8 kg of antiscalant per day. Projects located near high-salinity water sources experience higher antiscalant dosages and frequent citric-acid membrane cleaning. Low-phosphorus PASP and PESA chemistries are gaining traction as discharge permits become more stringent.
Restraints Impact Analysis*
| Restraint | (~) % Impact on CAGR Forecast | Geographic Relevance | Impact Timeline |
|---|---|---|---|
| Membrane/UV displacement of chemical disinfection | -0.7% | New Zealand (national), Australia (Victoria, South Australia municipal utilities) | Short term (≤ 2 years) |
| Supply-chain exposure to Chinese glyphosate intermediates | -0.4% | Australia and New Zealand (importers of phosphonate antiscalants, corrosion inhibitors) | Medium term (2-4 years) |
| Impending phosphorus caps curbing phosphonate antiscalants | -0.5% | Australia (sensitive catchments in Victoria, Tasmania, South Australia) | Medium term (2-4 years) |
| Source: Mordor Intelligence | |||
Membrane/UV Displacement of Chemical Disinfection
Between 2024 and 2025, fifteen New Zealand plants adopted UV systems, reducing hypochlorite usage by up to 70%[2]Taumata Arowai, “Drinking Water Rules,” taumataarowai.govt.nz. Greater Western Water’s Myrniong upgrade eliminated 40 tons per year of hypochlorite and reduced trihalomethanes by 60%. Membrane bioreactors (MBRs) at Wellsford and Paeroa decreased alum demand by 30-40%. While UV systems still require pH adjusters and a small chlorine residual, the overall effect is a reduction in biocide demand for smaller utilities receiving central funding.
Impending Phosphorus Caps Curbing Phosphonate Antiscalants
Draft regulations in Victoria and Tasmania aim to lower effluent phosphorus levels below 0.02 mg/L, effectively prohibiting phosphonate antiscalants. PASP and PESA comply with these limits but are twice as expensive and less tolerant of high calcium hardness. Pilot studies in South Australia indicate 10-15% higher fouling rates with phosphorus-free products, limiting adoption to below 10% until the rules are finalized in 2027-2028.
*Our forecasts treat driver/restraint impacts as directional, not additive. The impact forecasts reflect baseline growth, mix effects, and variable interactions.
Segment Analysis
By Product Type: Coagulants Lead on PFAS and Turbidity Mandates
Coagulants and flocculants accounted for 23.11% of revenue in 2025, representing the largest share of the water treatment chemicals market. This segment is projected to grow at a CAGR of 5.96% through 2031, driven by increasing PFAS removal requirements and DAF retrofits, which are leading to more frequent dosing events. For instance, the Mardi Water Treatment Plant transitioned from alum to ferric chloride following a USD 50 million upgrade, reducing dosage by 12% while improving turbidity removal. HydraBOND and HydraPRIME polymers are designed for sediment basins and mine-water clarification, achieving flocculation in under 60 seconds. While biocides face challenges from UV treatment technologies, they remain essential for maintaining cooling-tower residuals. Phosphorus-free antiscalants are gaining adoption in desalination applications, though their higher costs have slowed full-scale replacement. Specialty coagulants are enhancing cold-water floc settling in New Zealand’s South Island, reflecting climate-driven adjustments in formulations. The market size for coagulants is expected to grow steadily as regulatory compliance increases dosing intensity rather than throughput.
Demand for corrosion inhibitors, defoamers, and pH adjusters is closely tied to industrial cycles. Zinc-phosphate blends are effective in protecting cooling systems operating above five cycles of concentration, while amine-based filming inhibitors safeguard condensate lines in LNG plants. Vital Chemical’s bio-polymer flocculant recently received approval from the Infrastructure Sustainability Council, indicating a preference for products with lower life-cycle emissions. Defoamers and pH adjusters remain commoditized but are critical for applications such as pulp-and-paper water closure and clean-in-place processes. Overall, growth at the product level is driven more by regulatory-led chemistry substitutions than by volume expansion, favoring suppliers with strong R&D capabilities.


By End-user Industry: Municipal Dominates, Mining Offers Margin
The municipal sector held 40.34% of the water treatment chemicals market share in 2025 and is expected to grow at a CAGR of 5.82% through 2031. Projects such as Sydney Water’s Orchard Hills and Central Coast’s Mardi upgrades are incorporating higher-concentration ferric and polyaluminum chloride, supported by multi-year supply contracts. Wellington Water issued a NZD 10-25 million bulk-chemicals tender for its 160 ML/d network, demonstrating the predictable, policy-driven nature of municipal demand. Aging infrastructure from the 1970s struggles to accommodate modern formulations, prompting chemical storage retrofits that strengthen relationships with incumbent suppliers.
In mining and mineral processing, high volumes of anionic polyacrylamide flocculants are used at concentrations of 1-5 ppm, delivering attractive gross margins of 15-25% despite fluctuations in commodity prices. Clean TeQ Water’s ATA pilot at the Prominent Hill mine has achieved 70% solids in tailings, significantly reducing dam footprints. The power generation sector relies on bromine oxidizers and oxygen scavengers for cooling and boiler circuits, with companies like Ecolab and Spirax Sarco leading through bundled service offerings. In the oil and gas industry, demand is centered on produced-water treatment to achieve offshore oil-in-water levels below 20 ppm. Food and beverage facilities are increasingly integrating membrane cleaning and clean-in-place detergents, particularly following Solenis’s acquisition of Diversey. The growth of the water treatment chemicals market is thus characterized by steady municipal demand combined with higher-margin opportunities in industrial applications.
Geography Analysis
Australia accounted for 83.11% of 2025 revenue, driven by its population of 25 million, five large seawater reverse osmosis (RO) plants, and the high water intensity of its resource sector. Sydney Water’s supply capacity of 1,600 ML/d and Melbourne Water’s 400 ML/d network underpin significant demand for coagulation and disinfection chemicals. In Western Australia’s mining region, 68% of water is recycled, yet ferric sulfate and polyacrylamide are still used to process residual streams. Queensland’s liquefied natural gas (LNG) projects near Gladstone require ultrapure water for boilers, increasing the consumption of antiscalants and corrosion inhibitors. Adelaide’s desalination expansion has raised antiscalant demand by 15 tons annually and accelerated the adoption of digital dosing systems. Meanwhile, Tasmania and South Australia are preparing for phosphorus caps, which are expected to shift antiscalant formulations away from phosphonates.
New Zealand is projected to achieve the fastest compound annual growth rate (CAGR) of 5.41% through 2031, driven by Taumata Arowai’s enforcement of pathogen-log targets. UV retrofits in areas such as Ashburton, Cromwell, and smaller rural schemes have reduced hypochlorite usage but increased demand for pH adjusters. Raglan’s deployment of DuPont MemPulse MBR and OxyMem MABR systems in 2025 reduced aeration energy consumption by 50% and achieved total nitrogen levels below 10 mg/L, demonstrating the effectiveness of capital-light biological treatment solutions. The central government subsidizes up to 50% of project costs for small utilities, accelerating adoption. Bulk tenders in Auckland and Wellington prioritize suppliers with inventory management capabilities and ISO-certified quality systems. The contrast between Australia’s industrial-scale operations and New Zealand’s regulatory-driven growth influences pricing, service models, and formulation strategies in the water treatment chemicals market.
Competitive Landscape
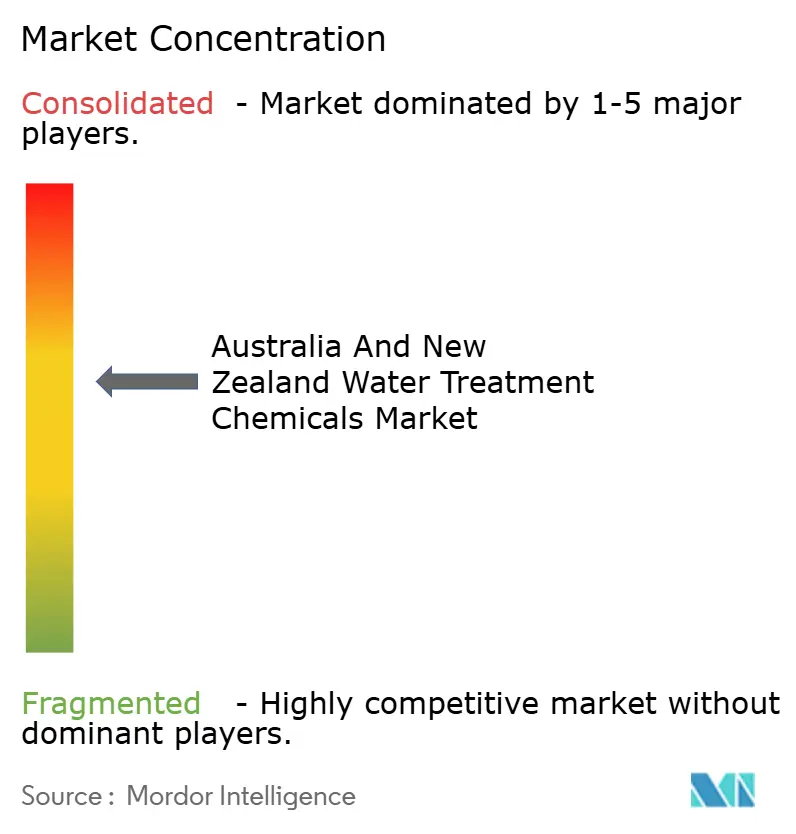
The market exhibits moderate concentration, with the top five suppliers holding a combined 61% share in 2025. Ecolab secures multiyear contracts through its 3D TRASAR digital platform, which integrates sensors and cloud analytics into the networks of Sydney Water, Melbourne Water, and Water Corporation. Switching costs are significant, exceeding 15% of annual expenditure when hardware and retraining are considered. Kemira’s 2024 acquisition of ChemSolutions has expanded its reach into pulp-and-paper chemistry, particularly in mills like Norske Skog Boyer, where enzymatic pitch control is in demand. Solenis’s acquisitions of Diversey and Veolia Water Technologies have enabled cross-selling opportunities for membrane cleaners and hygiene products in food processing plants.
Regional distributors Ixom and Hydroflux compete on proximity and customized solutions. Ixom operates warehouses across Australia and New Zealand, ensuring just-in-time delivery of ferric and hypochlorite products. Hydroflux leverages its engineering expertise to secure PFAS-removal projects that integrate membrane, ion exchange, and chemical solutions. Vital Chemical markets bio-polymer flocculants that align with sustainability-focused procurement requirements. Partnerships with Grundfos and Avista in digital dosing allow smaller players to differentiate based on total cost of ownership rather than price per kilogram. Emerging opportunities are concentrated in phosphorus-free antiscalants for desalination and hydrogen applications, where Avista and King Lee are piloting high-silica-tolerant copolymers. The water treatment chemicals market balances the scale economies of global leaders with the agility of local formulators.
Australia And New Zealand Water Treatment Chemicals Industry Leaders
Ecolab
Kemira Oyj
Solenis
SNF
Ixom
- *Disclaimer: Major Players sorted in no particular order

Recent Industry Developments
- August 2025: Researchers in Australia discovered 21 new "forever chemicals" in Sydney's tap water, including one detected in tap water globally for the first time. This discovery is expected to drive the demand for advanced water treatment chemicals to address these emerging contaminants.
- June 2025: The National Health and Medical Research Council (NHMRC) updated the Australian Drinking Water Guidelines (Version 4.0), significantly reducing health-based guideline values for PFAS to mitigate risks. This drove demand in the water treatment chemicals market as stricter limits required enhanced treatment processes.


Australia And New Zealand Water Treatment Chemicals Market Report Scope
Water treatment is a process that extracts or reduces the level of pollutants and undesirable components from water to make it suitable for use. The chemicals used in this method are referred to as water treatment chemicals.
The Australia And New Zealand Water Treatment Chemicals Market is segmented by product type, end-user industry, and geography. By product type, the market is segmented into coagulants and flocculants, biocides and disinfectants, corrosion inhibitors, scale inhibitors and antiscalants, defoamers and defoaming agents, pH adjusters and softeners, and other product types. By end-user industry, the market is segmented into municipal, power generation, oil and gas, chemical manufacturing, mining and mineral processing, food and beverage, pulp and paper, and other end-user industries. The report also covers the market sizes and forecasts for water treatment chemicals in Australia and New Zealand. For each segment, the market sizing and forecasts have been done on the basis of value (USD).
By Product Type
| Coagulants and Flocculants |
| Biocides and Disinfectants |
| Corrosion Inhibitors |
| Scale Inhibitors and Antiscalants |
| Defoamers and Defoaming Agents |
| pH Adjuster and Softener |
| Other Product Types |
By End-user Industry
| Municipal |
| Power Generation |
| Oil and Gas |
| Chemical Manufacturing |
| Mining and Mineral Processing |
| Food and Beverage |
| Pulp and Paper |
| Other End-user Industries |
By Geography
| Australia |
| New Zealand |
| By Product Type | Coagulants and Flocculants |
| Biocides and Disinfectants | |
| Corrosion Inhibitors | |
| Scale Inhibitors and Antiscalants | |
| Defoamers and Defoaming Agents | |
| pH Adjuster and Softener | |
| Other Product Types | |
| By End-user Industry | Municipal |
| Power Generation | |
| Oil and Gas | |
| Chemical Manufacturing | |
| Mining and Mineral Processing | |
| Food and Beverage | |
| Pulp and Paper | |
| Other End-user Industries | |
| By Geography | Australia |
| New Zealand |


Key Questions Answered in the Report
What is the value of the water treatment chemicals market?
The water treatment chemicals market reached USD 643.69 million in 2026 and is forecast to reach USD 826.24 million by 2031 at a 5.12% CAGR from 2026 to 2031.
Which product type is expanding the fastest through 2031?
Coagulants and flocculants are projected to grow at 5.96% CAGR through 2031, boosted by PFAS mandates and DAF retrofits.
Why is New Zealand witnessing rapid growth through 2031?
Taumata Arowai regulations and UV retrofits drive a 5.41% CAGR through 2031 for New Zealand.
How are PFAS standards influencing chemical demand?
Stricter 70 ng/L limits require specialty ferric coagulants and high-basicity PAC, increasing chemical intensity per megaliter.
Page last updated on:


