
Market Overview
| Study Period | 2020 - 2031 |
|---|---|
| Forecast Data Period | 2026 - 2031 |
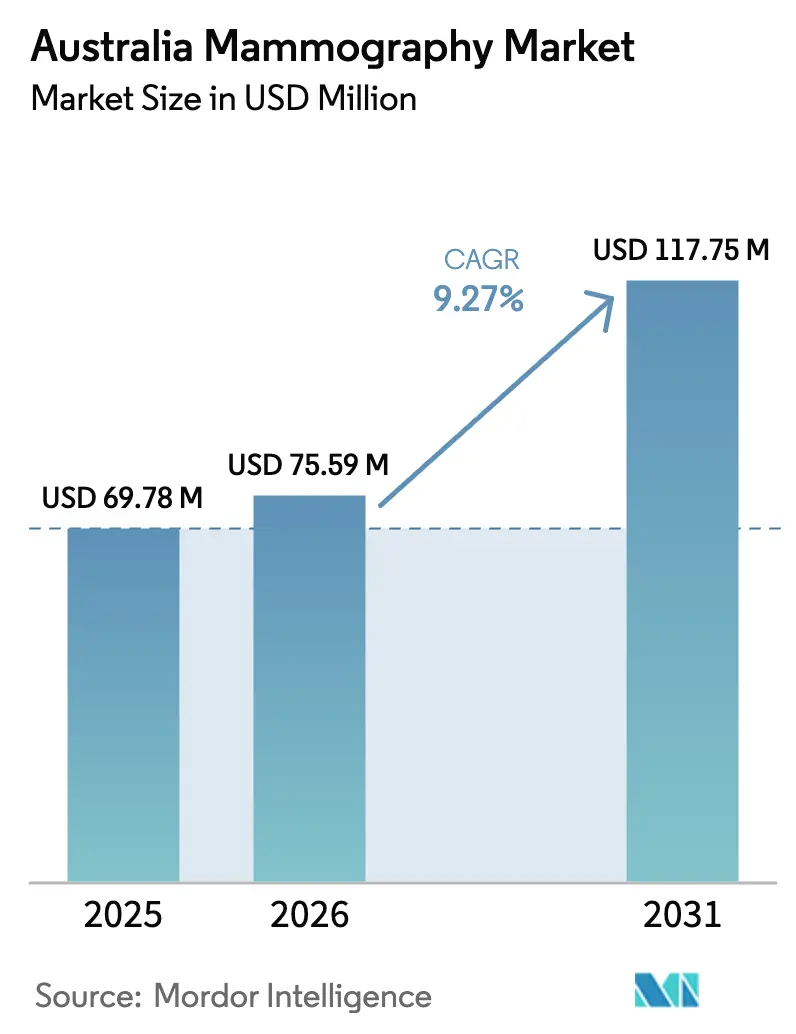
| Base Year Market Size (2025) | USD 69.78 Million |
| Market Size (2026) | USD 75.59 Million |
| Market Size (2031) | USD 117.75 Million |
| Growth Rate (2026 - 2031) | 9.27 % |
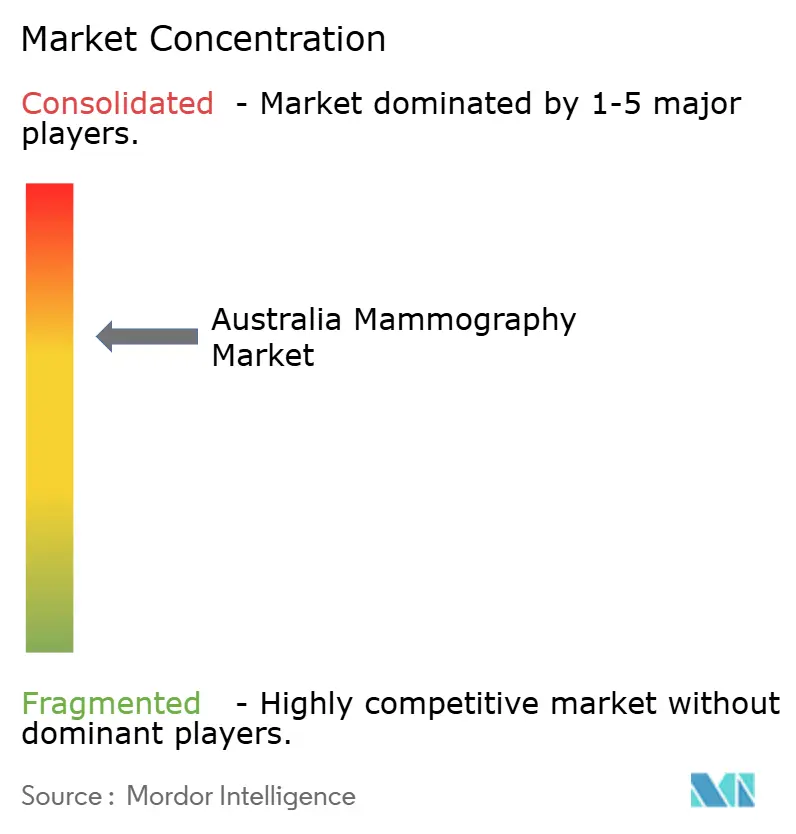
| Market Concentration | Medium |
Major Players *Disclaimer: Major Players sorted in no particular order Image © Mordor Intelligence. Reuse requires attribution under CC BY 4.0. | |
Australia Mammography Market Analysis by Mordor Intelligence
The Australia Mammography Market size is projected to expand from USD 69.78 million in 2025 and USD 75.59 million in 2026 to USD 117.75 million by 2031, registering a CAGR of 9.27% between 2026 to 2031.
Hospitals are accelerating capital spending as breast-cancer incidence rises and state participation targets tighten, yet budget limits are steering procurement toward modular upgrades rather than wholesale fleet replacement.[1]AUSTRALIAN INSTITUTE OF HEALTH AND WELFARE, “Breast Cancer in Australia,” AIHW, aihw.gov.au Vendors are responding by unbundling hardware and layering subscription AI modules that offset radiologist shortages, while reimbursement incentives linked to dense-breast imaging sustain demand for digital breast tomosynthesis (DBT) platforms.[2]AUSTRALIAN GOVERNMENT DEPARTMENT OF HEALTH AND AGED CARE, “Medicare Benefits Schedule – Diagnostic Imaging Services,” Health, health.gov.au Although November 2025 MBS rule changes narrow DBT eligibility, they simultaneously spur adoption of density-assessment software that verifies claims, creating a mixed but overall positive volume effect. Mobile-van procurements and tele-radiology contracts extend screening reach into remote regions, expanding the addressable mammography market even where on-site specialists are scarce. Quality-assurance mandates under the National Accreditation Standards 2022 compress replacement cycles for aging 2D units, adding urgency to investment decisions.
Key Report Takeaways
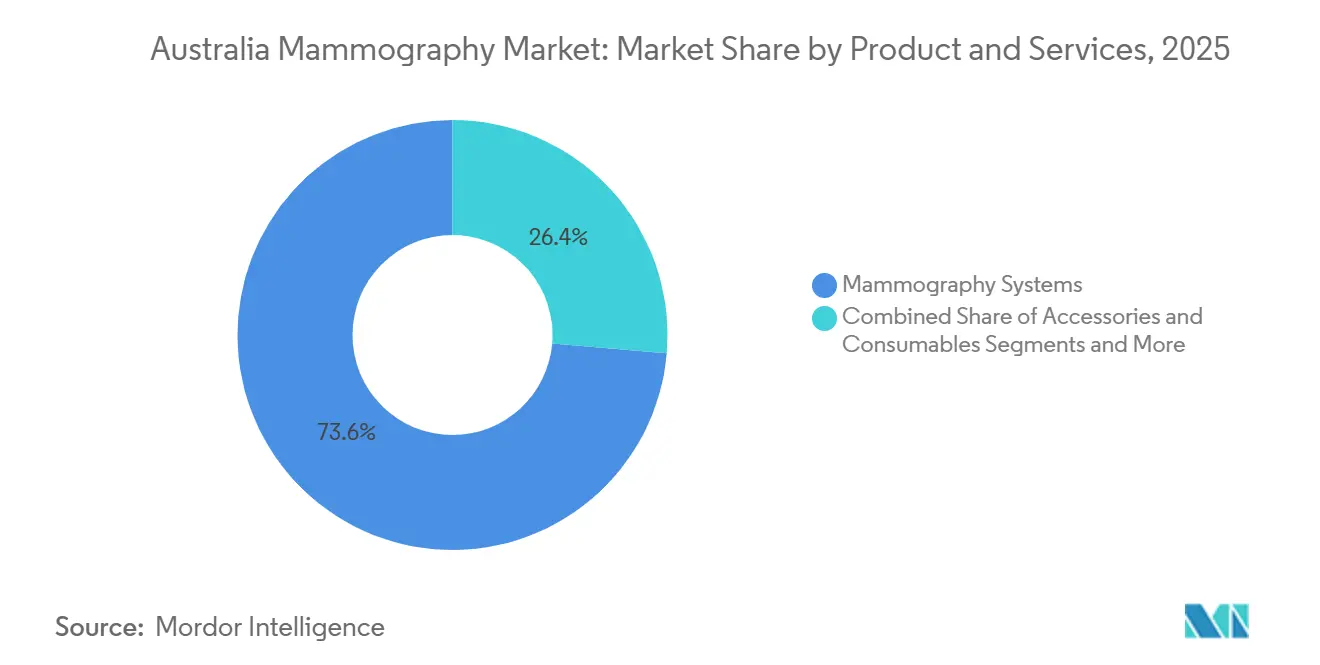
- By product category, Mammography Systems led with 73.64% of the mammography market share in 2025, while Software, Platforms & Services is advancing at a 13.64% CAGR through 2031.
- By technology, Full-Field Digital Mammography accounted for 46.83% of the mammography market size in 2025 and AI-enabled CAD & Image-Triage is projected to expand at a 14.53% CAGR to 2031.
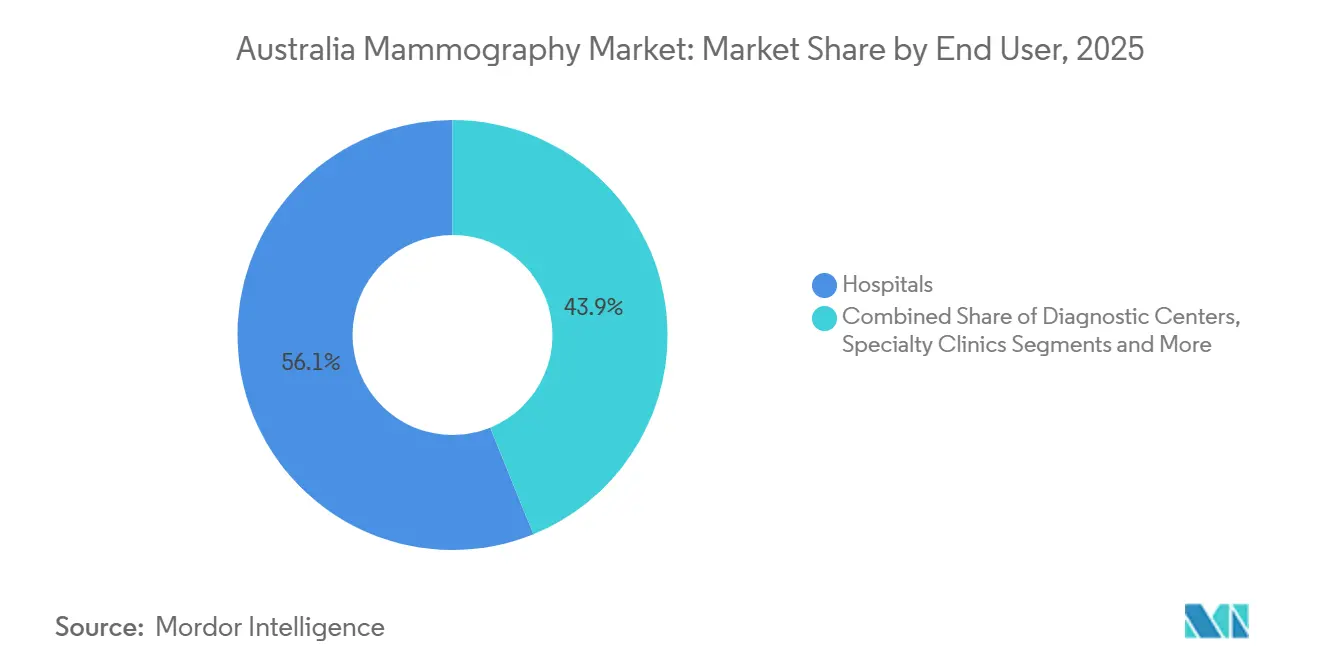
- By end user, Hospitals held 56.14% of the mammography market size in 2025; Diagnostic Centres record the highest projected CAGR at 12.33% through 2031.
Note: Market size and forecast figures in this report are generated using Mordor Intelligence’s proprietary estimation framework, updated with the latest available data and insights as of January 2026.
Australia Mammography Market Trends and Insights
Drivers Impact Analysis*
| Driver | (~) % Impact on CAGR Forecast | Geographic Relevance | Impact Timeline |
|---|---|---|---|
| Rising Breast Cancer Incidence & Screening Targets | +1.8% | National; higher incidence in NSW, Victoria, Queensland | Medium term (2-4 years) |
| MBS Reimbursement for Digital & 3-D Upgrades | +1.5% | National; linked to Nov-2025 item-number rules | Short term (≤ 2 years) |
| Technology Shift to DBT & AI-Assisted Reading | +2.0% | National; early uptake in metropolitan tertiary hospitals | Medium term (2-4 years) |
| Risk-Based Screening & Density Notification Pilots | +0.9% | Pilot states (NSW, Victoria) | Long term (≥ 4 years) |
| Mobile Vans & Tele-Radiology Expanding Rural Access | +0.8% | Regional and remote areas | Medium term (2-4 years) |
| NAS-2022 QA Standards Forcing DR/DBT Replacement Cycles | +1.3% | National; staggered compliance deadlines | Short term (≤ 2 years) |
| Source: Mordor Intelligence | |||
Rising Breast Cancer Incidence & Screening Targets
Australia logged 20,336 new breast-cancer diagnoses in 2025, sustaining policy pressure to lift BreastScreen participation toward the 70% goal that remains well out of reach at 49.6%. Indigenous participation sits even lower at 34.9%, prompting federal and state funding for mobile digital units that beam images to city radiologists. Five-year survival of 93% underlines the payoff from early detection, bolstering the case for additional mammography capacity. The forthcoming BreastScreen policy review is expected to link state funding to incremental participation gains, adding tailwinds for equipment orders. Closing the participation gap implies around 200,000 extra screens a year, which equates to 15-20 new systems if each unit handles 5,000 exams annually.
MBS Reimbursement for Digital & 3-D Upgrades
November 2025 reforms limit DBT claims to dense-breast or high-risk patients, yet the change drives hospitals to install density-assessment software that certifies eligibility and secures the AUD 150 (USD 100) higher reimbursement per study. Facilities mitigate the AUD 500,000-700,000 capital burden by pursuing volume deals with general-practice networks that fill schedules. Private radiology groups that once offered fee-for-service DBT now pivot to MBS-compliant pathways, which stabilize revenue but raise competition for the smaller qualifying cohort. The result is cautious hardware demand paired with robust software uptake.
Technology Shift to DBT & AI-Assisted Reading
Hologic introduced Genius AI Detection in March 2024, enabling one radiologist to supervise multiple AI-flagged worklists and trimming median diagnosis time by as much as 30%. DBT boosts detection by up to 2 cancers per 1,000 screens but multiplies image volume tenfold, creating a reading bottleneck that AI now relieves. Volpara Health Technologies supplies density and risk algorithms deployed across public and private networks, feeding risk-stratified pilots under the ROSA Breast program. Vendors increasingly package AI modules on a subscription basis, lowering upfront costs and extending the revenue tail beyond the equipment sale.
Risk-Based Screening & Density Notification Pilots
The ROSA Breast project modeled 160 scenarios and endorsed annual screening for high-risk women and triennial intervals for low-risk cohorts, a shift projected to cut over-diagnosis by 30% without sacrificing detection rates.[3]ROYAL AUSTRALIAN COLLEGE OF GENERAL PRACTITIONERS, “Risk-Based Breast Screening: Insights from the ROSA Breast Project,” RACGP, racgp.org.au NSW and Victoria now mail density-notification letters that steer dense-breast women toward supplemental ultrasound or MRI, driving uptake of automated density-scoring platforms. While extended intervals dampen equipment utilization in low-risk groups, high-risk cohorts demand more advanced modalities, partially offsetting the volume loss. Draft federal imaging standards published in December 2025 point to mandatory density disclosure by 2028.
Restraints Impact Analysis*
| Restraint | (~) % Impact on CAGR Forecast | Geographic Relevance | Impact Timeline |
|---|---|---|---|
| High Capital & Lifecycle Cost of DBT Systems | -1.2% | National; strongest in regional hospitals | Medium term (2-4 years) |
| Radiologist & Technologist Workforce Shortages | -0.9% | National; acute in rural and remote areas | Long term (≥ 4 years) |
| Tighter DBT Item-Number Eligibility (Nov-2025) | -0.7% | National; heavier impact on private diagnostic centers | Short term (≤ 2 years) |
| Radiation-Exposure & Over-Diagnosis Concerns | -0.5% | National; amplified by advocacy groups and social media | Medium term (2-4 years) |
| Source: Mordor Intelligence | |||
High Capital & Lifecycle Cost of DBT Systems
DBT units cost AUD 500,000-700,000 and require annual service contracts near AUD 50,000, double the outlay for 2D systems. With fewer than 3,000 screens per year, many regional hospitals face payback periods beyond the typical 7-year cycle, deterring upgrades. Larger data sets inflate storage and network expenses, and private centers without bulk-buy leverage defer investments in favor of software retrofits.
Radiologist & Technologist Workforce Shortages
Vacancy rates top 20% in Tasmania, the Northern Territory, and rural Queensland, where facilities depend on high-priced locums and cannot extend screening hours. Technician shortages add to the squeeze, as 30% of radiographers are over 55 and approaching retirement. AI can triage images but still requires final reads by AHPRA-licensed radiologists, preserving the bottleneck. Offshore reporting remains rare due to liability concerns.
*Our forecasts treat driver/restraint impacts as directional, not additive. The impact forecasts reflect baseline growth, mix effects, and variable interactions.
Segment Analysis
By Product and Services: Software Subscriptions Outpace Hardware Sales
Mammography Systems still captured 73.64% of 2025 revenue, yet the category’s share is slipping as providers lengthen replacement intervals and retrofit existing units with AI modules. Software, Platforms & Services is advancing at a 13.64% CAGR, reflecting demand for cloud archiving, density analytics, and computer-aided detection that address workforce shortages. Hologic licenses Genius AI Detection at about AUD 30,000 per year, letting hospitals delay full upgrades while boosting sensitivity. Volpara’s per-study fees turn screening volume directly into SaaS revenue, offering resilience against hardware-cycle swings. The mammography market size attributed to Accessories & Consumables remains a stable mid-single-digit slice, tied closely to screen volume rather than technology mix.
Second-order effects reinforce the pivot. Draft national imaging standards specify automated dose logging and phantom tracking, functions delivered through software rather than hardware. Public hospitals in NSW and Victoria negotiate enterprise licenses that cap per-study costs, while smaller private clinics accept per-click billing to avoid upfront fees. This migration to recurring models improves cash flow for vendors and aligns expenses with utilization for providers, advancing a service-led trajectory in the mammography market.



By Technology: AI-Enabled CAD Disrupts Traditional Workflows
Full-Field Digital Mammography maintained a 46.83% share of 2025 revenue, yet AI-enabled CAD & Image-Triage is forecast to grow 14.53% annually through 2031 as radiology departments seek efficiency gains. DBT adoption tempers because the November 2025 MBS change restricts claims, but hospitals that already own DBT consoles hedge risk by adding triage software that accelerates reads. Photon-counting mammography remains pre-approval, though early studies highlight dose reductions that could tilt future procurement. The mammography market share led by AI technology will expand as regulatory clarity emerges on autonomous diagnosis, potentially doubling radiologist throughput and cementing AI as a core purchase criterion.
Regulatory pressure also supports tech turnover. NAS-2022 lowers allowable mean-glandular dose, a metric legacy 2D units struggle to meet without costly retrofits. Vendors offer firmware upgrades that cut exposure and add AI quality-control modules, extending life span but nudging providers toward newer platforms that bundle everything in one purchase. The mammography market size derived from DBT may plateau, yet total software spend keeps growing, offsetting slower hardware rollouts.
By End User: Diagnostic Centres Capture Share from Public Clinics
Hospitals retained 56.14% revenue share in 2025, but Diagnostic Centres are projected to expand 12.33% yearly, narrowing the gap as women favor shorter waits, after-hours slots, and bundled imaging. Private chains leverage agile capital budgets to acquire DBT units and AI suites ahead of public peers, monetizing premium services even after tighter MBS rules. Specialty Clinics that focus solely on breast imaging appeal to high-risk patients needing coordinated care, raising average revenue per screen. The mammography market size flowing through mobile vans and occupational programs remains small yet strategic, as it taps populations unreachable by fixed sites.
Public hospitals respond by outsourcing after-hours reading to private tele-radiology providers, sliding revenue toward the diagnostic-center segment. Leasing models help public sites acquire upgrades without large capital outlays, yet volume-linked payments expose them to participation fluctuations. As risk-based pilots lengthen intervals for low-risk groups, throughput in public clinics could dip, accelerating the shift of routine work to private centers that cross-sell adjunct services.
Geography Analysis
New South Wales, Victoria, and Queensland account for roughly 75% of national screening volume, anchoring vendor focus and early adoption campaigns. Density-notification pilots in NSW and Victoria drive automated-scoring software demand, whereas Queensland’s 12-unit mobile fleet broadens rural reach and is slated to add three more vans with satellite-ready DR in 2026. Western Australia and South Australia lean on tele-radiology networks that route images from sparsely populated areas to city radiologists, a model that may lift software revenue faster than hardware because it multiplies sites without multiplying specialists.
Tasmania and the Northern Territory struggle with sub-40% participation, hampered by long travel distances and intermittent radiologist availability. Recent van purchases aim to fill gaps, but maintenance and bandwidth remain hurdles. The Australian Capital Territory punches above its weight, showcasing the country’s highest DBT penetration as affluent demographics chase tech-first offerings. Geographic disparities might ease once a proposed federal imaging standard harmonizes QA and dose audit rules in 2028, yet until then, staggered state deadlines create a patchwork that vendors exploit through modular product lines.
Inter-state fleet ages vary, positioning NSW and Victoria for earlier replacement by 2027, while Queensland and Western Australia defer to 2028. Vendors sequence sales campaigns around these windows, bundling software that meets the strictest state standard to future-proof installations elsewhere. Such timing intricacies underscore why service contracts and upgrade paths now carry equal weight to headline hardware specs in purchase decisions across the mammography market.
Regulatory Landscape
Mammography systems and related software deployed in Australia are regulated as medical devices under the Therapeutic Goods Act 1989 and the Therapeutic Goods (Medical Devices) Regulations 2002, with suppliers typically requiring inclusion in the Australian Register of Therapeutic Goods (ARTG) before supply. In parallel, BreastScreen Australia services operate under the National Accreditation Standards (NAS), with accreditation decisions overseen through the program governance structure (including the National Quality Management Committee), which makes quality management and documented performance a procurement prerequisite for public screening providers.
Radiation safety and compliance obligations also sit at state and territory levels, for example through mammography-focused radiation standards issued by bodies such as the NSW Environment Protection Authority (EPA). The Therapeutic Goods Administration (TGA) continues post-market oversight via safety monitoring and public safety communications for breast screening devices, including cautionary guidance against non-evidence-based alternatives such as thermography, reinforcing mammography as the standard imaging modality in formal screening pathways.
Value Chain Analysis
The Australia mammography value chain is anchored by global OEMs (and their Australian subsidiaries) supplying full-field digital mammography and DBT systems, complemented by specialized software providers delivering AI-enabled CAD/image-triage, density assessment, archiving, and dose/QA workflow tools. Equipment and software typically move through importer-distributor networks and direct enterprise sales into hospitals, private diagnostic center chains, and BreastScreen services, with downstream value captured in installation, applications training, integration with PACS/RIS, and multi-year service agreements.
Compliance and operating requirements shape the post-sale portion of the chain. BreastScreen Australia accreditation under the NAS and state-based radiation standards drive ongoing QA, performance testing, and audit readiness, which increases demand for service engineers and software-enabled quality management. Workforce constraints highlighted in the market context further elevate the role of tele-radiology connectivity and AI workflow subscriptions as recurring components, expanding vendor involvement beyond the initial capital purchase into continuous optimization and compliance support.
Competitive Landscape
Hologic, GE HealthCare, and Siemens Healthineers are key players in the market, conferring scale yet facing erosion as software specialists and local innovators stake claims. Hologic monetizes its installed base via Genius AI Detection subscriptions that deepen customer lock-in without fresh capital outlays. Volpara Health Technologies dominates density analytics, embedding algorithms into over 2,000 sites worldwide and partnering with ROSA Breast pilots to prove real-world utility, thereby capturing recurring SaaS revenue regardless of hardware brand.
Micro-X Ltd pursues carbon-nanotube sources that cut weight and power needs for mobile units, targeting rural fleets where uptime and portability trump throughput. Incumbents, mindful of price compression, extend service contracts and trial pay-per-use pricing that lowers entry barriers for budget-strained public hospitals but shifts margin risk onto themselves. The December 2024 lapse of the centralized QA program let vendors bundle compliance modules with equipment, turning regulation into a differentiator rather than a burden.
White-space growth appears in AI-driven tele-radiology that meets AHPRA rules, contrast-enhanced spectral mammography for equivocal cases in dense tissue, and subscription QA software that automates phantom and dose audits. As software mix rises, competitive edges tilt toward algorithm accuracy, workflow integration, and cybersecurity credentials more than gantry speed or detector size, reshaping what “best-in-class” means within the mammography market.
Australia Mammography Industry Leaders
Hologic Inc.
GE HealthCare
Siemens Healthineers
Fujifilm Holdings
Koninklijke Philips N.V.
- *Disclaimer: Major Players sorted in no particular order

Market Opportunities and Future Outlook
Software-led upgrades remain a practical entry point for vendors and providers, particularly where reimbursement and workforce constraints limit how quickly facilities can refresh hardware. The November 2025 Medicare Benefits Schedule (MBS) changes that narrowed DBT eligibility increase the need for automated breast-density assessment tools that document eligibility and standardize reporting. This dynamic supports opportunities in density analytics, audit-ready documentation, and workflow products that reduce reading burden, including AI-enabled image-triage modules, especially where sites keep legacy 2D/DBT systems in service but need performance and compliance uplift.
Public screening participation gaps and program modernization also support solutions that scale access without scaling on-site specialists. BreastScreen Australia continues to provide free mammograms for women over 40 on a two-year cycle, and the market context highlights ongoing mobile-van procurement and tele-radiology models to extend reach into regional and remote areas. Recent 2026 activity also reinforces the pathway toward AI-integrated screening operations, with BreastScreen South Australia commencing the BRAIx clinical trial comparing current double-reading approaches with an AI-supported model, and with large network-level software deployments such as Enlitic securing a multi-year Ensight subscription with Lumus Imaging for rollout across a national footprint.
Recent Industry Developments
- July 2026: The BRAIx AI clinical trial expands to BreastScreen South Australia as of July 6, 2026, extending AI assisted screening within the national program. This shift accelerates the adoption of AI enabled screening tools across Australia.
- June 2026: Enlitic, Inc. signs a three year Ensight software subscription with Lumus Imaging across its 150 location network. The arrangement expands AI driven diagnostic capabilities across a large Australian network.
- May 2026: Jardine Matheson signs an agreement to acquire Australian diagnostic imaging provider I-MED Radiology Network for approximately A$3.4 billion. The consolidation strengthens scale and may influence market pricing and procurement dynamics.


Research Methodology Framework and Report Scope
Market Definition and Coverage
For this study, the market covers revenues earned in Australia from mammography systems and the supporting items needed to run them in clinical screening and diagnostic workflows, including related software and service platforms.
Scope exclusions: We do not count breast imaging modalities that are not mammography (such as ultrasound or MRI) and we exclude broader hospital imaging services revenue that is not tied to mammography equipment and its direct attach.
Segmentation Overview
- By Product and Services
- Mammography Systems
- Accessories and Consumables
- Software, Platforms and Services
- By Technology
- Full-Field Digital Mammography (FFDM - 2D)
- Digital Breast Tomosynthesis (3D)
- Contrast-Enhanced Spectral Mammography (CESM)
- AI-enabled CAD & Image-triage
- Photon-counting Digital
- By End User
- Hospitals
- Diagnostic Centers
- Specialty Clinics
- Others
Data Sources, Market Sizing, and Validation
Desk Research
Desk research built the base structure of the model and helped us set realistic boundaries for what should be counted as mammography revenue in Australia. We leaned on public and official sources such as the Australian Institute of Health and Welfare, BreastScreen Australia reporting, the Australian Bureau of Statistics, the Australian Government Department of Health and Aged Care releases, and peer reviewed clinical literature that describes screening uptake and technology shifts (for example, digital mammography and tomosynthesis adoption).
To translate these signals into a market value, we also reviewed supplier public materials like annual reports, investor decks, and tender announcements, along with reputable news coverage for hospital and imaging network purchasing cycles. Where available, we used paid subscriptions for company financials and news intelligence, patents, and shipment level import and export checks to sanity test unit flow and typical price bands. This list is illustrative, and many other sources were also used during data collection, validation, and clarification of assumptions.
Primary Interviews and Surveys
Primary work focused on confirming what gets purchased, how often systems are replaced, and how pricing is moving across 2D digital mammography and 3D upgrades, which is hard to infer from public data alone. We spoke with a mix of hospital imaging leaders, diagnostic center operators, procurement contacts, and service teams across Australia so that demand drivers and attach rates could be checked against real buying behavior.
Distribution of primary research fieldwork respondents
| Company type | Respondent position |
|---|---|
| Top tier: 33% | CXOs: 13% |
| Mid tier: 45% | Functional/Unit leaders: 30% |
| Smaller Players: 22% | Managers: 57% |
Market-Sizing & Forecasting
Sizing started with a top-down build that reconstructs the annual demand pool from Australia screening activity and diagnostic casework, and then converts this into equipment, software, and service revenue using realistic utilization and replacement patterns. In practice, variables such as screening participation and recall rates, installed base aging, replacement cycle length, the share of sites moving from 2D to 3D, service contract attachment, and typical consumable use per exam were used to shape yearly volumes and spending.
The totals were then corroborated with selective bottom-up approximations, where we cross checked supplier presence in Australia, public procurement signals, and sampled price points to make sure the implied unit volumes and ASPs were not drifting away from what buyers report. Where direct unit information was missing, gaps were handled by applying conservative ranges agreed in interviews, and then tightening them after channel checks so the final totals stay traceable to observable indicators.
For forecasting, we relied on scenario analysis supported by short series trend smoothing, because policy driven screening behavior and upgrade waves can move in steps rather than in a straight line. Assumptions on ASP movement were kept practical, with inflation, mix shift toward higher priced 3D systems, and service renewal behavior reviewed with field inputs before the forward numbers were locked.
Data Validation & Update Cycle
Outputs were validated through triangulation across three layers: the activity based demand build, supply side reality checks, and interview based pricing and attach assumptions. We also ran variance checks year by year to flag jumps that did not match known upgrade cycles, tender timing, or screening program signals, and those items were sent back for a second analyst review.
The report is refreshed annually, and interim updates are triggered when material events occur, such as a major screening guidance change, public funding shifts, or a noticeable pricing step change. Before delivery, an analyst performs a fresh pass on key inputs like exchange rates and recent announcements so clients receive the latest updated view.
Mordor Intelligence's Australia Mammography Market Size Compared Against Other Published Estimates
Published numbers for Australia mammography can look far apart because each publisher draws the market boundary differently and then applies its own timing for pricing and currency conversion. Differences also show up when one view counts only equipment shipments, while another blends in software, service platforms, and recurring consumables.
A refresh led difference is often the biggest driver in this market, since replacement tenders can cluster in certain years and average selling prices move with mix shift toward 3D systems and inflation. By rechecking ASP ranges, exchange rate timing, and screening demand signals right before final sign off, Mordor Intelligence reduces the risk that the estimate reflects an outdated price book or an earlier procurement cycle snapshot.
Benchmark comparison
| Source | Market Size | Gaps in Research Methodology |
|---|---|---|
| Mordor Intelligence | USD 69.78 M (2025) | |
| Trade Journal A | USD 62.00 M (2024) | Focuses on mammography equipment only and uses an earlier year, which can miss software, service platforms, and consumables, and can also reflect older pricing before recent 3D upgrade mix effects. |
| Regional Consultancy B | USD 85.00 M (2025) | Uses a broader boundary that appears to roll in adjacent breast imaging diagnostics or wider imaging service revenue, which inflates totals beyond direct mammography system and attach spending. |
The comparison mainly points to two issues, scope boundaries and timing of price and currency inputs, which together can widen the spread even if growth direction is similar. Our approach keeps the value tied to an observable demand pool and repeatable price logic, so the number can be explained and updated cleanly when procurement or screening conditions change.


Key Questions Answered in the Report
How large is Australia’s mammography market in 2026?
It stands at USD 75.59 million and is projected to reach USD 117.75 million by 2031.
What is the forecast CAGR for mammography spending through 2031?
The market is expected to expand at 9.27% a year over 2026-2031.
Which product segment is growing fastest?
Software, Platforms & Services leads with a 13.64% CAGR as providers adopt AI and cloud solutions.
How have November 2025 MBS changes affected DBT adoption?
Reimbursement now targets dense-breast or high-risk women, cutting eligible volume yet boosting demand for density-assessment software that proves eligibility.
Why are Diagnostic Centres gaining ground?
They offer extended hours, quick reporting, and advanced technologies, driving a 12.33% CAGR in their segment revenue.
What role does AI play in easing radiologist shortages?
AI-enabled triage flags high-suspicion studies, letting each radiologist supervise more exams and cutting median diagnosis times by up to 30%.
Page last updated on:


 Your data is secure and never sold or shared.


