Market Overview
| Study Period | 2020 - 2031 |
|---|---|
| Forecast Data Period | 2026 - 2031 |
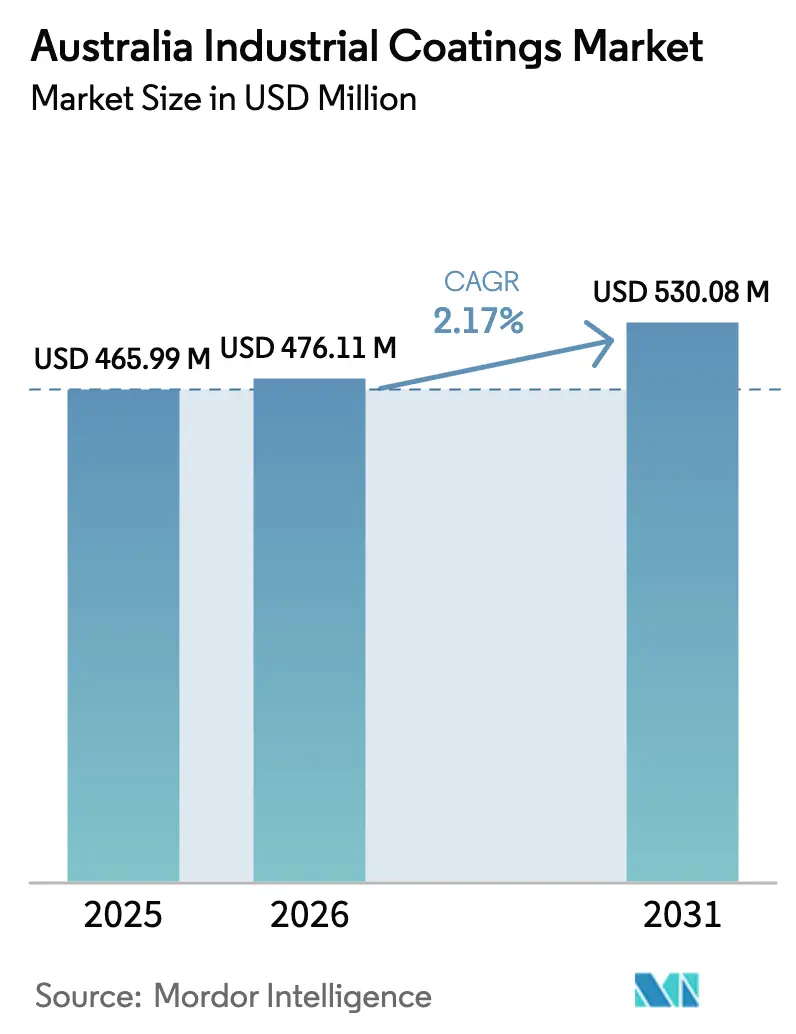
| Base Year Market Size (2025) | USD 465.99 Million |
| Market Size (2026) | USD 476.11 Million |
| Market Size (2031) | USD 530.08 Million |
| Growth Rate (2026 - 2031) | 2.17% CAGR |
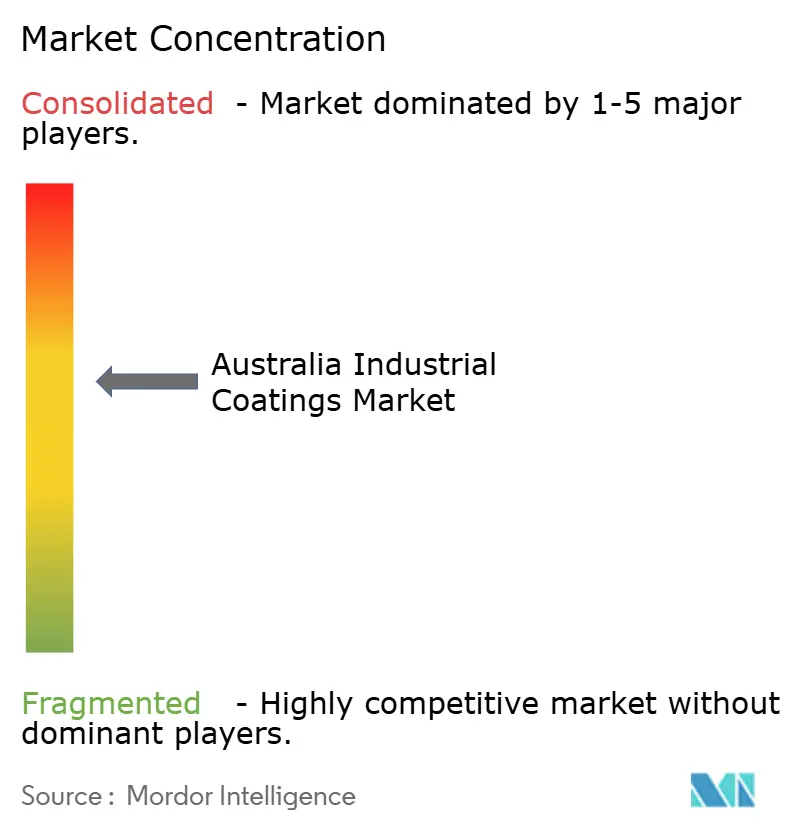
| Market Concentration | Medium |
Major Players *Disclaimer: Major Players sorted in no particular order Image © Mordor Intelligence. Reuse requires attribution under CC BY 4.0. | |
Australia Industrial Coatings Market Analysis by Mordor Intelligence
The Australia Industrial Coatings Market size was valued at USD 465.99 million in 2025 and estimated to grow from USD 476.11 million in 2026 to reach USD 530.08 million by 2031, at a CAGR of 2.17% during the forecast period (2026-2031). Sustained capital expenditure in mining, stricter emission regulations, and rising electrification of heavy equipment anchor this steady trajectory, while fragmentation among suppliers cushions cyclical swings in construction and manufacturing demand. Battery-electric haul trucks, autonomous mining vehicles, and offshore wind foundations now influence resin and pigment selection, prompting suppliers to adopt water-borne, high-solids, and powder technologies that reduce volatile organic compound emissions. Regulatory cost pressures from the Australian Industrial Chemicals Introduction Scheme are accelerating the adoption of lower-solvent chemistries; yet, solvent-borne systems remain entrenched in harsh resource environments where ultimate corrosion resistance is non-negotiable[1]Australian Industrial Chemicals Introduction Scheme, “Registration and Fees Update 2024-25,” industrialchemicals.gov.au . Import penetration from Asia intensifies price competition in commodity grades, but local distributors continue to prevail through fast turnaround and on-site technical support in remote mining hubs. White-space opportunities arise in battery housing, thermal management, and anti-fouling solutions for offshore renewables, signaling scope for differentiated offerings even as the overall Australia industrial coatings market matures.
Key Report Takeaways
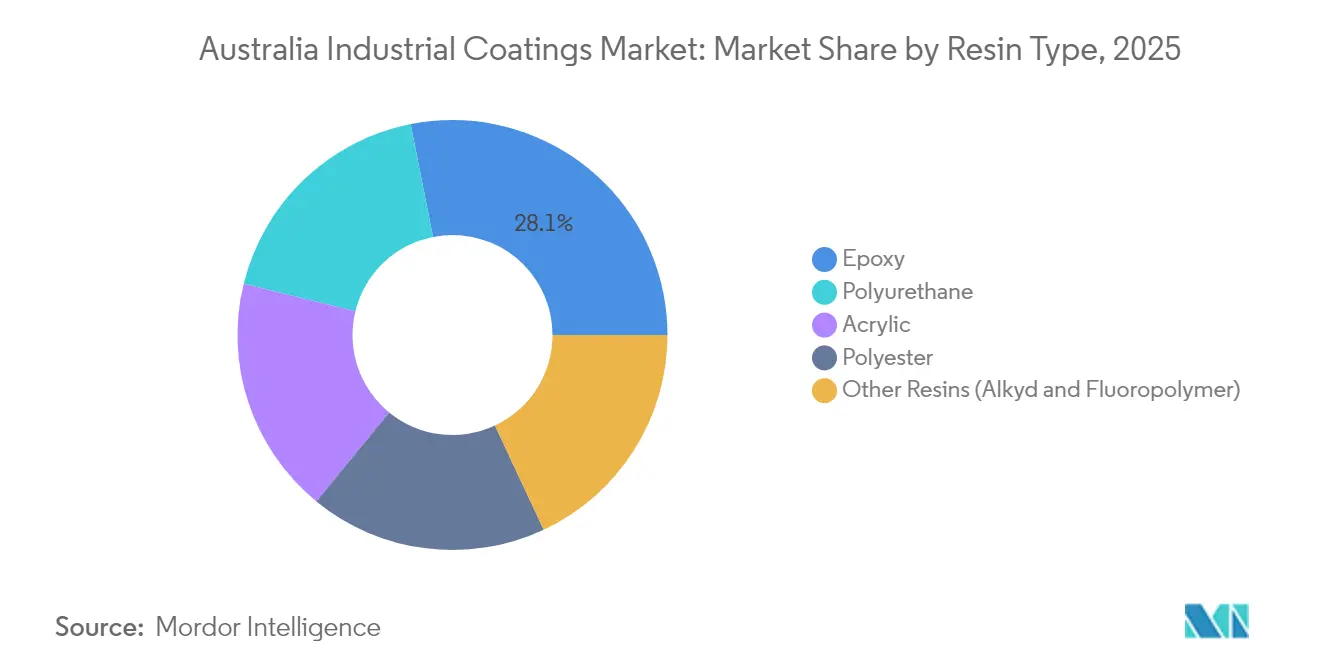
- By resin type, epoxy held 28.12% of the Australia industrial coatings market share in 2025, while polyurethane recorded the highest projected CAGR at 2.66% through 2031.
- By technology, solvent-borne systems led with a 33.85% revenue share in 2025, whereas water-borne coatings are forecast to grow at the fastest rate, with a 2.78% CAGR, to 2031.
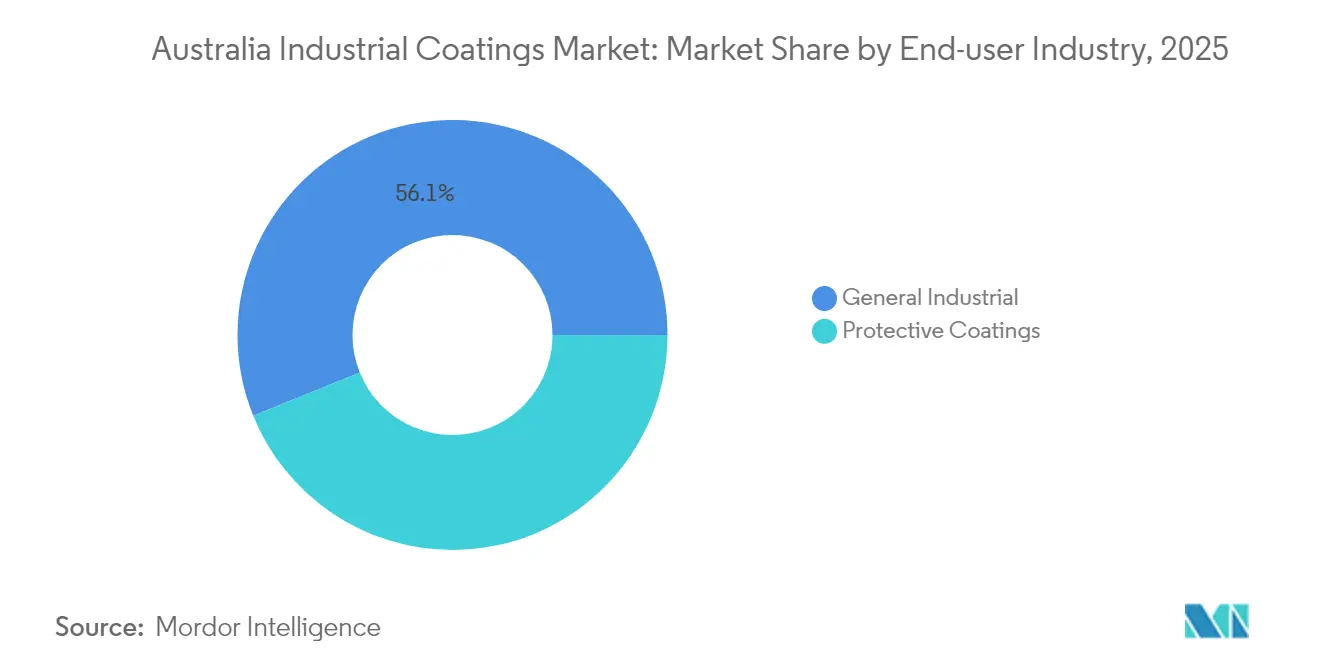
- By end-user industry, general industrial applications captured 56.12% of the Australia industrial coatings market share in 2025 and are projected to grow at a 2.36% CAGR through 2031.
Note: Market size and forecast figures in this report are generated using Mordor Intelligence’s proprietary estimation framework, updated with the latest available data and insights as of 2026.
Australia Industrial Coatings Market Trends and Insights
Drivers Impact Analysis*
| Driver | (~) % Impact on CAGR Forecast | Geographic Relevance | Impact Timeline |
|---|---|---|---|
| Shift to low-/zero-VOC technologies | +0.4% | National, with early adoption in NSW, VIC metropolitan areas | Medium term (2-4 years) |
| Renewed mining CAPEX cycle | +0.6% | WA, QLD mining regions, with spillover to SA | Short term (≤ 2 years) |
| Infrastructure stimulus (Roads, Rail, Defence) | +0.5% | National, concentrated in defense manufacturing hubs | Medium term (2-4 years) |
| Fleet electrification raising OEM paint volumes | +0.3% | Mining regions WA, QLD, urban transport corridors | Long term (≥ 4 years) |
| Growth of on-site powder-coating jobbers | +0.2% | Regional Australia, mining service centers | Short term (≤ 2 years) |
| B2B e-commerce platforms accelerating small-lot sales | +0.2% | National, strongest in regional markets | Short term (≤ 2 years) |
| Source: Mordor Intelligence | |||
Shift to Low-/Zero-VOC Technologies
Regulatory fees tied to solvent volume under the Australian Industrial Chemicals Introduction Scheme tilt cost structures toward water-borne and high-solids chemistries. Mining companies now specify water-borne systems for underground gear to minimize ventilation loads and worker exposure. Corporate sustainability mandates from major companies such as Rio Tinto and BHP cascade to suppliers, compelling them to disclose solvent-reduction roadmaps. Recent polymer advances enable water-borne epoxies to approach the durability of solvent-borne epoxies, easing specification hurdles for splash-zone, chemical-process, and high-temperature applications. As a result, low-VOC formulations are gaining market share, even where Australia’s severe climate once favored high-solvent blends, positioning waterborne chemistries for sustained uptake despite lingering performance gaps in extreme heat.
Renewed Mining CAPEX Cycle
An investment pipeline exceeding USD 22 billion through 2026 spans lithium, rare earths, and critical minerals projects across Western Australia and Queensland. Battery-electric haul trucks need thermally conductive and dielectric coatings, creating premium niches for formulation specialists. Autonomous operations push demand for sensor-compatible coatings that maintain reflectivity and cleanliness under continuous lidar scanning. Mining operators seek longer-life protective systems to limit maintenance-related emissions, enhancing the value proposition for next-generation hybrids such as glass-flake epoxies. Regional applicators leverage proximity and rapid deployment to secure refurbishment projects, while multinational suppliers focus on factory-applied systems for new-build equipment. The combination of volume growth and specification complexity underpins robust demand for coatings through the forecast period.
Infrastructure Stimulus (Roads, Rail, Defence)
Federal transport upgrades, naval shipbuilding, and land-based defence programs collectively allocate USD 17-22 billion to coated steel, composite, and concrete assets[2]Australian Government Department of Defence, “Naval Shipbuilding Program Update 2025,” defence.gov.au. Ship hulls built in South Australia require marine coatings with 25-year maintenance cycles and robust anti-fouling performance. Metro rail modernisation drives sales of graffiti-resistant polyurethanes that retain gloss under ultraviolet exposure. Defence localisation goals favor Australian suppliers that can document secure supply chains, prompting global brands to forge joint ventures or licensing deals with domestic partners. These multiyear programs offer demand predictability and enable plant capacity investments beyond day-to-day maintenance work. Consequently, infrastructure remains a stabilising force for the Australia industrial coatings market during commodity downturns.
Fleet Electrification Raising OEM Paint Volumes
Electric buses, trucks, and mining vehicles expand the surface area, complexity, and functional requirements of OEM coatings. Battery enclosures require flame-retardant and heat-dissipating finishes that endure thermal cycling and resist electrolyte spills. Charging stations and cabling hardware require UV-stable, abrasion-resistant powders that complement urban design aesthetics. In mining, explosion-proof coatings meet stringent safety rules for underground battery equipment. These applications command premium pricing and encourage long-term technology partnerships between coaters and equipment makers. As fleet electrification accelerates toward 2030, functional coatings specific to electrical powertrain architecture are set to form a distinct high-growth pocket within the wider Australia industrial coatings market.
Restraints Impact Analysis*
| Restraint | (~) % Impact on CAGR Forecast | Geographic Relevance | Impact Timeline |
|---|---|---|---|
| Solvent-borne VOC compliance costs rise | -0.3% | National, strongest impact in urban areas | Short term (≤ 2 years) |
| Skilled applicator shortage in remote regions | -0.2% | WA, QLD, NT mining regions | Medium term (2-4 years) |
| Epoxy raw-material price volatility | -0.4% | National, supply chain dependent | Short term (≤ 2 years) |
| Import penetration from low-cost Asian suppliers | -0.3% | National, strongest in commodity segments | Medium term (2-4 years) |
| Source: Mordor Intelligence | |||
Solvent-Borne VOC Compliance Costs Rise
Fee increases of 3.1% for 2024-25, under the cost-recovery framework, raise the total bill for solvent-based imports and force distributors to revisit their pricing models. Small batch specialty suppliers struggle to absorb or pass through higher overheads, heightening consolidation risk and reducing customer choice in niche formulations. Urban projects already face local air-quality limits that restrict solvent emissions during application, prompting a shift toward water-borne options despite performance concerns. Compliance paperwork for classification, record-keeping, and annual reporting diverts technical staff time away from product development. Collectively, these costs and resource burdens erode the competitiveness of traditional solvent-borne portfolios in the Australian industrial coatings market.
Skilled Applicator Shortage in Remote Regions
Mining expansions in the Pilbara and Bowen Basin outpace the availability of certified coating professionals, driving up labor premiums and extending project schedules. Fly-in-fly-out crews fill gaps but raise travel and accommodation costs, squeezing margins for maintenance contractors. Government workforce strategy papers classify industrial coating application as a priority skill, yet training capacity remains insufficient to meet near-term demand. Delays in routine maintenance and refurbishment elevate the risk of corrosion, forcing operators to allocate contingencies for unplanned outages. Although advances in spray robotics and drone-applied touch-ups offer partial relief, the human resource bottleneck persists as a structural restraint on growth across remote nodes of the Australia industrial coatings market.
*Our forecasts treat driver/restraint impacts as directional, not additive. The impact forecasts reflect baseline growth, mix effects, and variable interactions.
Segment Analysis
By Resin Type: Epoxy Dominance Reflects Harsh Environment Demands
Epoxy systems captured 28.12% of Australia industrial coatings market share in 2025, a position underpinned by their proven chemical resistance on mine site assets and coastal infrastructure. The breadth of epoxy chemistries enables formulators to tailor barrier properties against sulfuric acid, brine, and hydrocarbon exposure, thereby minimizing downtime in heavy-duty service. Polyurethane resins, although currently smaller in volume, are advancing at a 2.66% CAGR due to their flexibility and UV stability, which are essential for equipment that cycles between scorching daytime heat and cooler nights. Acrylics continue to cater to lower-demand shop primers and architectural elements where cost discipline prevails, while polyester powders dominate white-goods and outdoor furniture lines produced in Victoria and New South Wales.
A wave of bio-based epoxy initiatives has emerged as suppliers target reductions in Scope 3 emissions. BASF’s launch of a bio-derived ethyl acrylate feedstock provides formulators with a renewable pathway that does not compromise mechanical performance. Downstream, mining majors are piloting graphene-enhanced epoxy topcoats that increase abrasion resistance and reduce film thickness without compromising longevity. Raw-material volatility for bisphenol A and epichlorohydrin remains a profit headwind, encouraging supply-chain diversification toward southeast Asian intermediates. Consequently, the resin landscape balances entrenched epoxy demand with innovation-led growth segments, reinforcing steady value expansion across the Australia industrial coatings market.


By Technology: Solvent-Borne Resilience Despite Environmental Pressure
Solvent-borne systems maintained a 33.85% revenue lead in 2025, illustrating the enduring preference for tried-and-tested performance in cyclone-prone, abrasive contexts. High-solid alkyds and polyurethanes enable thicker films per pass, reducing application time on towering dump trucks and process tanks. That said, water-borne chemistries post the fastest gains at 2.78% CAGR to 2031, aided by regulatory fees linked to solvent tonnage and cleaner-air commitments from tier-one miners. Powder coatings are gaining momentum in regional job shops, where overspray capture and energy-efficient infrared ovens help equalize piece-part costs against liquid lines. Other technologies, notably UV-cured topcoats, find footholds in electronics enclosures that require rapid turnaround and minimal footprint.
The compliance fee logic of the Industrial Chemicals Introduction Scheme exacerbates the total cost gap between solvent-borne and low-VOC systems, thereby reinforcing water-borne uptake in each budget cycle. Underground mining specifications now embed solvent-content limits to trim ventilation horsepower, a hidden but significant operating expense in deep orebodies. Meanwhile, powder coaters near Kalgoorlie and Mackay extend booth footprints to handle larger drivetrain components previously shipped to Perth or Brisbane, tightening local supply loops and embedding service proximity as a strategic moat. This technology mix underscores a dual-track dynamic where solvent-borne robustness coexists with compliance-driven migration to cleaner formats within the Australia industrial coatings market.
By End-user Industry: General Industrial Leadership Masks Protective Coating Opportunities
General industrial customers collectively generated 56.12% of Australia industrial coatings market revenue in 2025 and will grow 2.36% annually through 2031, bolstered by machinery refurbishments, fabricated metal exports, and modular equipment builds. OEMs value one-coat direct-to-metal systems that reduce booth cycles, resulting in polyaspartic hybrids that achieve hardness and gloss targets in half the cure time. Appliance makers in Melbourne and Adelaide are upgrading to low-energy polyester powders that align with state decarbonisation roadmaps. Concurrently, the protective subsegment gains strategic significance as rail, bridge, and LNG assets demand coating lifetimes of 20 years or more, underpinning demand for glass-flake epoxies and zinc-rich primers.
Marine and offshore wind installations tip the balance toward premium multi-layer protective stacks designed for 25-year life with minimal dry-dock intervals. Onshore wind towers near Port Augusta feature fluoropolymer topcoats that protect against ultraviolet degradation, while solar farms in the Riverina region utilize anti-soiling silicones to minimize cleaning cycles. Defence land platforms seek chemical-agent-resistant coatings, carving out specialised runs for low-observable polyurethanes. These high-value niches, though smaller in tonnage, yield above-average margins and anchor R&D partnerships, reinforcing the role of protective finishes as the emergent growth engine inside the broader Australia industrial coatings market size dialogue.
Geography Analysis
Western Australia and Queensland remain the twin pillars of demand, thanks to their dense clusters of iron ore, gold, coal, and critical mineral operations. Nearby job shops in Karratha and Newman apply quick-turn epoxies, capturing value that once flowed to metro applicators. Queensland’s Bowen Basin follows, driven by coal handling and the ramp-up of graphite and vanadium projects that call for high-temperature pipeline linings and battery enclosure coatings optimized for thermal diffusion.
New South Wales retains a diverse demand base, blending fabricated metal exports, rail rolling-stock refurbishments, and building interiors upgraded to low-VOC standards. Victoria contributes a steady volume through appliance powders, packaging coatings, and a resurging aftermarket for commercial vehicle refinishing, aligned with metropolitan fleet electrification policies. South Australia’s defence corridor around Adelaide and Whyalla deepens its appetite for solvent-free marine primers specified by the continuous-build frigate program, while adjacent wind farm projects keep demand for weather-resistant polyurethanes on an upward slope. Collectively, these zones illustrate the geographic mosaic that defines the Australia industrial coatings market.
Remote Northern Territory gas plants and emerging Tasmanian critical-minerals hubs add diversity, though their share remains modest. Logistical remoteness makes local warehousing and rapid dispatch essential, pushing distributors to hold multi-week inventory buffers despite working-capital implications. B2B e-commerce platforms close distance gaps, with independent suppliers listing thousands of SKUs and same-day dispatch for consumables under 25 kilograms, unlocking incremental penetration in sparsely populated regions. As a result, while consumption is geographic-ally concentrated, demand growth pockets appear wherever resource, defence, or infrastructure projects ignite, reinforcing the fragmented yet opportunity-rich profile of the Australia industrial coatings market.
Competitive Landscape
The Australia Industrial Coatings Market is moderately consolidated. International multinationals, including PPG, AkzoNobel, Jotun, and Sherwin-Williams, account for a significant market share. These firms leverage global R&D and broad portfolios, but geographic spread and specialized performance requirements keep regional independents relevant. Domestic suppliers differentiate themselves through field service, faster color matching, and a nimble response to rush orders in mining camps, thereby mitigating the pricing leverage of imported commodity grades. Digital ordering platforms accelerate small-lot transactions, eroding the historical advantage large distributors held in order aggregation.
Australia Industrial Coatings Industry Leaders
The Sherwin-Williams Company
Akzo Nobel N.V.
PPG Industries, Inc.
Nippon Paint Holdings Co., Ltd.
Jotun
- *Disclaimer: Major Players sorted in no particular order

Recent Industry Developments
- November 2025: Sparc Technologies Limited collaborated with Dulux Australia to enhance the Cape Jaffa Lighthouse in Kingston South East, South Australia. By integrating Sparc's graphene-based additive, ecosparc, into Dulux's Durebild STE epoxy coating, the historic cast iron lighthouse will be shielded from the region's severe coastal elements.
- October 2025: PPG Industries, Inc. announced the launch of PPG ENVIROCRON Extreme Protection Edge Plus powder coating. It is a patent-pending, one-coat coating for heavy-duty equipment, HVAC, electrical, and general industrial applications with an improved, smoother finish.


Australia Industrial Coatings Market Report Scope
Industrial coatings are polymer compounds primarily utilized to fulfill industrial design criteria such as non-stick performance, corrosion resistance, and chemical protection on the coated surface. Australia's industrial coatings market is segmented by resin type, technology, and end-user industry. By resin type, the market is segmented into epoxy, polyurethane, acrylic, polyester, and other resin types. By technology, the market is segmented into water-borne coatings, solvent-borne coatings, powder, and other technologies. By end-user industry, the market is segmented into general industrial and protective coatings. For each segment, the market sizing and forecasts have been done on the basis of value (USD Million).
By Resin Type
| Epoxy |
| Polyurethane |
| Acrylic |
| Polyester |
| Other Resins (Alkyd, Fluoropolymer) |
By Technology
| Water-borne |
| Solvent-borne |
| Powder Coatings |
| Other Technologies (UV-/EB-Cured and High Solids) |
By End-user Industry
| General Industrial | |
| Protective Coatings | Oil and Gas |
| Power Generation | |
| Infrastructure | |
| Mining | |
| Other Protective Coatings |
| By Resin Type | Epoxy | |
| Polyurethane | ||
| Acrylic | ||
| Polyester | ||
| Other Resins (Alkyd, Fluoropolymer) | ||
| By Technology | Water-borne | |
| Solvent-borne | ||
| Powder Coatings | ||
| Other Technologies (UV-/EB-Cured and High Solids) | ||
| By End-user Industry | General Industrial | |
| Protective Coatings | Oil and Gas | |
| Power Generation | ||
| Infrastructure | ||
| Mining | ||
| Other Protective Coatings | ||


Key Questions Answered in the Report
How big is the Australia industrial coatings market in 2026?
The Australia industrial coatings market size reached USD 476.11 million in 2026 and is set to grow to USD 530.08 million by 2031.
Which resin type leads sales in Australia?
Epoxy resins lead, accounting for 28.12% of Australia industrial coatings market share in 2025 due to strong chemical and corrosion resistance.
What technology is growing fastest?
Water-borne formulations post the highest growth at a 2.78% CAGR through 2031 as fees linked to solvent content push users toward low-VOC options.
Which industries drive demand?
General industrial manufacturers represent the largest end-user block at 56.12% of revenue, with mining and infrastructure projects providing steady volume.
Why does geography matter in supply strategy?
Remote mine sites in Western Australia and Queensland rely on nearby applicators and distributors for rapid turnaround, shaping regional service models in the Australia industrial coatings market.
Page last updated on:


