
Market Overview
| Study Period | 2021 - 2031 |
|---|---|
| Forecast Data Period | 2026 - 2031 |
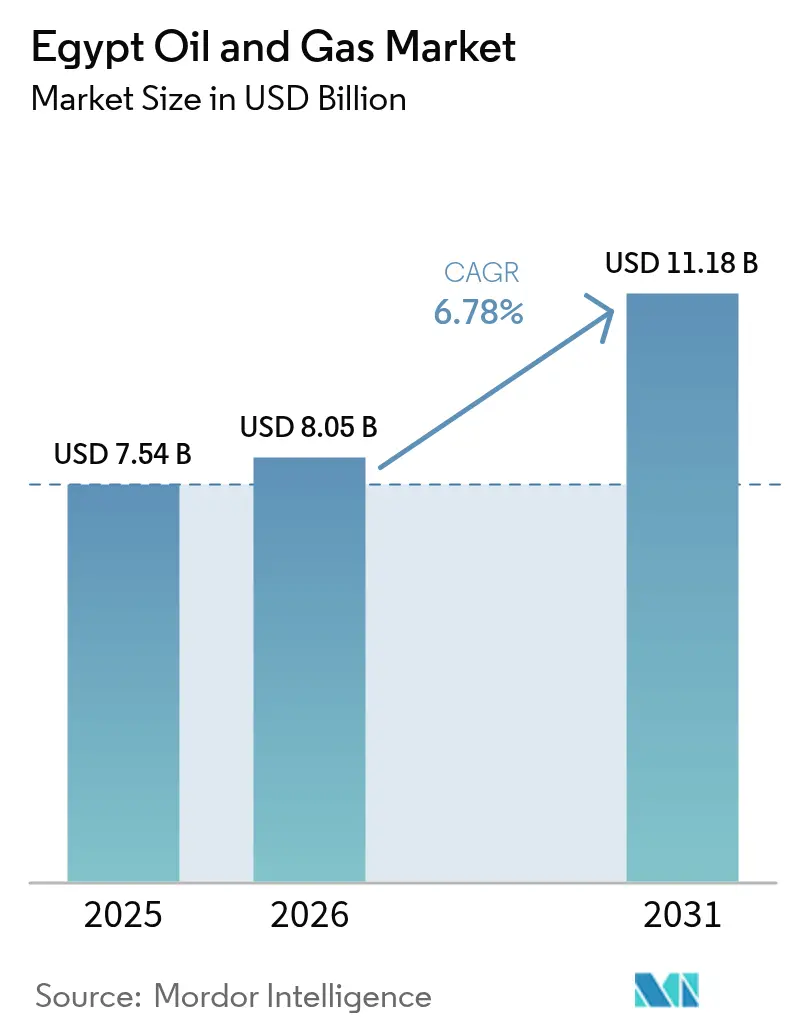
| Base Year Market Size (2025) | USD 7.54 Billion |
| Market Size (2026) | USD 8.05 Billion |
| Market Size (2031) | USD 11.18 Billion |
| Growth Rate (2026 - 2031) | 6.78 % |
| Market Concentration | Medium |
Major Players.webp) *Disclaimer: Major Players sorted in no particular order Image © Mordor Intelligence. Reuse requires attribution under CC BY 4.0. | |
Egypt Oil And Gas Market Analysis by Mordor Intelligence
The Egypt Oil And Gas Market size was valued at USD 7.54 billion in 2025 and estimated to grow from USD 8.05 billion in 2026 to reach USD 11.18 billion by 2031, at a CAGR of 6.78% during the forecast period (2026-2031).
Investment momentum originates from offshore gas discoveries, revived megaprojects, and a renewed financing cycle led by international majors. Rising domestic demand, a maturing asset base, and an improving fiscal regime combine with Egypt’s position as a Mediterranean energy corridor to sustain upstream capital flows even as the country intermittently turns to LNG imports during peak‐load months.[1]“BP to Spend USD 3.5 Billion on Egypt Exploration,” reuters.com Construction spending continues to dominate overall outlays, yet maintenance and turnaround services expand faster as operators pivot from capacity additions toward efficiency gains in a tightening cost environment. Digital oilfield adoption, together with fiscal and regulatory reforms that improve project IRRs by roughly 200-300 basis points, lowers break-even costs and shortens payback cycles, making Egyptian prospects increasingly attractive relative to neighboring plays.[2]“Digital Gateway Accelerates Licensing,” energycentral.com Geopolitical proximity to European gas demand and the government’s East-Med hub vision create commercial optionality for surplus volumes, while fast-track gas-to-power programs protect revenues during commodity price swings.
Key Report Takeaways
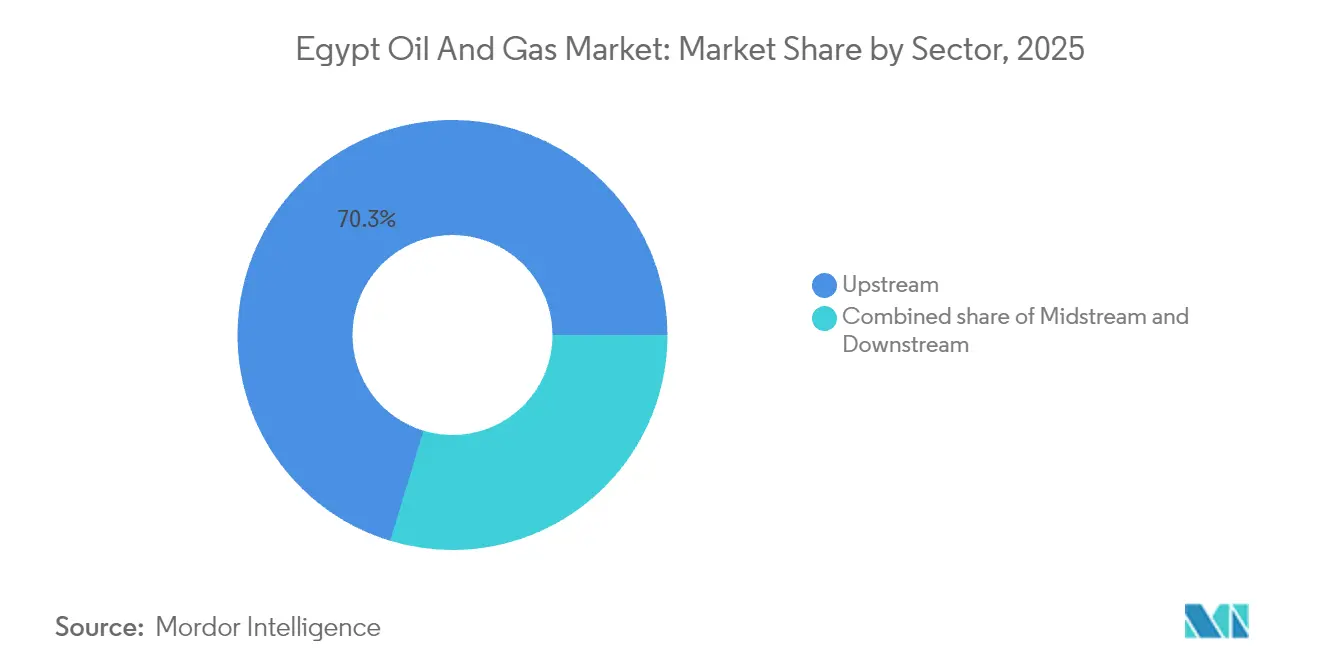
- By sector, upstream commanded 70.32% of Egypt's oil and gas market share in 2025 and is projected to grow at a 7.05% CAGR through 2031.
- By location, onshore sites delivered 55.42% of 2025 revenue, whereas offshore developments are forecast to expand at a 7.26% CAGR between 2026-2031.
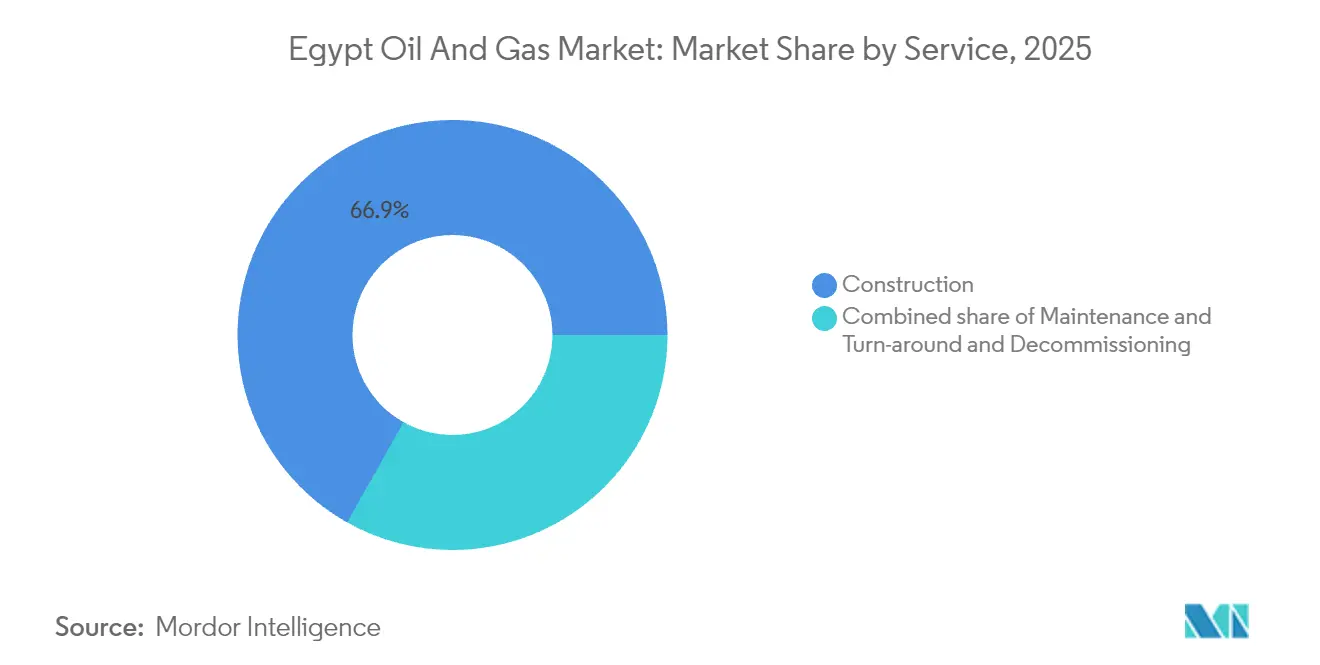
- By service, construction accounted for 66.85% of Egypt's oil and gas market size in 2025; maintenance and turnaround services represent the fastest-growing asset class with a 7.44% CAGR to 2031.
Note: Market size and forecast figures in this report are generated using Mordor Intelligence’s proprietary estimation framework, updated with the latest available data and insights as of 2026.
Egypt Oil And Gas Market Trends and Insights
Drivers Impact Analysis*
| Driver | (~) % Impact on CAGR Forecast | Geographic Relevance | Impact Timeline |
|---|---|---|---|
| Revival of offshore gas megaprojects | 1.80% | Mediterranean offshore blocks, Eastern Delta | Medium term (2-4 years) |
| Accelerated IOC & NOC upstream CAPEX commitments | 1.50% | National, Western Desert and offshore | Short term (≤ 2 years) |
| Fast-track gas-to-power programs | 1.20% | Nationwide, industrial zones | Medium term (2-4 years) |
| Fiscal-regime reforms improving project IRRs | 0.90% | National licensing rounds | Long term (≥ 4 years) |
| Adoption of digital oilfield & remote operations | 0.70% | Western Desert, Gulf of Suez mature fields | Short term (≤ 2 years) |
| Planned East-Med gas hub & LNG re-export vision | 0.60% | Eastern Mediterranean | Long term (≥ 4 years) |
| Source: Mordor Intelligence | |||


Revival of Offshore Gas Megaprojects (e.g., Zohr)
Zohr’s January 2025 drilling restart restored momentum to Egypt’s offshore renaissance and renewed confidence in deep-water prospects.[3]“Eni Restarts Zohr Drilling,” reuters.com Fresh wells and tie-backs shorten ramp-up times, allowing Eni to monetize incremental reserves while de-risking adjacent acreage held by BP and Chevron. Project economics benefit from shared pipelines and processing facilities, which lower per-unit costs and improve field-level break-even thresholds. Success at Zohr also underpins Egypt’s diplomatic leverage in European energy security discussions as buyers seek diversified gas supply corridors. As a bellwether for the Egyptian oil and gas market, Zohr’s performance shapes capital-allocation decisions across the wider Mediterranean play.
Accelerated IOC & NOC Upstream CAPEX Commitments
International oil companies have earmarked more than USD 17 billion for Egyptian upstream activity through 2030, the largest pledge since the 2011 transition.[4]Ministry of Petroleum, “Gas Grid Expansion Update,” sis.gov.eg BP’s USD 3.5 billion three-year program, Shell’s USD 340 million Cheiron partnership, and Chevron’s new Western Desert acreage exemplify the deal flow. The prompt settlement of USD 1.5 billion in arrears removed a key credit risk overhang and unblocked suspended drilling plans. This fresh capital intensifies rig demand, accelerates seismic acquisition, and opens technology transfer pathways that raise local service quality benchmarks. Competitive pressures are therefore reshaping the Egyptian oil and gas market as agile, technology-focused independents challenge long-entrenched majors in select blocks.
Fast-Track Gas-to-Power Programs to Curb Power Deficit
Power generation currently absorbs roughly 75-80% of national gas output, anchoring offtake for new upstream barrels even during price slumps. The state has connected 9 million homes to the gas grid within nine years and aims to reach 15 million by 2030, thereby embedding long-term demand. Vehicle conversions to compressed natural gas topped 540,000 units by early 2025, diversifying end-use markets. Although the 42% renewables goal will curb incremental gas burn, utilities continue to rely on gas-fired plants as a reliability back-stop, mitigating demand volatility. World Bank loan support for generation upgrades further locks in offtake for upstream producers.
Fiscal-Regime Reforms Improving Project IRRs
Egypt’s revised production-sharing terms ease cost-recovery limits, reduce signature bonuses, and introduce accelerated depreciation schedules that lift project IRRs by an estimated 200-300 basis points. A digital one-stop portal expedites licensing approvals, trimming cycle times and administrative costs. The reforms render marginal fields and EOR projects commercially viable, unlocking reserves previously stranded by high lifting costs. Payment‐arrears resolution signals fiscal reliability, a pivotal factor for credit committees. Combined, these measures nudge the Egyptian oil and gas market toward a more competitive global cost curve.
Restraints Impact Analysis*
| Restraint | (~) % Impact on CAGR Forecast | Geographic Relevance | Impact Timeline |
|---|---|---|---|
| Rising renewable-energy share in power mix | -1.10% | Upper Egypt solar zones, national grid | Medium term (2-4 years) |
| Ongoing fuel-subsidy rationalization | -0.80% | Nationwide petroleum markets | Short term (≤ 2 years) |
| Water-scarcity constraints on fracking & EOR | -0.50% | Western Desert, Upper Egypt | Long term (≥ 4 years) |
| Prospective EU carbon border taxes | -0.30% | Export-oriented refineries | Medium term (2-4 years) |
| Source: Mordor Intelligence | |||
Rising Renewable-Energy Share in Egypt's Power Mix
The 42% renewables target for 2030 will increase solar and wind penetration from 12% in 2024, thereby directly reducing the dispatch of gas-fired power. Utility-scale projects under the Nexus of Water-Food-Energy program add 4.2 GW, backed by USD 3.9 billion in concessional finance. Grid upgrades worth EGP 7.6 billion (USD 154 million) enable higher renewable utilization while retaining gas plants for inertia and peak shaving. As the levelized costs of solar fall below gas parity, dispatch orders shift, curtailing gas offtake during daytime hours. Backup capacity requirements nevertheless preserve a baseline market for upstream producers, moderating but not eliminating the impact on the Egyptian oil and gas market.
Ongoing Fuel-Subsidy Rationalization
Monthly subsidy outlays of EGP 10 billion (USD 197 million) are being phased out to meet a 2025 elimination deadline. Rising pump prices erode demand for gasoline and fuel oil, accelerating a modal shift toward CNG vehicles and prompting industrial fuel switching. The World Bank-advised glide path aims to minimize social unrest, yet consumption elasticity is already evident in lower refined-product uplift at distribution terminals. Reduced domestic burn frees barrels for export, partially offsetting revenue losses but exposing refiners to international spreads and prospective carbon border adjustments. The subsidy rollback, therefore, creates both demand-side drag and portfolio-mix challenges that operators must navigate in the Egyptian oil and gas market.
*Our forecasts treat driver/restraint impacts as directional, not additive. The impact forecasts reflect baseline growth, mix effects, and variable interactions.
Segment Analysis
By Sector: Upstream Dominance Drives Digital Transformation
The upstream segment generated 70.32% of 2025 revenue, underscoring its central role in the Egyptian oil and gas market. It is also the fastest-growing, set to rise at a 7.05% CAGR through 2031 as operators fast-track drilling across Zohr, North Dabaa, and Raven blocks. International commitments exceeding USD 17 billion provide the capital base for 3D seismic surveys, high-specification rigs, and subsea tie-backs, aimed at lifting national output back above 2.5 million barrels of oil equivalent per day. Digital subsurface interpretation on the Egypt Upstream Gateway accelerates prospect maturation, while AI well-placement tools optimize drainage patterns and cut dry-hole risk. Consequently, upstream cost structures continue to compress, enhancing netbacks despite volatile benchmarks.
Midstream infrastructure remains the logistical backbone of the Egyptian oil and gas market, yet it captures a smaller share of new spending. Pipeline connectivity to Israeli fields and capacity upgrades at the Idku and Damietta LNG terminals expand regional optionality, but the newbuild cadence is paced to align with the commissioning of upstream phases. Downstream growth faces headwinds from fuel-subsidy reforms and looming carbon levies, prompting refiners to pursue integration with petrochemical complexes and to pilot energy-efficiency retrofits. Collectively, the sectoral balance is shifting toward a technology-enabled, export-oriented upstream while the downstream focuses on resilience and decarbonization.


By Location: Offshore Expansion Challenges Onshore Maturity
Onshore assets contributed 55.42% of 2025 turnover, reflecting Egypt's legacy production base across the Western Desert and Gulf of Suez. These mature fields benefit from existing infrastructure, providing low-cost barrels that underpin cash flow supportive of corporate dividend policies. Enhanced recovery pilots employing polymer floods and CO₂ injection aim to arrest natural decline rates. However, water scarcity and gas reinjection limitations cap the scalable upside, rendering most onshore additions marginal in terms of volume.
Offshore acreage is set to eclipse onshore growth, expanding at a 7.26% CAGR and reshaping the Egypt oil and gas market share profile to favor deep-water plays. Eni's success at Zohr has validated the carbonate play concept, sparking interest in bid rounds for contiguous blocks. Although capex intensity is higher—subsea trees, FPSOs, and high-spec jack-ups drive day rates upward—economies of scale emerge through shared export pipelines and processing topsides. The state's payment-settlement program has further reduced the perceived risk of offshore receivables, shifting portfolio allocation within IOC budgets toward Mediterranean prospects. Consequently, offshore's contribution to Egypt's oil and gas market size is poised to approach parity with onshore volumes by the end of the decade.
By Service: Construction Leads While Maintenance Gains Strategic Importance
Construction activities captured 66.85% of overall spending in 2025, mirroring Egypt’s project-build phase characterized by new pipelines, gas processing trains, and storage caverns. Large-ticket EPC contracts such as the USD 400 million Leviathan tie-in and midstream expansions at GASCO constitute headline award values. Yet operators increasingly scrutinize lifecycle cost and asset reliability, shifting incremental budgets toward brownfield optimization.
Maintenance and turnaround work streams are forecast to grow at a 7.44% CAGR, the fastest within the Egyptian oil and gas market. Digital twin deployment on legacy platforms yields predictive analytics that reduce downtime and defer capex on replacement equipment. Contractors offering integrated inspection-repair packages thus command premium day rates, while regulatory requirements for reducing flares and detecting leaks drive mandatory retrofit cycles. Decommissioning remains in its early stages, primarily limited to aging Gulf of Suez jack-up platforms; however, long-range planning has begun as part of ESG reporting obligations.
Geography Analysis
Domestic operations remain the primary focus of investment, yet regional linkages are increasingly influencing strategy. Egypt’s central location connects sub-Saharan resources to Mediterranean markets, positioning the country as a pivotal transit node. The Eastern Mediterranean Gas Forum formalizes this role, aligning regulatory frameworks and facilitating pipeline interconnections that could transform trade flows over the next decade. Upstream risk-reward, combined with a stable political climate compared to neighbors, cements Egypt’s draw for capital.
In North Africa, cross-border collaboration remains constrained by security issues in Libya and Algeria’s preference for exporting to Europe. Nevertheless, gas-swap mechanisms via LNG terminals offer interim pathways to optimize regional supply. To the east, ties with Israel and Cyprus deepen, delivering feed gas volumes that compensate for domestic seasonal deficits. These imports, regasified at Damietta or Idku, sustain local supply, though they temper immediate re-export ambitions under the East-Med hub blueprint.
Looking south, Egyptian NOCs and service firms eye sub-Saharan prospects, leveraging experience to secure EPC and O&M contracts in Tanzania, Mozambique, and Uganda. Such outward expansion diversifies revenue and embeds Egypt in pan-African energy networks. Although pipeline logistics remain embryonic, geopolitical alignments aligned with the African Continental Free Trade Area could catalyze future corridor development, further embedding Egypt within continental energy value chains.
Regulatory Landscape
Egypt's oil and gas sector is overseen by the Ministry of Petroleum and Mineral Resources, with EGPC (oil), EGAS (natural gas), and GANOPE (Upper Egypt and frontier areas) acting as the key state counterparts across licensing, approvals, and operational governance. The prevailing framework is concession-based, commonly structured as production sharing agreements (PSAs) where the state retains resource sovereignty and contractor rights are defined by the agreement terms and ratified instruments.
A central operational shift in administration is the use of the Egypt Upstream Gateway (EUG) as the official digital platform for bid rounds, data access, and standardized documentation, including model agreement templates maintained for 2025-2026. This portal-led approach streamlines engagement for international bidders while reinforcing compliance with state-entity processes, audits, and approvals embedded in concession execution.
Competitive Landscape
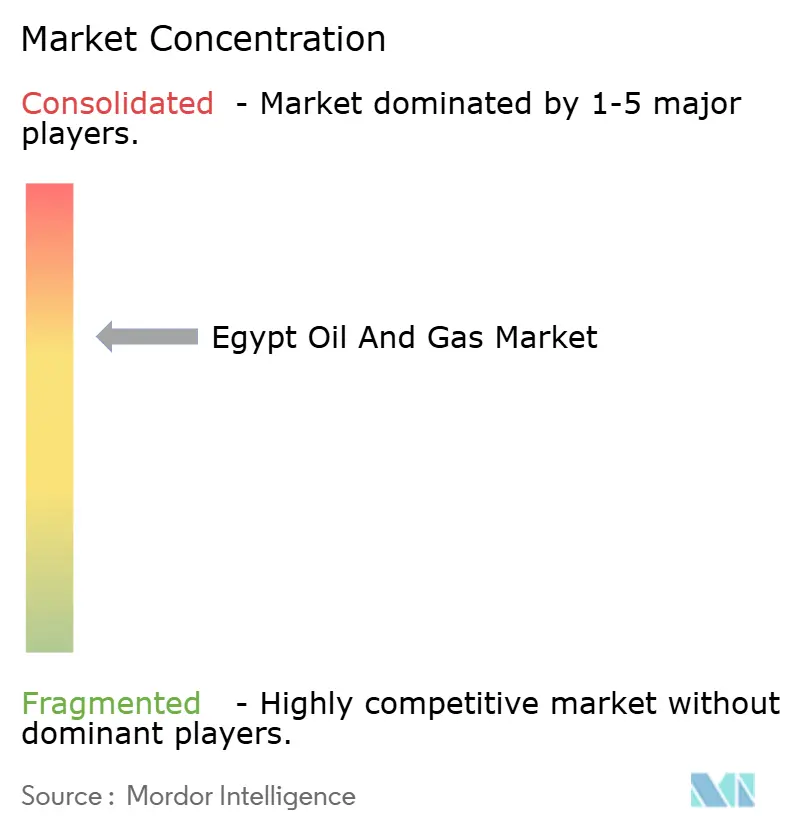
The Egyptian oil and gas market is moderately concentrated, with the top five operators—Eni, BP, Shell, Chevron, and Apache—collectively accounting for just under 60% of upstream output. State entities EGPC, EGAS, and GASCO retain sovereign stakes in most concessions and critical infrastructure, ensuring policy alignment and continuity. New entrants, notably Dragon Oil and Cheiron, leverage niche technologies and flexible governance structures to carve share in redeveloped mature fields.
Digitalization serves as the newest competitive battleground. Early adopters of AI-driven reservoir management report double-digit cost savings, a material edge in license bid evaluations. Partnerships between global service majors and local EPC houses facilitate technology assimilation, while the Egypt Upstream Gateway levels the data-access playing field for smaller bidders. Fiscal incentives further entice independents prepared to accept higher operating complexity in exchange for preferential profit-oil splits.
Environmental performance emerges as a differentiator amid tightening EU import standards. Operators are trialling flare-gas recovery, CCS pilots, and solar-powered modular rigs to reduce Scope 1 emissions. Those able to certify lower carbon intensity gain marketing advantage with European refiners and utility buyers, reinforcing brand equity and mitigating future tariff exposure. As a result, competitive dynamics increasingly combine volume metrics with carbon efficiency benchmarks.
Egypt Oil And Gas Industry Leaders
Eni SpA
BP PLC
Shell PLC
Apache Corp.
Chevron Corp.
- *Disclaimer: Major Players sorted in no particular order

Market Opportunities and Future Outlook
A visible opportunity set sits in offshore Mediterranean gas, where discovery-to-development cycles are being compressed through tie-backs into established infrastructure. In April 2026, Eni announced the Denise W-1 discovery in the Temsah Concession (reported at 2 Tcf of gas and 130 million barrels of condensates), highlighting incremental resource potential close to existing evacuation and processing networks. This supports whitespace for subsea, drilling, and brownfield integration services that reduce unit development costs versus greenfield builds, while also expanding the pool of prospects that can clear investment thresholds under Egypt's updated commercial terms and faster licensing workflows.
The near-term activity pipeline is also reinforced by government-led upstream programs and operator commitments that translate into tangible service demand across rigs, well services, and gas processing. The Ministry of Petroleum and Mineral Resources set a 2026 roadmap targeting 101 exploratory wells, and Agiba Petroleum accelerated phase two of the Meleiha gas treatment plant expansion to lift capacity to 100 MMcf/d, pointing to midstream and surface-facility debottlenecking needs. On the operator side, bp confirmed plans to invest USD 1.5 billion in natural gas exploration and development for fiscal year 2026/2027, while Shell and KUFPEC commenced a four-well Mediterranean drilling campaign, signaling opportunities for integrated project delivery, compression and processing upgrades, and reliability-focused maintenance aligned with Egypt's seasonal supply management requirements.
Recent Industry Developments
- April 2026: Eni announced the Denise W-1 gas and condensate discovery in the Temsah Concession offshore Egypt, with the find reported at about 2 Tcf of gas and 130 million barrels of associated condensates. The location supports infrastructure-led development options, strengthening the case for tie-backs and accelerating demand for subsea and drilling services linked to Mediterranean gas.
- July 2025: Shell reached a final investment decision for the Mina West gas discovery in the Egyptian Mediterranean, planning a subsea tie-back to existing West Delta Deep Marine infrastructure. The move emphasizes capital-efficient brownfield-led growth and expands the near-term pipeline of subsea, installation, and integration work.
- February 2025: bp announced the start of production from the Raven Second Development Phase offshore Egypt as part of the West Nile Delta project. Bringing incremental volumes online supports upstream revenue stability and sustains utilization for offshore operations, maintenance, and turn-around service providers.


Research Methodology Framework and Report Scope
Market Definition and Coverage
For this study, we define the Egypt oil and gas market as the value created from upstream, midstream, and downstream activities that support producing, moving, processing, and supplying crude oil, natural gas, and related outputs within Egypt.
Scope exclusions: The sizing excludes unrelated power generation and general mining activity that is not directly tied to oil and gas value-chain operations.
Segmentation Overview
- By Sector
- Upstream
- Midstream
- Downstream
- By Location
- Onshore
- Offshore
- By Asset Type
- Construction
- Maintenance and Turn-around
- Decommissioning
Data Sources, Market Sizing, and Validation
Desk Research
Desk work starts by mapping Egypt-specific supply, demand, and infrastructure signals that can be checked year over year. We rely on public statistical and operational series such as Ministry of Petroleum and Mineral Resources releases, EGPC and EGAS publications where available, IEA and OPEC country datasets, and BP Statistical Review style historical series (or similar public energy balance tables).
To turn those signals into a working model, we also pull context from sources such as the World Bank macro indicators, UN Comtrade trade flows for fuels and related products, shipping and terminal updates from port authorities, and peer-reviewed papers that explain field decline and recovery behavior. Company filings, investor presentations, and reputable press are then used to time major project awards, expansions, and shutdowns, which are later tested during interviews. In addition, we use paid subscriptions that cover company financials and intelligence, news and financials, patent databases, and where needed, shipment-level import and export records. These examples are not exhaustive, and many other public and paid sources were used to collect, validate, and clarify the final assumptions.
Primary Interviews and Surveys
Primary work is used to pressure-test the desk model, especially where public data is delayed or reported in different units. We spoke with a mix of operators, midstream and downstream stakeholders, EPC and maintenance service providers, and sector advisors, then checked inputs against both Egypt-focused and wider regional viewpoints to ensure assumptions reflected what is happening on the ground.
Distribution of primary research fieldwork respondents
| Company type | Respondent position |
|---|---|
| Top tier: 36% | CXOs: 18% |
| Mid tier: 45% | Functional/Unit leaders: 33% |
| Smaller Players: 19% | Managers: 49% |
Market-Sizing & Forecasting
Market sizing is built using a top-down and bottom-up mix, where the main totals are reconstructed from Egypt demand and activity indicators, and then checked with selective roll-ups. On the top-down side, oil consumption and refinery capacity signals, gas consumption trends, and upstream and midstream CAPEX patterns are translated into value using realistic cost and pricing assumptions that are consistent across the timeline.
In practice, a few market fingerprints guide the model each year, including liquid fuel throughput and capacity utilization, gas demand by large consuming sectors, average realized hydrocarbon price direction, project sanctioning pace, and service intensity for maintenance and turn-around during planned outages. Where direct data is patchy, gaps are handled by applying conservative utilization ranges and by carrying forward activity ratios that were confirmed in interviews, before revising if new projects or downtime events are validated.
For forecasting, scenario analysis is used so project timing, price direction, and utilization changes can be reflected without overfitting the numbers. The base case is anchored on what operators and contractors expect for field development, LNG and pipeline flows, and refinery operations, and the assumptions are translated into yearly volume and value steps that can be repeated and audited.
Data Validation & Update Cycle
We validate outputs by cross-checking the model against independent signals, such as published energy balance trends, announced capacity additions, and visible changes in export and import behavior. Outliers are reviewed by an analyst who rechecks unit conversions, timing, and pricing assumptions, and then the logic is tested again using interview feedback when a variance cannot be explained from public sources.
Before sign-off, the work goes through a multi-step internal review where totals are reconciled with the underlying drivers, and any large step changes are traced back to a specific event or assumption. Reports are refreshed annually, and interim updates are triggered when there are material events such as major project sanctions, outages, policy shifts, or large price shocks. Right before delivery, we run a final pass so clients receive the most current view supported by the same repeatable checks.
Mordor Intelligence's Egypt Oil and Gas Market Size Measured Against Other Published Estimates
Published market values for Egypt oil and gas do not always match because scope boundaries and the demand signals selected for modeling can differ. The benchmark table shows a relatively tight spread around the mid single-digit billions, which usually happens when sources agree on the country boundary but disagree on what parts of the value chain are monetized.
The table points to a key gap around what gets counted as market value versus what is treated as activity drivers. In Mordor Intelligence's model, upstream, midstream, and downstream are kept within one value view, and the translation from oil consumption and refining capacity, gas consumption, and CAPEX into USD is refreshed with consistent unit conversions and timing, instead of mixing volume-only indicators with value totals.
Benchmark comparison
| Source | Market Size | Gaps in Research Methodology |
|---|---|---|
| Mordor Intelligence | USD 7.54 B (2025) | |
| Industry Data Publisher A | USD 7.26 B (2023) | Uses an earlier base year and a slower growth path, and the published scope description leans more on broad segment labels without showing how activity indicators are converted into USD year by year. |
| Consulting Publisher B | USD 7.50 B (2024) | Scenario-led framing is visible, but the headline number appears sensitive to how midstream and downstream revenues are treated, and to whether project timing is recognized at award, spend, or commissioning. |
Overall, the difference between figures is mainly explained by timing (base year) and how value is assigned to activity across the chain, rather than by a disagreement that Egypt has a large oil and gas footprint. By keeping inputs traceable to a few repeatable signals and then rechecking the translation to USD during validation, the final number stays practical to defend and update.


Key Questions Answered in the Report
What is the projected value of the Egypt oil and gas market in 2031?
The market is expected to reach USD 11.18 billion by 2031 on a 6.78% CAGR.
Which segment leads spending within Egyptian oil and gas?
Upstream dominates with a 70.32% revenue share in 2025.
How fast is offshore activity growing relative to onshore?
Offshore revenue is forecast to increase at a 7.26% CAGR, outpacing onshore’s growth rate.
What fiscal reforms are attracting foreign investment?
Reduced signature bonuses, accelerated depreciation and improved cost-recovery terms have lifted project IRRs by roughly 200-300 basis points.
How is Egypt addressing gas demand from the power sector?
The state has connected 9 million homes to the gas grid and relies on gas-fired plants for 75-80% of power generation, even as renewables rise.
Which digital tools are reshaping Egyptian upstream operations?
AI-driven reservoir modeling, digital twins and the Egypt Upstream Gateway are lowering exploration risk and boosting recovery factors.
Page last updated on:


 Your data is secure and never sold or shared.


