Market Overview
| Study Period | 2020 - 2031 |
|---|---|
| Forecast Data Period | 2026 - 2031 |
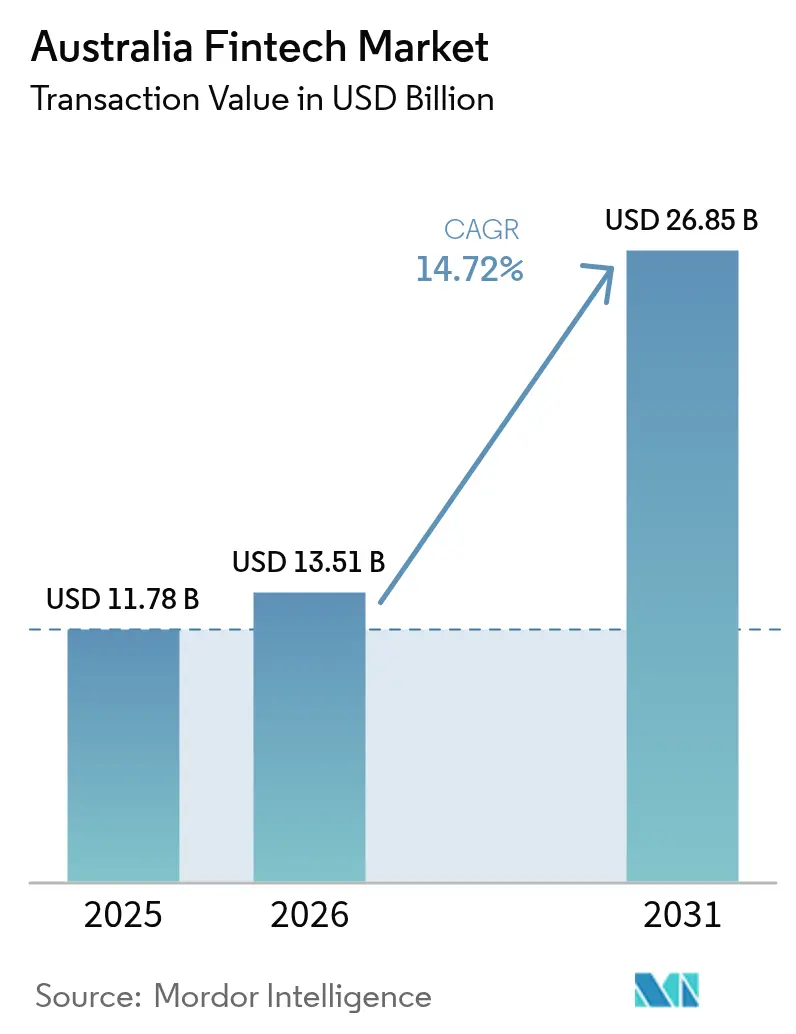
| Base Year Market Size (2025) | USD 11.78 Billion |
| Market Size (2026) | USD 13.51 Billion |
| Market Size (2031) | USD 26.85 Billion |
| Growth Rate (2026 - 2031) | 14.72% CAGR |
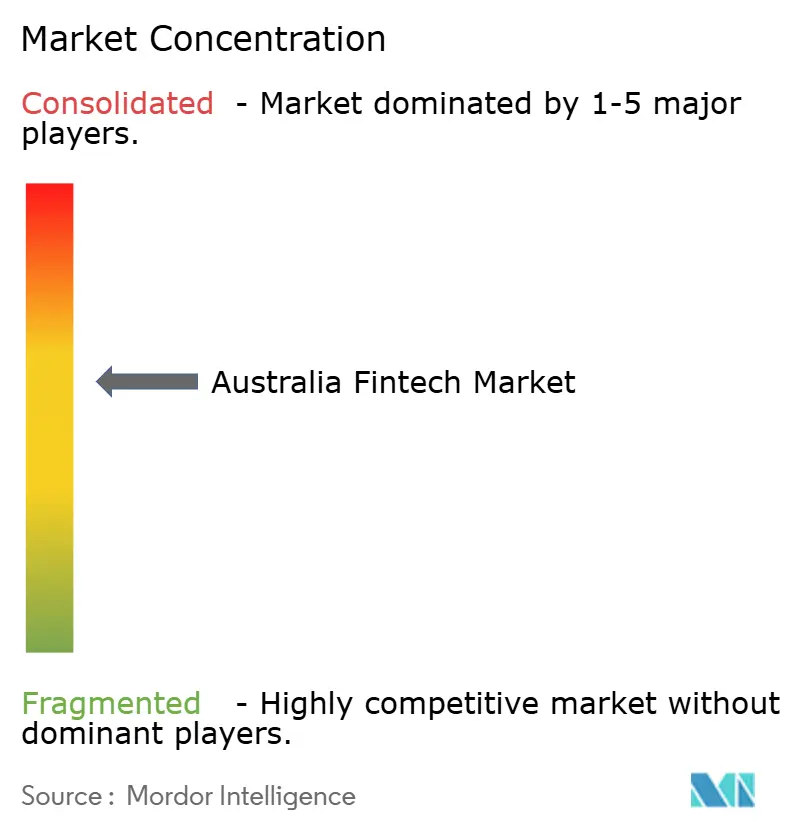
| Market Concentration | Medium |
Major Players *Disclaimer: Major Players sorted in no particular order Image © Mordor Intelligence. Reuse requires attribution under CC BY 4.0. | |
Australia Fintech Market Analysis by Mordor Intelligence
The Australia fintech market size was valued at USD 11.78 billion in 2025 and estimated to grow from USD 13.51 billion in 2026 to reach USD 26.85 billion by 2031, at a CAGR of 14.72% during the forecast period (2026-2031). Rapid uptake of real-time account-to-account payments, supportive data-sharing regulation, and a persistent small-business credit gap are nurturing sustained deal flow and product launches. Consolidation among payment specialists is accelerating as large incumbents acquire niche ventures to secure capability and scale. Consumer appetite for cash-free and mobile experiences remains the strongest demand signal, while government investment in open banking technology lowers the cost of entry for data-driven newcomers. Intensifying competition from global platforms is pushing local firms to prioritize embedded finance and cross-border functionality.
Key Report Takeaways
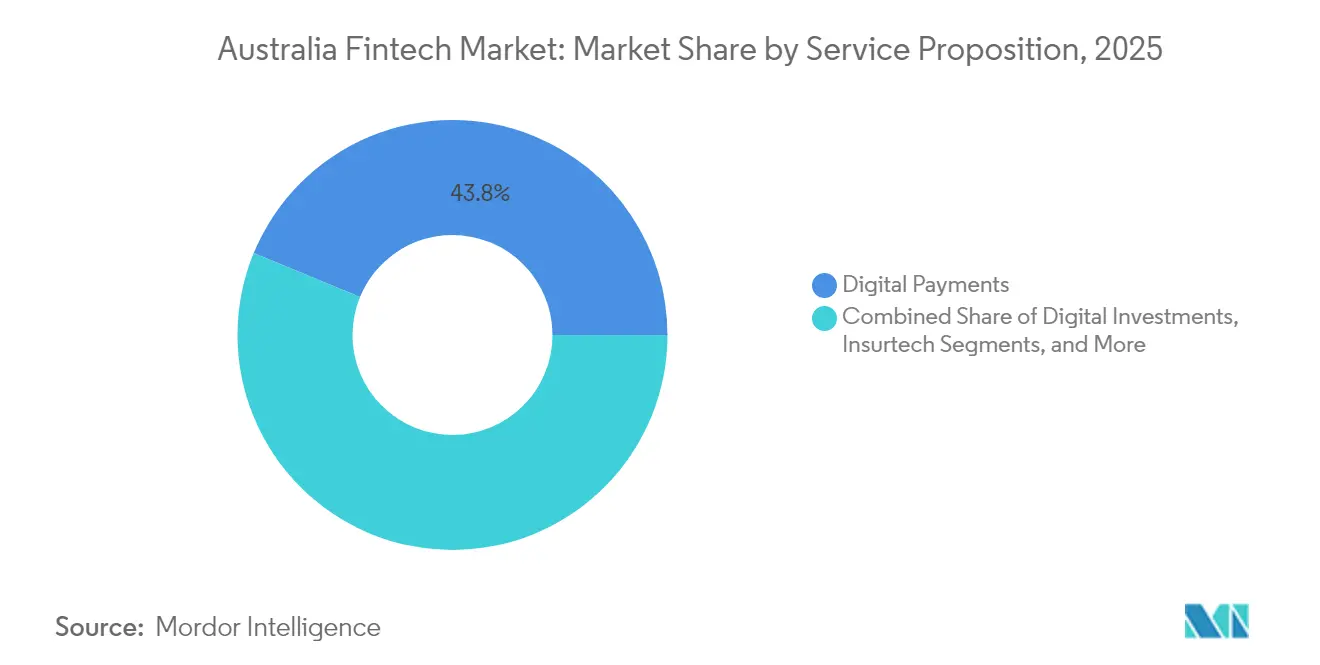
- By service proposition, digital payments led with a 43.78% share of the Australia fintech market in 2025, while neobanking is projected to expand at an 18.11% CAGR through 2031.
- By end-user, the business segment held 55.63% of the Australia fintech market share in 2025; retail is expected to advance at a 16.88% CAGR through 2031.
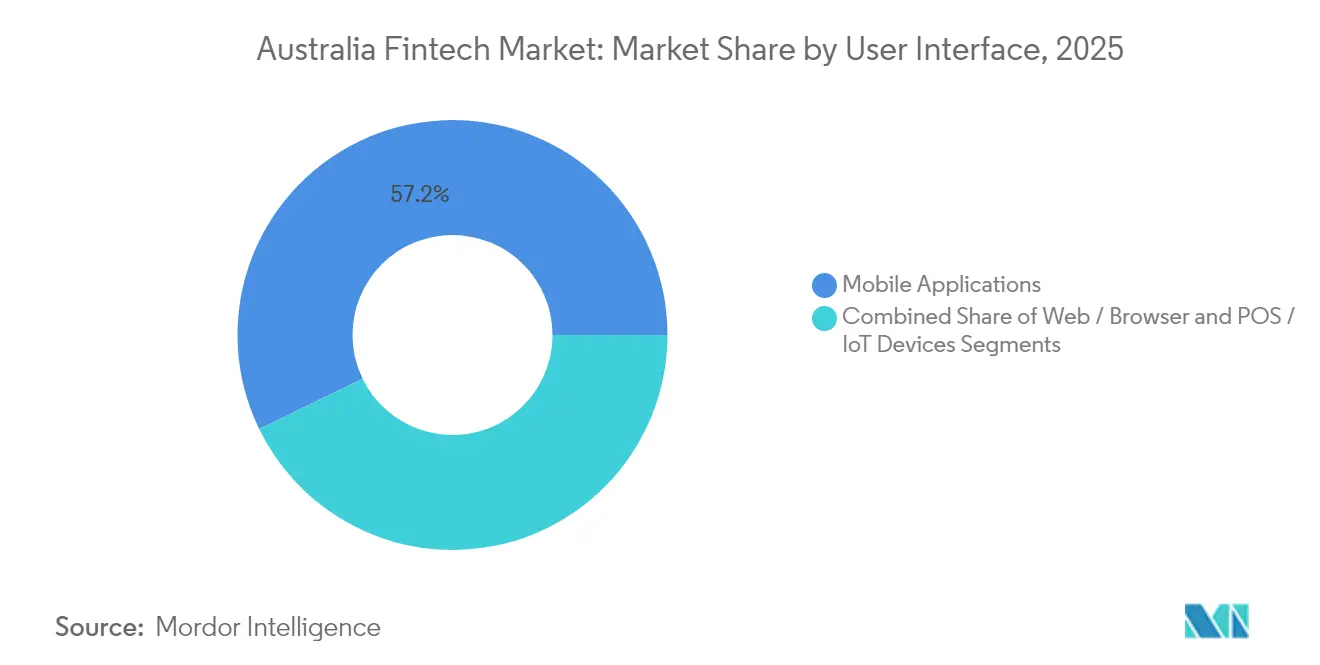
- By user interface, mobile applications accounted for 57.21% of the Australia fintech market size in 2025 and are projected to grow at a 19.05% CAGR to 2031.
Note: Market size and forecast figures in this report are generated using Mordor Intelligence’s proprietary estimation framework, updated with the latest available data and insights as of 2026.
Australia Fintech Market Trends and Insights
Drivers Impact Analysis*
| Driver | (~) % Impact on CAGR Forecast | Geographic Relevance | Impact Timeline |
|---|---|---|---|
| Rapid uptake of real-time payments via NPP & PayTo | +2.5% | National; strongest in metropolitan areas | Medium term (2–4 years) |
| Phase-3 Consumer Data Right APIs enabling embedded finance | +1.8% | National; concentrated in Sydney and Melbourne | Medium term (2–4 years) |
| Persistent SME credit shortfall boosting alternative lending | +1.2% | National; higher in regional business centres | Short term (≤ 2 years) |
| Surge in BNPL volumes tied to regional e-commerce growth | +1.5% | Regional Australia | Short term (≤ 2 years) |
| Government push for cashless welfare via digital prepaid cards | +0.8% | National; higher in remote and Indigenous communities | Medium term (2–4 years) |
| Wealth migration to SMSFs catalysing robo-advisory uptake | +1.0% | National; higher-income demographics | Long term (≥ 4 years) |
| Source: Mordor Intelligence | |||
Rapid uptake of real-time payments
Monthly NPP volumes surpass 100 million, and one in three transfers now ride the network, creating a fertile market for payment-processing fintechs[1]Fintech Australia, “Annual Fintech Ecosystem Report 2024,” fintechaustralia.org.au. More than 90% of retail transaction accounts are PayTo-enabled, which is essential as legacy rails are scheduled for retirement by 2030. Lower settlement latency improves liquidity for merchants and lubricates embedded-finance models, supporting revenue expansion across the Australia fintech market.
Phase-3 Consumer Data Right APIs
Open banking call volumes have grown at a 30% compounded monthly rate since 2020, and the ecosystem now serves 226,000 consumers through 300,000 live data arrangements[2]Australian Competition and Consumer Commission, “Consumer Data Right Implementation Report 2024,” accc.gov.au. The federal budget allocates AUD 88.8 million to fortify CDR operations and cyber-resilience. Superior data quality—merchant descriptors appear in 52% of CDR feeds versus 31.7% in screen-scraped feeds—enables richer analytics and personalization, lifting customer engagement across the Australia fintech market.
Persistent SME credit shortfall
Bank risk appetites tightened through 2024, yet asset-finance requests climbed 7.8% as SMEs sought funding alternatives. Platforms such as Prospa and OnDeck leverage automated underwriting to address the USD 20 billion funding gap, unlocking new fee pools inside the Australia fintech market.
Surge in BNPL volumes
BNPL providers processed USD 19 billion in 2022/23, up 13%, with regional customers exhibiting the fastest uptake[3]Reserve Bank of Australia, “Consumer Payments Survey 2023,” rba.gov.au. Research shows BNPL usage lifts online spending by 6.42% over cards, driving merchant adoption. Afterpay alone linked 129,000 merchants to 3.5 million active users in 2023. Incremental volumes are widening the addressable revenue inside the Australia fintech market.
Restraints Impact Analysis*
| Restraint | (~) % Impact on CAGR Forecast | Geographic Relevance | Impact Timeline |
|---|---|---|---|
| ASIC fee caps on BNPL providers | -1.2% | National; strongest on smaller BNPL firms | Short term (≤ 2 years) |
| Escalating cyber-incident insurance premiums | -0.9% | National; data-intensive segments | Medium term (2–4 years) |
| Rising cost of CDR Version 4 compliance | -0.7% | National; early-stage fintechs | Short term (≤ 2 years) |
| Venture-capital pull-back in late-stage rounds | -1.0% | National; concentrated in Sydney and Melbourne | Medium term (2–4 years) |
| Source: Mordor Intelligence | |||
ASIC fee caps on BNPL
Legislation that requires BNPL firms to hold credit licences by June 2025 compresses fee headroom and hikes compliance costs. Scale players can absorb the shift, yet smaller entrants may exit, trimming short-term growth in the Australia fintech market.
Escalating cyber-incident insurance premiums
Cyber claims represent 41% of fintech insurance cases, and premiums now account for up to 15% of operating costs. Average breach losses of USD 2.92 million intensify scrutiny, favoring well-capitalized platforms and nudging fragile firms toward partnership or acquisition, which moderates risk-adjusted expansion in the Australia fintech market.
*Our forecasts treat driver/restraint impacts as directional, not additive. The impact forecasts reflect baseline growth, mix effects, and variable interactions.
Segment Analysis
By Service Proposition: Digital payments dominate while neobanking accelerates
Digital payments held 43.78% of the Australia fintech market size in 2025. Penetration of contactless wallets and PayTo mandates has put Australia alongside China in cash displacement. Merchant demand for unified commerce solutions and loyalty integration keeps transaction values climbing. Competitive intensity is high, yet incumbent banks still outsource many orchestration layers, giving specialists room to scale.
Neobanking revenue is smaller but is projected to widen at an 18.11% CAGR to 2031 as digital-only players secure restricted authorized deposit-taking licences. Product roadmaps now include budgeting tools and green loans, reinforcing customer stickiness. Profitability hinges on deposit spreads and fee income from partner ecosystems. Rising consumer trust in branchless banking will help the segment lift its share in the Australia fintech market.


By End-User: Businesses drive volume and growth
Businesses accounted for 55.63% of the Australia fintech market share in 2025. Pandemic-accelerated digitization forced SMEs to replace spreadsheet processes with API-based workflows. Supplier-initiated payments and instant payroll continue to expand use cases.
The retail segment is expected to grow at 16.88% CAGR over the forecast period. More than 72% of Australians shop online and spend USD 2,287 per person each year. BNPL, micro-investing, and automated budgeting applications dominate app-store rankings. Embedded finance lets retailers monetize customer data by bundling savings and insurance products within loyalty apps, blurring end-user boundaries across the Australia fintech market.
By User Interface: Mobile applications rule the experience
Mobile applications captured 57.21% of the Australia fintech market size in 2025. Smartphone penetration exceeds 92%, and consumers make 35% of card purchases through mobile wallets. Biometric login and push-notification workflows deliver real-time financial control, keeping the average session length high.
Web interfaces remain necessary for heavy data tasks such as treasury management and tax reporting. Point-of-sale and IoT devices expand as retailers deploy smart terminals that auto-reconcile payouts. Voice-first interfaces and wearables are in pilot phase, signaling the next adoption frontier inside the Australia fintech market.
Geography Analysis
New South Wales and Victoria together housed 80% of the nation’s fintech ventures in 2024, reflecting proximity to capital markets, regulators, and talent pools. Sydney benefits from the Australian Securities Exchange and the local presence of all major banks. Melbourne draws on a deep tech workforce plus government grants through the Victorian Innovation Hub, sustaining large clusters in payments and wealth-tech. Queensland centres such as Brisbane and the Gold Coast are cultivating regtech and insurtech niches, attracted by lower overheads and growing startup accelerators.
South Australia leverages the Lot Fourteen precinct in Adelaide to target defence-aligned fintech cybersecurity, broadening the regional footprint of the Australia fintech market. Improved fibre and 5G rollout now enable rural communities to adopt BNPL and mobile banking, eroding legacy access gaps. As a result, fintech penetration in outer regional areas climbed during 2024, adding tens of thousands of new users and reinforcing inclusive growth across the Australia fintech industry.
Competitive Landscape
The Australian fintech market shows moderate concentration. Payment specialists, who form the earliest cohort, now command scale benefits. Afterpay, Zip Co, and EFTPOS-backed Australian Payments Plus process a significant share of consumer outlays. Block’s takeover of Afterpay in 2022 illustrated the premium placed on domestic distribution channels by global players. Cross-border platform Airwallex partnered with ANZ in 2024 to embed multicurrency wallets within business accounts, highlighting demand for Banking-as-a-Service pipes.
Alternative lenders Prospa and Moula automate credit scoring with cloud-accounting feeds, easing the SME funding gap. Meanwhile, incumbents NAB and CBA launched their own BNPL lines to retain customers. Venture funding cooled in mid-2023 yet recovered late 2024 as open banking opportunities de-risked revenue paths. Strategic exits surged, with Banking Circle acquiring Australian Settlements Limited in January 2025 to bolster real-time clearing. Midsize players face a build-or-partner choice as compliance overheads climb and cyber insurance premiums squeeze margins, driving further consolidation inside the Australian fintech market.
Australia Fintech Industry Leaders
Afterpay (Block Inc.)
Airwallex
Zip Co
Tyro Payments
Prospa
- *Disclaimer: Major Players sorted in no particular order

Recent Industry Developments
- January 2025: Banking Circle announced the acquisition of Australian Settlements Limited, signaling increased consolidation in the payments infrastructure sector.
- December 2024: Kobble launched a new embedded finance platform in Australia, expanding the capabilities available to businesses integrating financial services into their offerings.
- October 2024: Banked acquired Australian fintech Waave and partnered with Chemist Warehouse to launch Pay by Bank solutions in early 2025.
- March 2024: Deputy reached unicorn status with a valuation above USD 1 billion, becoming Australia’s first tech unicorn since early 2022.


Research Methodology Framework and Report Scope
Market Definitions and Key Coverage
Our study treats the Australia fintech market as the total annual gross revenue and fee-based transaction value generated by digital payments, digital lending, digital investment, insurtech, and neobanking platforms that are licensed or passported to serve Australian residents, regardless of legal domicile. Platforms that only provide back-office software without holding customer money are excluded from this revenue pool.
Scope exclusion: point-of-sale hardware, generic core-bank IT services, and professional advisory fees remain outside our sizing.
Segmentation Overview
- By Service Proposition
- Digital Payments
- Digital Lending and Financing
- Digital Investments
- Insurtech
- Neobanking
- By End-User
- Retail
- Businesses
- By User Interface
- Mobile Applications
- Web / Browser
- POS / IoT Devices
Detailed Research Methodology and Data Validation
Primary Research
Mordor analysts held structured calls with founders of payment aggregators, executives at two mid-tier banks that run partner neobanks, and compliance leads at a regional insurer using embedded APIs. Interviews in Sydney, Melbourne, and Brisbane clarified average take-rates, evolving interchange caps, and likely adoption timelines for open-banking pipes, filling gaps that documents alone could not close.
Desk Research
We sifted through open data from sources such as the Australian Prudential Regulation Authority, Reserve Bank of Australia Payments System Statistics, the Australian Securities & Investments Commission regulatory sandbox releases, and FinTech Australia membership insights. Broader context came from the OECD Digital Economy Outlook, World Bank Global Findex, and parliamentary committee papers on the Consumer Data Right. Company filings, IPO prospectuses, and select articles accessed through D&B Hoovers and Dow Jones Factiva added issuer-level color.
Historical payment volume tables, smartphone penetration records, and state-wise household broadband adoption helped anchor usage trends, while Austrade export dashboards and customs data provided a check on cross-border fee flows. The sources listed illustrate our desk effort; many additional public and paid references supported data collection, validation, and clarification.
Market-Sizing & Forecasting
We start with a top-down reconstruction that aligns Reserve Bank consumer payment values with estimated fintech penetration by channel; these penetration ratios are derived from survey responses and card-scheme release notes. Selective bottom-up roll-ups of sampled provider revenue (Afterpay, Airwallex, local digital lenders) act as a reasonableness cross-check before totals are adjusted. Key model drivers include: smartphone adoption rate, non-cash transaction per capita, active Consumer Data Right consents, SME credit demand, and venture funding inflows.
A multivariate regression linking revenue to the above drivers plus GDP growth projects the 2026-2030 trajectory; ARIMA smoothing is applied where driver series are volatile. When company data are missing, gaps are bridged by median take-rate assumptions vetted with interviewees.
Data Validation & Update Cycle
Outputs run through variance checks against independent payment volume releases and Austrac reporting, then undergo peer review by a senior analyst. Reports refresh annually, and we trigger interim updates when material events, such as a new interchange ruling, shift key inputs.
Why Our Australia Fintech Baseline Commands Reliability
Published estimates often diverge because firms slice the market by differing revenue definitions, conversion rates, or update cadences, and because some include peripheral tech services that Mordor intentionally excludes.
Key gap drivers here are varying inclusion of enterprise SaaS income, the inflation of figures by gross payment volume instead of net revenue, and one-off acquisition deal values being folded into market size by other publishers.
Benchmark comparison
| Market Size | Anonymized source | Primary gap driver |
|---|---|---|
| USD 11.78 B (2025) | Mordor Intelligence | - |
| USD 3.72 B (2023) | Regional Consultancy A | excludes neobanks; limited to AI, RPA sub-segments |
| AUD 45 B (2023) | Trade Journal B | quotes full financial-services sector, not fintech revenue only |
| USD 33.99 B (2033) | Global Consultancy C | uses forward deal value and forecast payment volume without netting fees |
In sum, by anchoring our base year to verifiable revenue streams and reconciling both top-down and sampled bottom-up views, Mordor delivers a balanced, transparent baseline that decision-makers can replicate and stress-test with confidence.


Key Questions Answered in the Report
What is the current size of the Australia fintech market?
The Australia fintech market size stands at USD 13.51 billion in 2026.
How fast is the market expected to grow?
The market is projected to expand to USD 26.85 billion by 2031, reflecting a 14.72% CAGR.
Which service proposition holds the largest share?
Digital payments lead with 43.78% of 2025 revenue, driven by contactless and mobile adoption.
Why are real-time payments important for growth?
Real-time rails such as NPP and PayTo improve liquidity, reduce fees, and open new embedded-finance use cases, adding an estimated +2.5% to the forecast CAGR.
How does regulation influence Australia’s fintech evolution?
Open banking APIs under the Consumer Data Right foster bank-fintech partnerships, while new BNPL license rules raise compliance costs yet enhance consumer protection.
What challenges could slow market expansion?
Escalating cyber-insurance premiums and tighter BNPL fee caps may absorb margins and limit smaller players’ ability to scale.
Page last updated on:


