Australia OOH And DOOH Market Size and Share
Market Overview
| Study Period | 2020 - 2031 |
|---|---|
| Forecast Data Period | 2026 - 2031 |
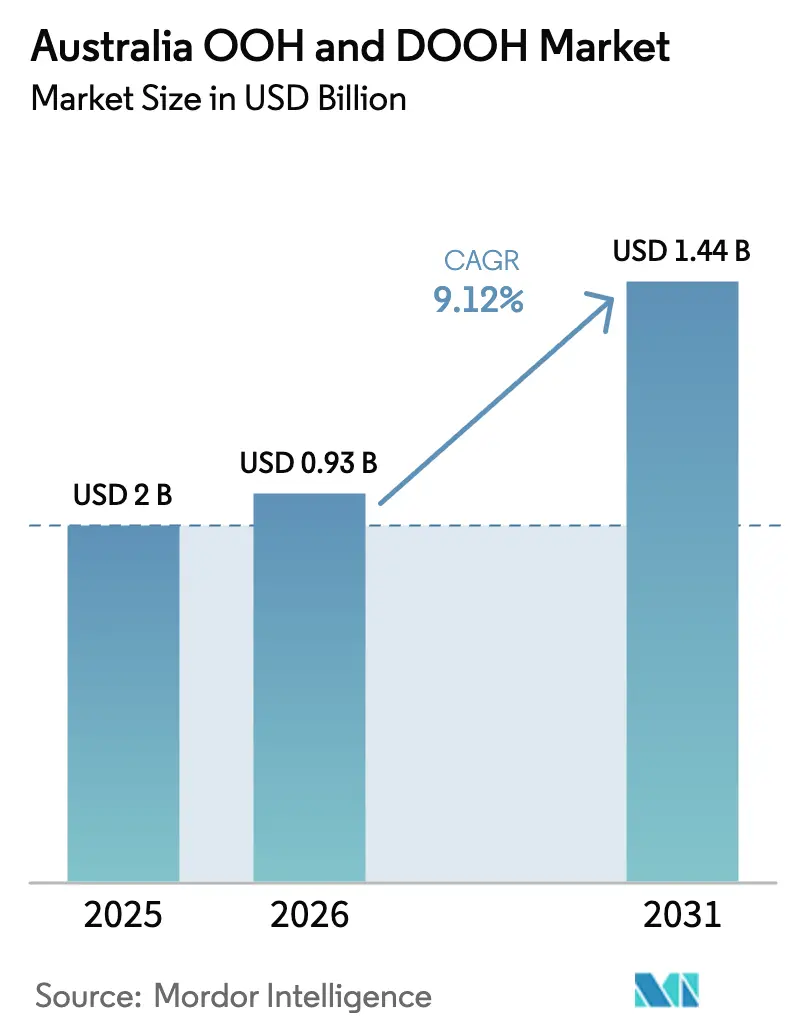
| Base Year Market Size (2025) | USD 2.0 Billion |
| Market Size (2026) | USD 0.93 Billion |
| Market Size (2031) | USD 1.44 Billion |
| Growth Rate (2026 - 2031) | 9.12% CAGR |
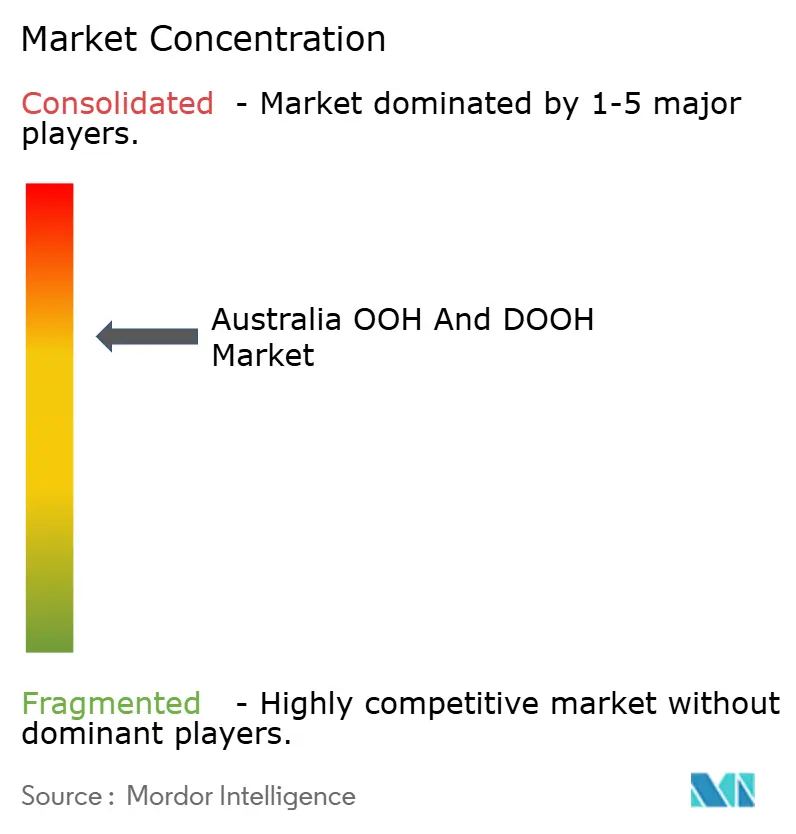
| Market Concentration | Medium |
Major Players*Disclaimer: Major Players sorted in no particular order Image © Mordor Intelligence. Reuse requires attribution under CC BY 4.0. | |
Australia OOH And DOOH Market Analysis by Mordor Intelligence
The Australia OOH and DOOH market size was valued at USD 850 million in 2025 and estimated to grow from USD 927.52 million in 2026 to reach USD 1435.4 million by 2031, at a CAGR of 9.12% during the forecast period (2026-2031). Strong digital uptake, programmatic trading momentum, and renewed advertiser confidence are aligning to lift both revenue density and inventory utilisation rates across metropolitan corridors. Large format LED roll-outs inside smart-city precincts, paired with consistent audience verification, are persuading brand managers to re-allocate budgets from linear television toward high-impact digital street furniture. At the same time, the expected launch of the industry-backed MOVE 2.0 measurement platform in 2025 is improving campaign accountability and encouraging multinationals to treat Australia as a global test bed for real-time creative optimisation. Intensifying infrastructure spending ahead of the 2032 Brisbane Olympics, plus the rapid convergence of retail media networks with place-based screens, provides additional upside for demand and inventory expansion.
Key Report Takeaways
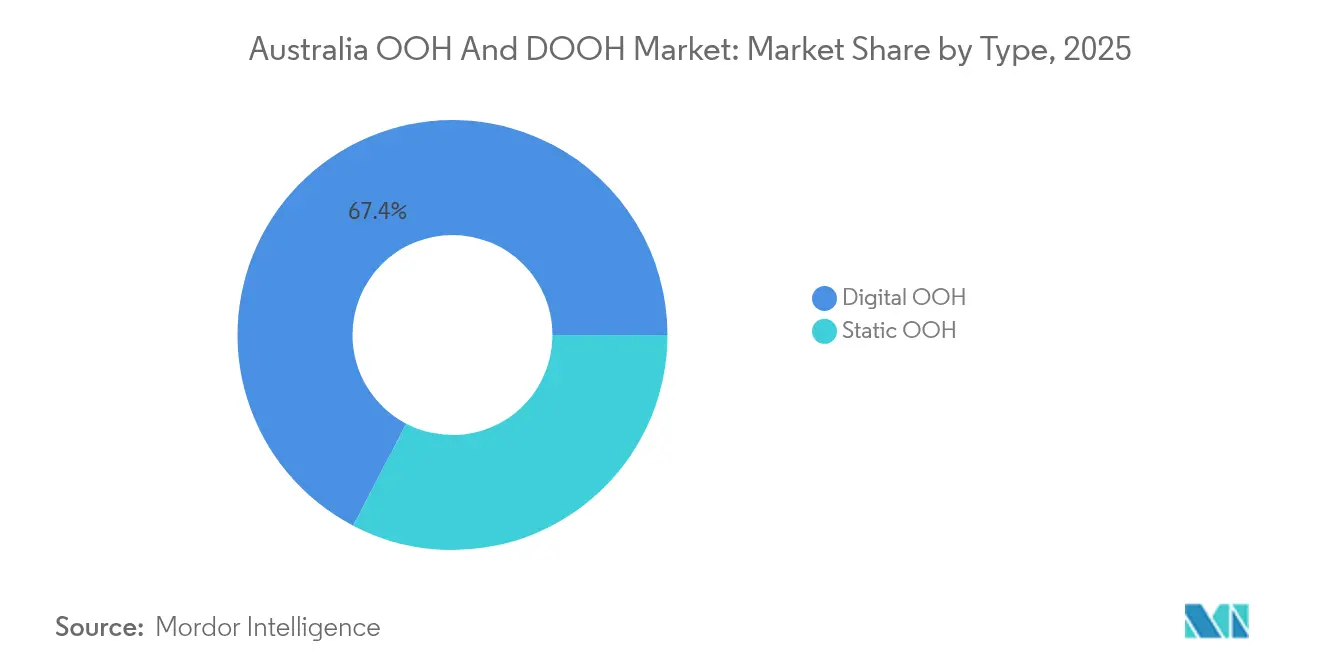
- By type, Digital OOH led with 67.35% revenue share in 2025, while programmatic OOH is projected to expand at an 11.1% CAGR through 2031.
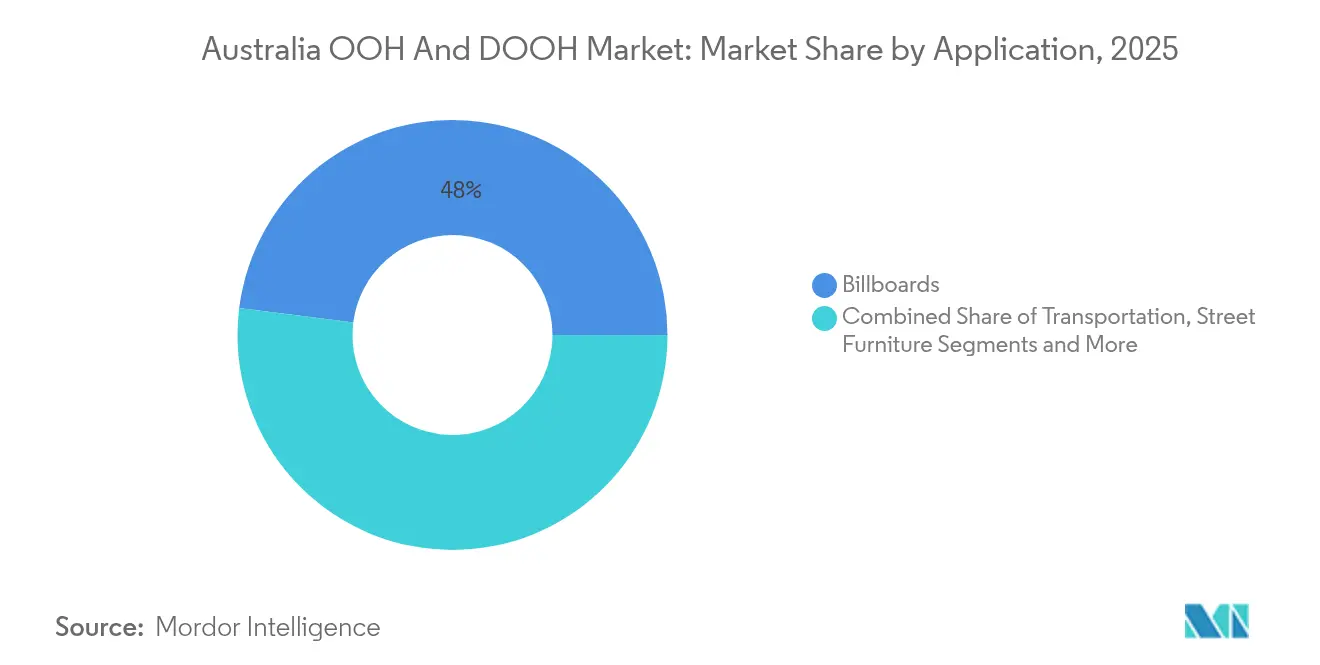
- By application, billboards held 48.00% of the Australia OOH and DOOH market share in 2025 and airports are forecast to expand at a 11.8% CAGR to 2031.
- By end-user, retail and consumer goods commanded 28.60% share of the Australia OOH and DOOH market size in 2025, with healthcare advancing at an 11.0% CAGR through 2031.
- By geography, New South Wales captured 34.60% revenue share in 2025; Queensland is projected to lead growth at a 10.4% CAGR to 2031.
Note: Market size and forecast figures in this report are generated using Mordor Intelligence’s proprietary estimation framework, updated with the latest available data and insights as of 2026.
Australia OOH And DOOH Market Trends and Insights
Drivers Impact Analysis*
| Driver | ( ~ ) % Impact on CAGR Forecast | Geographic Relevance | Impact Timeline |
|---|---|---|---|
| Smart-city led shift toward digital formats | +2.10% | Sydney, Melbourne, Brisbane metro corridors | Medium term (2-4 years) |
| Real-time optimisation via connected screens | +1.80% | National, strongest in tier-one cities | Short term (≤ 2 years) |
| Expansion of programmatic OOH platforms | +1.50% | New South Wales and Victoria | Medium term (2-4 years) |
| Mobile-based post-exposure attribution | +1.30% | Urban centres with dense smartphone penetration | Medium term (2-4 years) |
| Source: Mordor Intelligence | |||
Ongoing Shift Toward Digital Advertising Driven by Smart-City Projects
Public–private partnerships are installing connected street furniture, interactive kiosks, and large-format LED façades that align with municipal mobility goals. [1]City of Sydney, Economic Development Strategy 2025–2035, City of Sydney, cityofsydney.nsw.gov.au In Sydney alone, mixed-use redevelopments such as Tech Central reserve premium DOOH inventory that blends into streetscapes without visual clutter. Architectural deployments—like the Australian Museum’s transparent LED wall—reposition screens as permanent digital canvases rather than bolt-on billboards. Advertisers secure higher dwell-time opportunities, and municipal leaders secure data-rich, way-finding assets that enhance commuter experience. The dual value proposition accelerates adoption across municipal tenders, underscoring why digital already commands 71% of total OOH spend in the Australia OOH and DOOH market.
High Campaign Flexibility & Real-Time Optimisation via Connected Screens
Dynamic creative systems allow marketers to sequence messaging against live weather, event, and traffic triggers, shifting OOH from one-to-many broadcasting to context-aware storytelling. Healthcare brands now pivot messaging around pollen counts during spring or UV indices in summer, driving double-digit recall improvements over static placements. Integrated buying desks run cross-channel experiments that unify mobile IDs and DOOH impressions, lifting reach without frequency fatigue. The resulting agility is pulling mid-funnel budget from social platforms, strengthening revenue resilience inside the Australia OOH and DOOH market even as broader ad-spend cycles fluctuate.
Growth of Programmatic OOH Platforms in Australia
Automated pipes simplify trading across thousands of screens, collapsing transaction costs and supporting data-layer synchronisation with omnichannel DSPs. Vistar Media logged 65% growth in 2023 as agencies route larger insertion orders through its exchange, while local operators expect programmatic’s share of DOOH sales to reach 30% by 2027. Standardised creative templates and biddable inventory pools reduce campaign lead-times from weeks to hours, encouraging performance-oriented verticals—such as e-commerce pure plays—to commit incremental spend. These efficiencies expand the Australia OOH and DOOH market’s buyer universe beyond traditional brand advertisers.
Integration of Mobile Location Data for Post-Exposure Attribution
Linking anonymised handset pings to screen exposure data closes the loop between upper-funnel impressions and footfall or e-commerce outcomes. National smartphone penetration above 90% provides a robust sample frame, allowing brands to quantify lift in store visits within specific catchments. As MOVE 2.0 integrates these signals, planners gain a unified reach-and-frequency view across broadcast, online video, and DOOH. Privacy amendments expected after the 2025 federal election, however, compel operators to maintain consent frameworks that satisfy evolving compliance thresholds.
Restraints Impact Analysis*
| Restraints | ( ~ ) % Impact on CAGR Forecast | Geographic Relevance | Impact Timeline |
|---|---|---|---|
| Measurement-standardisation gaps | –1.6% | Cross-format national buys | Medium term (2-4 years) |
| Rising installation and power costs in regional areas | –1.4% | Queensland and Western Australia | Short term (≤ 2 years) |
| Source: Mordor Intelligence | |||
Measurement-Standardisation Gaps Limiting National Budgets
Inconsistent audience metrics force holding-company buyers to hedge allocations toward channels with unified measurement such as online video. Although independent verification has become mainstream since 2021, uncertainty persists for multi-format flighting where roadside, retail, and transit panels require differing impression multipliers. The Outdoor Media Association is countering the issue through its USD 17 million MOVE 2.0 overhaul, promising comparable reach curves across static and dynamic screens by 2025. Until post-campaign auditing is perceived as seamless as viewability tags online, a segment of multinational budgets will remain under-allocated within the Australia OOH and DOOH market.
Rising Screen-Installation & Power Costs in Regional Locations
Expanding digital footprints outside metropolitan postcodes requires new grid connections, ruggedised hardware, and larger service fleets, inflating per-site economics by double-digit percentages versus city roll-outs. Queensland and Western Australia face wide spatial dispersions that elevate logistics and maintenance overheads. Operators are trialling solar-driven LED configurations and shifting toward lighter aluminium structures to offset weight-related freight surcharges, yet cost curves remain steep. Power price volatility further pressures gross margins, despite initiatives like oOh!media’s conversion of 70% of panels to renewable sources. The capital intensity dampens near-term expansion into sparsely populated corridors, moderating overall growth within the Australia OOH and DOOH market.
*Our forecasts treat driver/restraint impacts as directional, not additive. The impact forecasts reflect baseline growth, mix effects, and variable interactions.
Segment Analysis
By Type: Digital Dominance Reshapes Landscape
Digital OOH controlled 67.35% of spending in 2025, equating to the largest slice of the Australia OOH and DOOH market size at USD 572.5 million. Programmatic-enabled panels are capturing an incremental share each month, propelling DOOH penetration to 74% by mid-2024. Advertisers attribute this acceleration to data infusion, creative dynamism, and the ease of cross-channel coordination with mobile DSPs. Capital expenditure cycles are shifting toward high-brightness LED retrofits, enabling operators to retire legacy lightbox stock, strengthen energy efficiency, and unlock smaller pitch densities for 4K content.
Programmatic is the fastest-growing subtype, advancing at an 11.1% CAGR through 2031 and forecast to influence nearly one-third of DOOH bookings by 2027. Both supply-side platforms and demand-side partners integrate location data, live foot-traffic feeds, and POS conversion files, deepening value attribution compared to vanilla loop-based schedules. Static OOH remains relevant where municipal codes restrict LED usage or where cost-of-capital thresholds are prohibitive in regional corridors. Yet the share contraction of paper and vinyl formats continues unabated as landlords push for higher rent multipliers deliverable only through digital upgrades within the Australia OOH and DOOH market.


By Application: Billboards Lead While Airports Soar
Billboards accounted for 48.00% of gross media spend in 2025, half of the total Australia OOH and DOOH market size. Operators continue to digitise premium gantries along the M1 and WestConnex, justifying higher CPMs through dynamic copy rotation and day-part road-traffic modelling. However, planning authorities in Melbourne have tabled stricter curfews on illuminated signage to curb light pollution, prompting a shift toward automated dimming protocols and shorter copy cycles after 22:00. These regulatory headwinds encourage media owners to diversify into transit and place-based assets that carry fewer luminosity constraints.
Under the Transportation segment, the Airports represent the fastest-growing application cluster, with a 11.8% CAGR through 2031, underpinned by Sydney Airport’s forecast to exceed 50 million passengers annually. JCDecaux’s recent contract renewal secures exclusive rights for new digital large-format sites, in-terminal programmatic screens, and data-enabled audience segmentation tools that monetise traveller dwell-time. Street furniture maintains relevance where councils seek ad-funded civic amenities such as bus shelters and public WIFI kiosks, while place-based networks expand inside coworking hubs and university campuses.
By End-User: Retail Dominates While Healthcare Accelerates
Retail and consumer goods secured 28.60% of 2025 revenue, translating to the largest slice of the Australia OOH and DOOH market share for vertical spend at USD 243.1 million. The segment exploits DOOH’s proximity to point-of-sale triggers, and supermarket groups such as Woolworths leverage linked floor-based panels to drive aisle visitation. oOh!media’s “reo” division packages external roadside boards with in-store shopper media, enabling unified frequency capping and incremental reach across omnichannel journeys.
Healthcare is scaling at an 11.0% CAGR until 2031, edging the vertical toward a double-digit share of the Australia OOH and DOOH market size by decade-end. Demand stems from privacy-safe reach delivered via public environments where contextually relevant wellbeing messages perform strongly. Campaigns like HCF’s “Value Ads” allocate 60% airtime to real member stories, boosting brand trust ahead of private health insurance renewal cycles. AI-driven optimisation engines, profiled in Wolters Kluwer’s health technology outlook, further tailor dosage reminders and preventive care tips on commuter paths. Automotive, BFSI, and telco verticals retain meaningful presence, though growth trajectories differ as each evaluates shifting customer journey touchpoints across the evolving Australia OOH and DOOH market.
Geography Analysis
New South Wales commanded 34.60% of national out-of-home revenue in 2025, anchored by Sydney’s dense inventory of premium roadside LED supersites and CBD street furniture. The state’s economic development roadmap for 2025-2035 earmarks additional mixed-use precincts that will house integrated digital screens, while bespoke planning guidelines now require ad formats to complement heritage façades. Though stricter planning controls may temper new billboard approvals, upgrade cycles toward high-efficiency LEDs continue to lift yield per square metre and uphold New South Wales’ central role within the Australia OOH and DOOH market.
Queensland is the fastest-growing region with a 10.4% CAGR forecast through 2031, driven by infrastructure outlays in preparation for the 2032 Brisbane Olympics. Airport refurbishments and Cross River Rail development create high-footfall environments where digital panels command Olympic-period premiums. Bishopp Outdoor reports surging interest in airport packages that couple arrivals halls with curb-side supersites, reinforcing Queensland’s strategic position for national advertisers.
Victoria holds a robust share underpinned by Melbourne’s arts and sports precincts, yet the city’s proposed night-time illumination ban illustrates rising environmental scrutiny. Media owners are trialling adaptive luminance controls to comply while preserving visibility. Western Australia, South Australia, and Tasmania deliver smaller but steady contributions, each influenced by resources-driven regional economies, tourist corridor upgrades, and tailored municipal codes. Collectively, these dynamics underpin the Australia OOH and DOOH market’s geographic diversification, balancing growth hotspots against regulatory complexity.
Competitive Landscape
The Australia OOH and DOOH market is moderate concentrated around oOh!media, JCDecaux, and QMS Media, who jointly command the majority of premium roadside, retail, and transport inventory. Strategic consolidation remains a defining theme as global majors seek scale economies across format types and rental contracts. JCDecaux’s airport contract renewal underscores the value of long-term concessions in high-yield precincts, while oOh!media’s acquisition of 35 shopping centres widens its first-party shopper data pool and underpins cross selling with programmatic road units.
Product innovation is intensifying competitive differentiation. VMO’s “Dimensions” analytics suite provides real-time audience heat maps, letting planners modulate copy based on dwell-time thresholds without manual file swaps. Meanwhile, Vistar Media is integrating static packages inside its programmatic pipes, enabling omnichannel buys that blend paper and pixels through a single workflow. Operator focus on sustainability is another arena of rivalry: the Ad Net Zero initiative sets sector-wide carbon-neutral targets, and oOh!media’s recyclable Ecobanner helps advertisers quantify emissions savings alongside reach metrics. [2]Outdoor Media Association, Media Owners, OMA, oma.org.au These moves position leading players to defend premium CPMs as corporate procurement teams push ESG criteria into media supply selection.
Talent reshuffles add further volatility. JCDecaux installed joint CEOs to drive localised agility after 20 years of single-leader stewardship, while oOh!media’s leadership exit in late-2024 prompted a re-alignment of go-to-market resources. GroupM’s ad-spend forecast for 2025 signals a 7.3% advance in outdoor media, suggesting ample runway for both incumbents and challenger specialists to scale share inside the Australia OOH and DOOH market as cycle conditions improve. [3]GroupM, Ad Spend to Grow 3.7% in Australia in 2025, AdNews, adnews.com.au
Australia OOH And DOOH Industry Leaders
oOh!media
QMS Media
JCDecaux Group
GoTransit Media Group
TorchMedia
- *Disclaimer: Major Players sorted in no particular order

Recent Industry Developments
- May 2025: The Outdoor Media Association Industry Awards celebrated creative and data excellence, with wins for oOh!media and VMO, reinforcing a sector-wide push toward higher-value storytelling.
- April 2025: Vistar Media expanded into traditional static formats via its Adstruc platform, signalling a strategic convergence that lowers friction for integrated omnichannel buys.
- March 2025: oOh!media posted 14% revenue growth for Q1 2025 after investing in sales enablement technology, demonstrating the payoff from its retail-centric asset expansion.
- March 2025: Vicinity Centres partnered with Cartology to commercialise more than 1,000 in-centre digital panels, indicating continued convergence between retail media networks and mainstream DOOH.


Research Methodology Framework and Report Scope
Market Definitions and Key Coverage
Our study defines the Australian out-of-home advertising market as the net media spend produced by static and digital inventory that reaches people outside the home, including billboards, street furniture, transit panels, and place-based screens. According to Mordor Intelligence, any paid slot on a digital panel, programmatic buy, or full-motion loop is booked in the year the advertiser is invoiced.
Scope exclusion: We leave out production charges, creative-agency fees, and corporate digital signage that is not sold as ad inventory.
Segmentation Overview
- By Type
- Static OOH
- Digital OOH
- Programmatic OOH
- Other Digital OOH
- By Application
- Billboards
- Transportation
- Airports
- Other Transportation
- Street Furniture
- Place-Based Media
- By End-User Industry
- Automotive
- Retail and Consumer Goods
- Healthcare
- BFSI
- Other Industries
- By Geography (Australia)
- New South Wales
- Victoria
- Queensland
- Western Australia
- South Australia
- Tasmania
- Northern Territory
- Australian Capital Territory
Detailed Research Methodology and Data Validation
Primary Research
Our interviews with media-buying agencies, screen operators, transit bodies, and major advertisers in Sydney, Melbourne, Brisbane, and Perth refine average selling prices, sell-through ratios, and programmatic adoption assumptions.
Desk Research
We start with revenue releases from the Outdoor Media Association, mobility and spend indicators from the Australian Bureau of Statistics, open data from state transport agencies, and ACMA policy bulletins. We then enrich them with trend articles from respected trade journals. Company filings and press statements extend historic timelines, while paid tools such as D&B Hoovers and Dow Jones Factiva let us confirm operator revenues. Customs tables, patent portals, and local gazettes flag LED imports and site approvals. These examples are illustrative; many more references support our desk work.
Market-Sizing & Forecasting
We anchor on Outdoor Media Association 2024 net media revenue, convert it to constant USD, and project each format with multipliers for screen count, CPM movement, and occupancy. Targeted bottom-up checks, sampled digital billboard inventory multiplied by verified prices, tighten totals. Key drivers in our multivariate regression include urban population growth, airport passenger flow, DOOH share of OOH spend, national retail turnover, and LED cost curves. Where operator data is missing, we bridge gaps with interview averages.
Data Validation & Update Cycle
Outputs pass three analyst reviews; variance above five percent triggers fresh calls or source checks. Reports refresh each year, with interim edits after material events, so clients always receive the latest view.
Why Mordor's Australia OOH And DOOH Baseline Deserves Decision-Maker Trust
Published estimates often differ because firms mix creative fees, freeze exchange rates on different days, or assume rapid digital uptake before proof emerges.
Our removal of agency costs, constant-currency anchoring on audited OMA data, and an annual refresh cadence prevent those distortions.
Benchmark comparison
| Market Size | Anonymized source | Primary gap driver |
|---|---|---|
| USD 0.85 B (2025) | Mordor Intelligence | - |
| USD 0.80 B (2024) | Global Consultancy A | Includes agency fees, omits place-based screens |
| USD 0.68 B (2024) | Industry Research B | Uses nominal AUD, slower screen-rollout assumption |
Together, we believe this disciplined variable selection and frequent updates deliver a balanced, transparent baseline that decision-makers can trace and replicate with confidence.


Key Questions Answered in the Report
How large is the Australia OOH and DOOH market in 2026 and how fast is it growing?
The market stands at USD 927.52 million in 2026 and is projected to reach USD 1.44 billion by 2031, reflecting a 9.12% CAGR
Why does digital out-of-home dominate Australia’s outdoor spend?
Digital formats command 67.35% of total out-of-home expenditure because smart-city infrastructure, programmatic trading pipes, and robust third-party verification make dynamic screens more attractive than static posters
Which application segment is expanding the fastest?
Airport advertising is expected to grow at a 11.8% CAGR through 2031, supported by passenger-volume recovery and large-format digital upgrades such as those at Sydney Airport
Which Australian state presents the strongest near-term growth outlook?
Queensland leads with a forecast 10.4% CAGR to 2031, driven by infrastructure spending tied to the 2032 Brisbane Olympics and airport-centric inventory development
What is MOVE 2.0 and why does it matter?
MOVE 2.0 is the Outdoor Media Association’s USD 17 million audience-measurement upgrade scheduled for 2025; it will deliver unified reach, frequency, and impression data across all formats, helping advertisers justify national budgets with greater confidence
How concentrated is the competitive landscape?
The top five operators control roughly 70% of total revenue, giving the market a concentration score of 7 and underscoring a moderately consolidated yet still competitive environment.
Page last updated on:


