Australia Crop Protection Market Size and Share
Market Overview
| Study Period | 2021 - 2031 |
|---|---|
| Forecast Data Period | 2026 - 2031 |
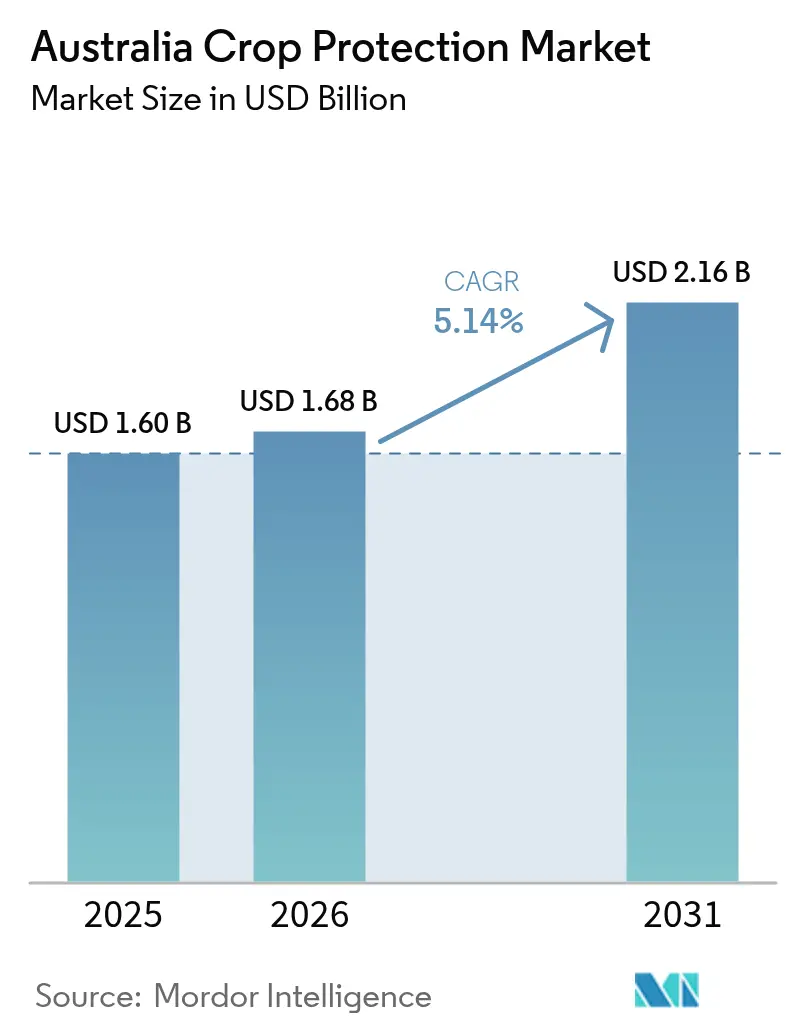
| Base Year Market Size (2025) | USD 1.60 Billion |
| Market Size (2026) | USD 1.68 Billion |
| Market Size (2031) | USD 2.16 Billion |
| Growth Rate (2026 - 2031) | 5.14% CAGR |
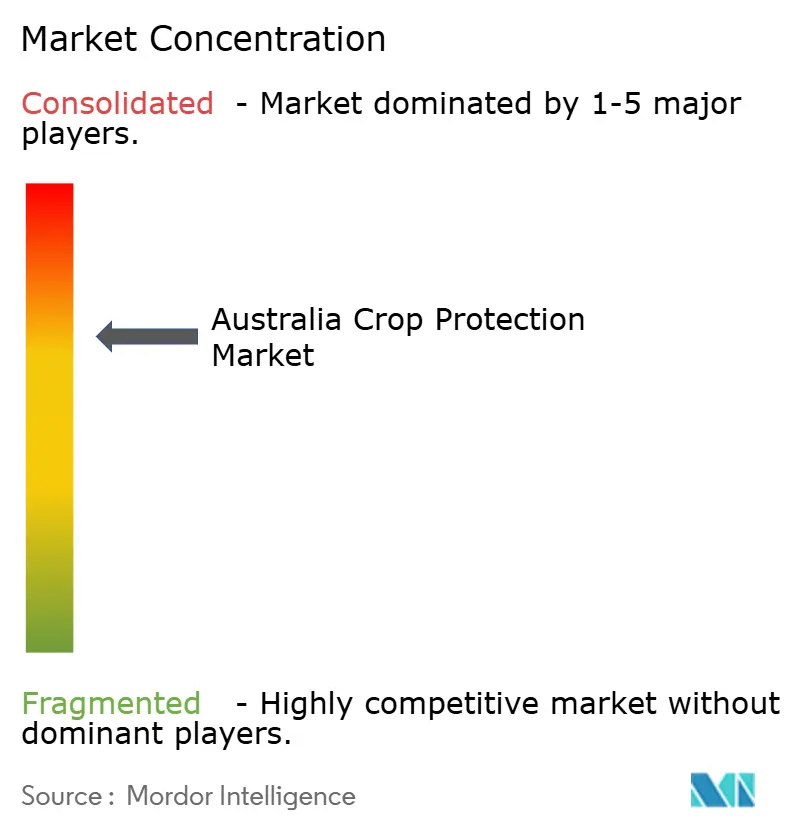
| Market Concentration | Medium |
Major Players *Disclaimer: Major Players sorted in no particular order Image © Mordor Intelligence. Reuse requires attribution under CC BY 4.0. | |
Australia Crop Protection Market Analysis by Mordor Intelligence
The Australia crop protection market size is expected to grow from USD 1.60 billion in 2025 to USD 1.68 billion in 2026 and is forecast to reach USD 2.16 billion by 2031 at 5.14% CAGR over 2026-2031. This trajectory underscores the market’s ability to withstand regulatory turbulence, climate volatility, and supply-chain disruption while preserving Australia’s role as a major agricultural exporter. Demand strength is anchored in 70% of farm output moving to overseas buyers, creating constant pressure to keep weeds, diseases, and insects in check[1]Source: Australia Trade and Investment Commission, “Australia Agribusiness Overview,” trade.gov. Regulatory reforms now underway at the Australian Pesticides and Veterinary Medicines Authority (APVMA) are projected to raise near-term approval bottlenecks but ultimately deliver greater long-term confidence. Rising drought frequency in southern states and excessive rainfall on the eastern coast are narrowing optimal spray windows, which in turn fuels the adoption of precision application tools and low-volume formulations. Competitive activity is intensifying as multinationals expand portfolios and digital agronomy platforms, with herbicide-resistance, drone-based spraying, and carbon farming incentives shaping product pipelines through 2030.
Key Report Takeaways
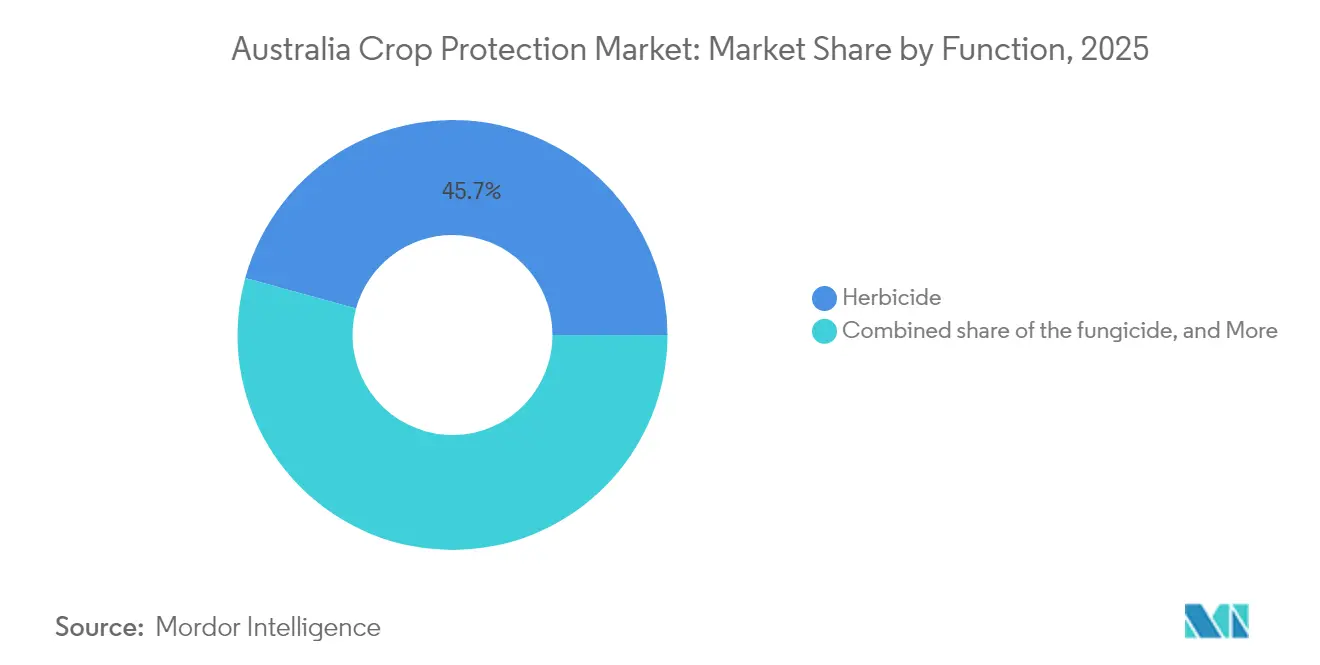
- By function, herbicides led with 45.72% of Australia crop protection market share in 2025, while fungicides are advancing at a 12.32% CAGR through 2031.
- By application mode, foliar spray captured 40.02% revenue in 2025, and seed treatment is projected to expand at a 10.27% CAGR to 2031.
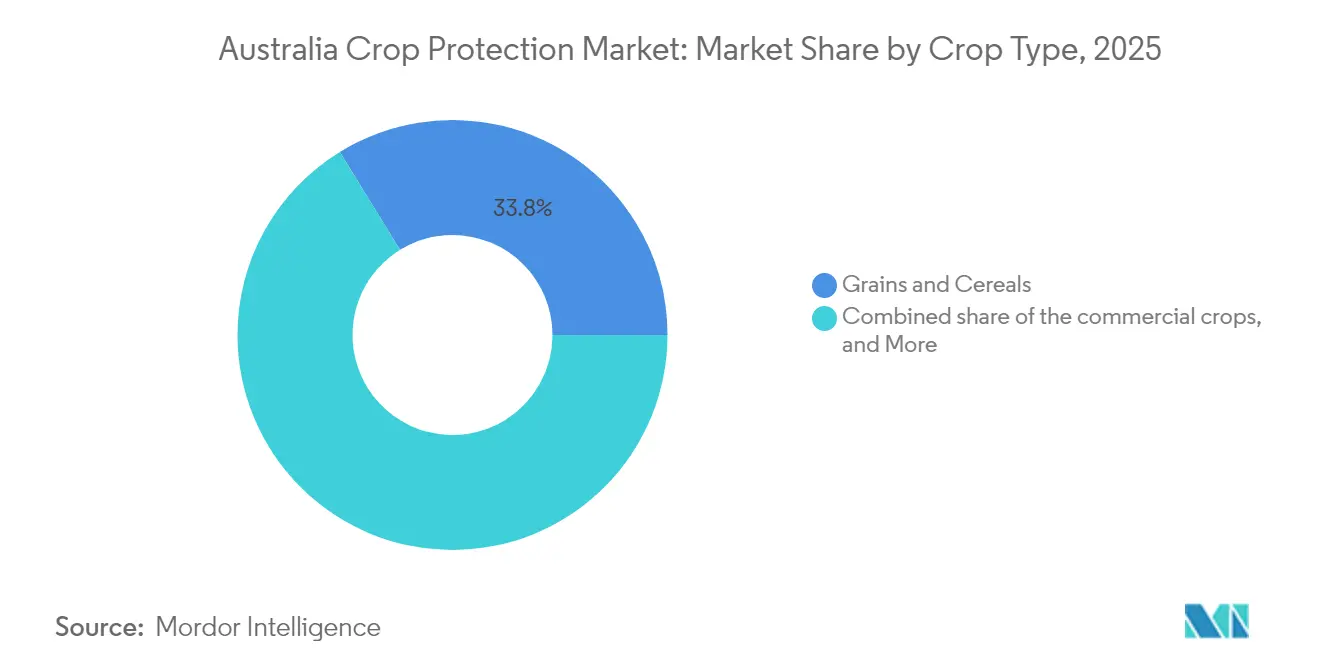
- By crop type, grains and cereals accounted for a 33.78% share of the Australia crop protection market size in 2025, and fruits and vegetables are growing at an 8.44% CAGR of through 2031.
Note: Market size and forecast figures in this report are generated using Mordor Intelligence’s proprietary estimation framework, updated with the latest available data and insights as of 2026.
Australia Crop Protection Market Trends and Insights
Drivers Impact Analysis*
| Driver | (~) % Impact on CAGR Forecast | Geographic Relevance | Impact Timeline |
|---|---|---|---|
| Rising food-demand pressure on limited arable land | +1.2% | National, concentrated in high-productivity zones | Medium term (2-4 years) |
| Rapid pipeline of herbicide-tolerant crop traits | +0.8% | Grain belt regions, Western Australia, and NSW | Short term (≤ 2 years) |
| Pesticide R&D cost reductions via AI-enabled molecular screening | +0.6% | National, early adoption in Victoria and South Australia | Long term (≥ 4 years) |
| Surge in drone-based ultra-low-volume spraying services | +0.9% | Large-scale operations, Queensland, and Western Australia | Medium term (2-4 years) |
| Government fast-track registrations for "reduced-risk" actives | +0.7% | National, aligned with APVMA priority review pathways | Short term (≤ 2 years) |
| Carbon-credit incentives for regenerative farming inputs | +0.5% | Southern Australia, Murray-Darling Basin | Long term (≥ 4 years) |
| Source: Mordor Intelligence | |||
Rising Food-Demand Pressure on Limited Arable Land
The switch toward higher-value horticulture, evidenced by the 8.5% CAGR in fruits and vegetables, raises tolerance for costly but targeted crop protection programs. Taken together, constrained land supply and strong balance sheets will keep investment in advanced solutions buoyant across the Australia crop protection market. Only 369 million hectares of farmland are available, yet domestic output must continue to rise to meet export contracts and growing Asian demand[2]Source: Australian Bureau of Statistics, “Agricultural Land Use,” abs.gov.au. With land expansion capped, growers prioritize yield-intensification tools that protect each hectare from weed and disease loss. Cash-flow capacity is improving as cropping farm profits are projected to climb to USD 262,000 per operation in 2024-25, enabling purchase of premium herbicide stacks and in-season fungicide passes[3]Source: Department of Agriculture Fisheries and Forestry, “Farm Performance Forecast,” agriculture.gov.au. Precision variable-rate platforms already reduce chemical volume by up to 30% while maintaining output, demonstrating that efficiency, rather than spray volume, drives productivity.
Rapid Pipeline of Herbicide-Tolerant Crop Traits
The commercialization of multi-trait tolerant cotton, canola, and cereal varieties is providing growers with wider spray windows and new mode-of-action combinations. The Commonwealth Scientific and Industrial Research Organisation (CSIRO) Bollgard 3 XtendFlex cotton preview in 2024 exemplifies the trend by stacking tolerance to multiple herbicides, thereby relieving resistance pressure in Australia’s no-till systems [4]Source: CSIRO, “Bollgard 3 XtendFlex Launch,” csiro.au. Growers facing ryegrass and wild oat resistance now gain an extra season of efficacy from existing active ingredients, protecting their return on past chemistry investments. In the 2022-23 season, wheat output reached 41.2 million metric tons, valued at USD 13.5 billion. Therefore, even modest yield gains translate into significant demand for chemistry. Seed companies and basic manufacturers are co-marketing trait-chemistry bundles, strengthening their lock-in with distributors. As more multi-stack varieties pass APVMA review, the Australia crop protection market will lean on trait innovation to delay costly resistance crises.
Pesticide R&D Cost Reductions via AI-Enabled Molecular Screening
Artificial intelligence shortens discovery cycles from years to months, cutting lab and field iterations and boosting pipeline throughput. Machine-learning models now predict bioactive compound success with up to 96% accuracy, enabling small companies to screen thousands of microbes quickly. APVMA preference for reduced-risk registrations dovetails with consumer pressure for residue-free products, making economics and regulation mutually reinforcing. As algorithmic screening gains trust, it will claim a higher share of fungicide and insecticide programs, bolstering revenue diversity within the Australia crop protection industry.
Surge in Drone-Based Ultra-Low-Volume Spraying Services
The drone market is projected to expand globally by 2030, and Australia ranks among the fastest adopters. Units like the DJI Agras T30 can cover 8 hectares per hour, operating when ground rigs cannot enter wet paddocks. State rebate schemes offset capital cost and accelerate adoption across Queensland fruit blocks and Western Australian broadacre grains. Ultra-low-volume techniques slash water haulage, permit night applications, and reduce operator exposure. Integration with AI crop-scouting flights closes the loop from detection to treatment, raising overall system effectiveness and driving incremental sales of drone-formulated crop protection products.
Restraints Impact Analysis*
| Restraint | (~)% Impact on CAGR Forecast | Geographic Relevance | Impact Timeline |
|---|---|---|---|
| Escalating APVMA registration fees | -0.8% | National, affecting all product categories | Short term (≤ 2 years) |
| Pending paraquat and glyphosate restrictions | -1.1% | National, concentrated impact on broadacre systems | Medium term (2-4 years) |
| Chronic shortage of rural agronomists | -0.6% | Regional areas, remote farming districts | Long term (≥ 4 years) |
| Sea-freight volatility elevating import costs | -0.9% | National, affecting imported active ingredients | Short term (≤ 2 years) |
| Source: Mordor Intelligence | |||
Escalating APVMA Registration Fees
APVMA’s cost-recovery model obliges applicants to fund complex evaluations upfront, which can exceed USD 500,000 for new chemical classes. Smaller innovators struggle to capitalize on programs, delaying or canceling niche products for minor crops. Staff relocation to Armidale cut experienced assessor numbers, elongating timelines and adding resubmission fees that can lift total outlays by another 15%. Faced with uncertain payback, many registrants prioritize large-acreage herbicide labels over specialty fungicides, narrowing grower options. Fee escalation, therefore, stifles portfolio diversity and could erode 0.8% of forecast CAGR for the Australia crop protection market.
Pending Paraquat and Glyphosate Restrictions
In July 2024, the regulator released draft decisions that may curtail paraquat volumes and strengthen glyphosate stewardship, echoing trends in overseas litigation. Broadacre growers depend on these cost-effective actives for conservation tillage. Removal would force shifts to pricier or less efficacious modes of action. Distributors face inventory risk during the transition period, and R&D programs rebalance toward alternative chemistries, which raises costs. Market uncertainty freezes purchasing decisions and suppresses growth until clarity emerges, slicing an estimated 1.1% from potential CAGR across the Australia crop protection market.
*Our forecasts treat driver/restraint impacts as directional, not additive. The impact forecasts reflect baseline growth, mix effects, and variable interactions.
Segment Analysis
By Function: Herbicide Dominance Faces Fungicide Momentum
Herbicides represented 45.72% of Australia crop protection market share in 2025, fueled by the nation’s 36 million metric tons of wheat program and extensive no-till acreage. This leading position is reinforced by the grower's reliance on chemical weed control as mechanical tillage declines to conserve soil moisture. The arrival of Group 14 pre-emergence options extends control of resistant ryegrass, sustaining herbicide headroom. Fungicides are experiencing rapid growth with a projected CAGR of 12.32% through 2031, driven by increased rainfall in eastern regions and expanded horticultural cultivation. Disease outbreaks in lentils and pulses have increased fungicide usage even in typically arid regions, expanding their application across the Australian crop protection market.
Insecticide demand is stabilizing as IPM tactics take share, though fall armyworm incursions in northern states keep baseline volume intact. Nematicides and molluscicides remain niche but critical for cotton and leafy-green systems battling root-knot and slug outbreaks. Suppliers therefore balance broadacre herbicide investment with high-margin fungicide innovation, ensuring the Australia crop protection industry maintains portfolio resilience.


By Application Mode: Foliar Spray Leads While Seed Treatment Accelerates
Foliar application delivered 40.02% of 2025 revenue, a testament to aerial fleets and self-propelled sprayers blanketing millions of hectares in narrow windows. Its dominance owes much to post-emergence herbicide and curative fungicide programs that require canopy coverage. However, seed treatment logged a 10.27% CAGR outlook as growers adopt multi-mode insecticide and fungicide coatings seeking early-season insurance. This surge redirects some demand away from in-crop sprays but simultaneously drives higher per-hectare spend, expanding the Australia crop protection market.
Chemigation uptake increases in irrigated horticulture, merging water and input delivery to trim labor. Soil fumigation holds steady within the strawberry and tomato sectors, aiming for export-grade residue standards. As drone-ready formulations emerge, low-volume foliar techniques may reclaim momentum, yet seed treatment’s convenience and efficiency ensure its ascent across rotation crops in the Australia crop protection market.
By Crop Type: Grains Anchor Revenue While Horticulture Outpaces
Grains and cereals secured 33.78% of the 2025 value, mirroring the nation’s export-oriented wheat, barley, and canola complex. These broadacre systems rely on cost-effective herbicide regimes and prophylactic fungicides to safeguard commodity margins. Yet, fruits and vegetables are advancing at an 8.44% CAGR to 2031, powered by rising Asian consumer demand for safe, premium produce and domestic health-food trends. High unit revenue per hectare justifies intensive spraying schedules, lifting the contribution to the Australia crop protection market size.
Cotton and sugarcane remain regionally important, with treated cotton sustaining insecticide volume despite bollworm resistance. Pulses and oilseeds diversify rotations, requiring nuanced pest control. Turf and ornamentals, though small, tap into urbanization and sports-field maintenance budgets. Diversification across crop types shields the Australia crop protection market from single-commodity shocks and underpins steady aggregate growth.
Geography Analysis
New South Wales and Victoria jointly accounted for nearly half of the nation's sales in 2025, as mixed-farming enterprises demanded robust herbicide and fungicide programs. Drought stress in inland Victoria has intensified fungicide frequency on moisture-stressed cereals, while the coastal strip copes with disease pressure from prolonged humidity. The presence of mature distribution hubs and research stations further concentrates demand.
Queensland is projected to be the fastest-growing region through 2031, driven by subtropical horticulture and increasing adoption of drone services across sugarcane and cotton valleys. Rice output in the state increased to 618,000 metric tons in 2024, underscoring the uptake of seed treatments and targeted insecticides to combat rice blast. Government grants supporting AgTech accelerate technology transfer, positioning the state as a showcase for precision spraying.
Western Australia contributes a substantial volume of herbicides, given its expansive wheat belt, yet faces logistical hurdles due to port distances and a limited agronomic workforce. Seasonal variability prompts growers to adopt flexible, higher-value mixes, which support gains in fungicide and seed treatment. South Australia and Tasmania round out the market with specialized needs. Wine-grape fungicide programs and brassica insect control sustain steady albeit smaller demand. Together, regional diversity cushions the Australia crop protection market against localized weather shocks, ensuring nationwide resilience.
Competitive Landscape
The market is moderately concentrated. The top four multinationals captured more than half of 2024 sales, while the domestic champion, Nufarm, remains a pivotal challenger. Syngenta Group leverages its CROPWISE digital platform to bundle chemistry with imagery and advisory services, locking in distributor loyalty. Bayer AG continues rolling out Fluroxypyr-based stacks aimed at resistant broadleaf weeds, complementing its industry-leading glyphosate franchise.
BASF SE and Corteva Inc. are investing aggressively in novel modes of action to preempt regulatory threats, with the launches of Cimegra and Isoflex highlighting momentum toward resistance-breaking herbicides. Nufarm’s local formulation plants cut lead times and allow rapid reformulation to suit APVMA label tweaks, sustaining competitive parity on price and service. Partnerships, such as Syngenta Group’s Pesticide alliance with Lavie Bio, underscore a strategic pivot toward lower-toxicity portfolios that align with APVMA fast-track priorities.
Price competition intensifies on generic molecules as Chinese supply returns post-pandemic, yet freight volatility keeps on-the-ground inventory valuable. Companies with strong balance sheets secure buffer stocks, whereas smaller importers risk stockouts. R&D spend averages 7-10% of sales, channelled toward digital agronomy, formulation technology and discovery. Market power will accrue to firms integrating chemistry, data and service, reinforcing current leadership dynamics within the Australia crop protection market.
Australia Crop Protection Industry Leaders
BASF SE
Corteva Inc.
Bayer AG
Nufarm Limited
Syngenta Group
- *Disclaimer: Major Players sorted in no particular order

Recent Industry Developments
- October 2024: Greeneye Technology began Australian field trials with Croplands targeting 96% chemical-use cuts via AI selective spraying.
- October 2024: APVMA cancelled all chlorthal dimethyl products, withdrawing 12 registrations across vegetable, turf and cotton use.
- June 2024: Commonwealth Scientific and Industrial Research Organisation (CSIRO) launched the Drought Resilience Mission with USD 519.1 million in Future Drought Fund allocation, developing drought-resistant livestock forage, including Anameka Saltbush, to address feed shortages and improve ecosystem health across Australian agricultural regions.


Australia Crop Protection Market Report Scope
Crop protection chemicals, also known as pesticides, are chemicals used to protect crops from pests and diseases. Pesticides are used to control a variety of agricultural pests that damage crops and reduce farm productivity. The Australia Crop Protection Chemicals Market is segmented Function (Fungicide, Herbicide, Insecticide, Molluscicide, Nematicide), Application Mode (Chemigation, Foliar, Fumigation, Seed Treatment, Soil Treatment) and Crop Type (Commercial Crops, Fruits & Vegetables, Grains & Cereals, Pulses & Oilseeds, Turf & Ornamental). The report also offers the market sizing and forecastss in terms of value (USD) and volume (metric tons).
| Herbicide |
| Fungicide |
| Insecticide |
| Nematicide |
| Molluscicide |
| Chemigation |
| Foliar Spray |
| Fumigation |
| Seed Treatment |
| Soil Treatment |
| Commercial Crops |
| Fruits and Vegetables |
| Grains and Cereals |
| Pulses and Oilseeds |
| Turf and Ornamentals |
| By Function | Herbicide |
| Fungicide | |
| Insecticide | |
| Nematicide | |
| Molluscicide | |
| By Application Mode | Chemigation |
| Foliar Spray | |
| Fumigation | |
| Seed Treatment | |
| Soil Treatment | |
| By Crop Type | Commercial Crops |
| Fruits and Vegetables | |
| Grains and Cereals | |
| Pulses and Oilseeds | |
| Turf and Ornamentals |


Key Questions Answered in the Report
How large is the Australia crop protection market in 2026?
The Australia crop protection market size is USD 1.68 billion in 2026 and is forecast to reach USD 2.16 billion by 2031.
Which function leads spending?
Herbicides command 45.72% of sales, reflecting heavy reliance on chemical weed control across broadacre grains.
What is the fastest-growing segment by function?
Fungicides show the fastest growth, expanding at a 12.32% CAGR through 2031 due to rising disease pressure.
Which state is projected to grow quickest?
Queensland is projected to deliver the highest regional CAGR at 6.32% between 2026 and 2031, driven by horticulture expansion and drone adoption.
How are regulatory shifts affecting product pipelines?
APVMA fast-track lanes for reduced-risk actives shorten approval times, but higher registration fees and pending glyphosate decisions add cost and uncertainty.
Page last updated on:


