Market Overview
| Study Period | 2018 - 2031 |
|---|---|
| Forecast Data Period | 2026 - 2031 |
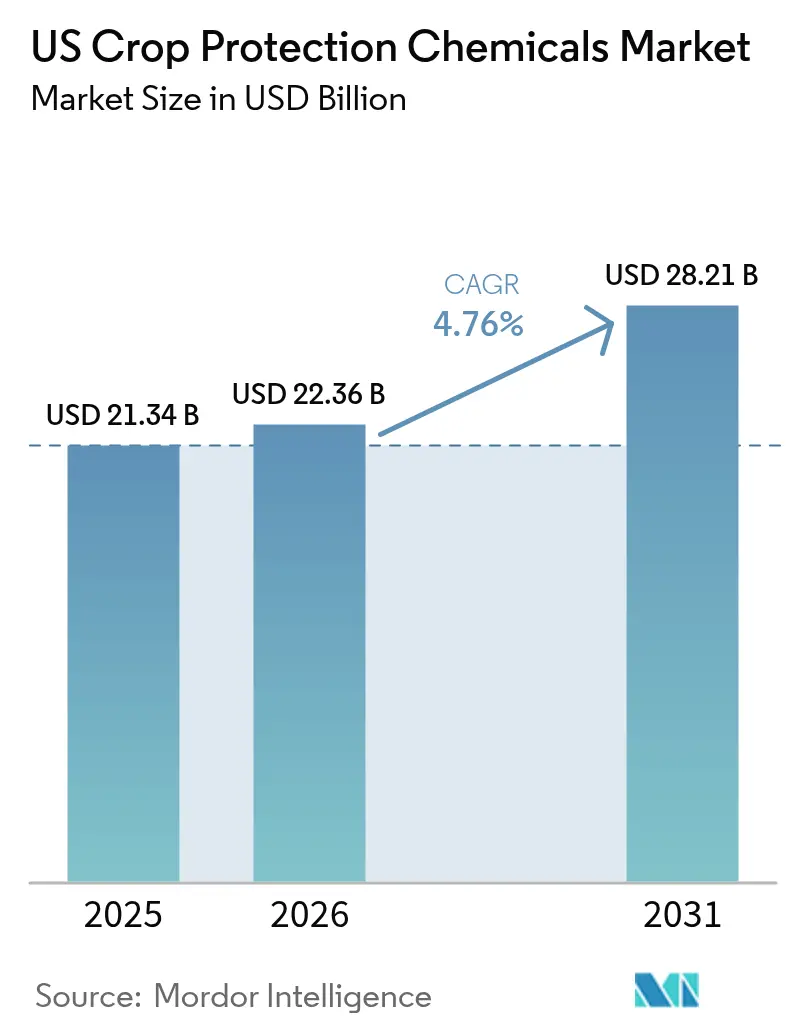
| Base Year Market Size (2025) | USD 21.34 Billion |
| Market Size (2026) | USD 22.36 Billion |
| Market Size (2031) | USD 28.21 Billion |
| Growth Rate (2026 - 2031) | 4.76% CAGR |
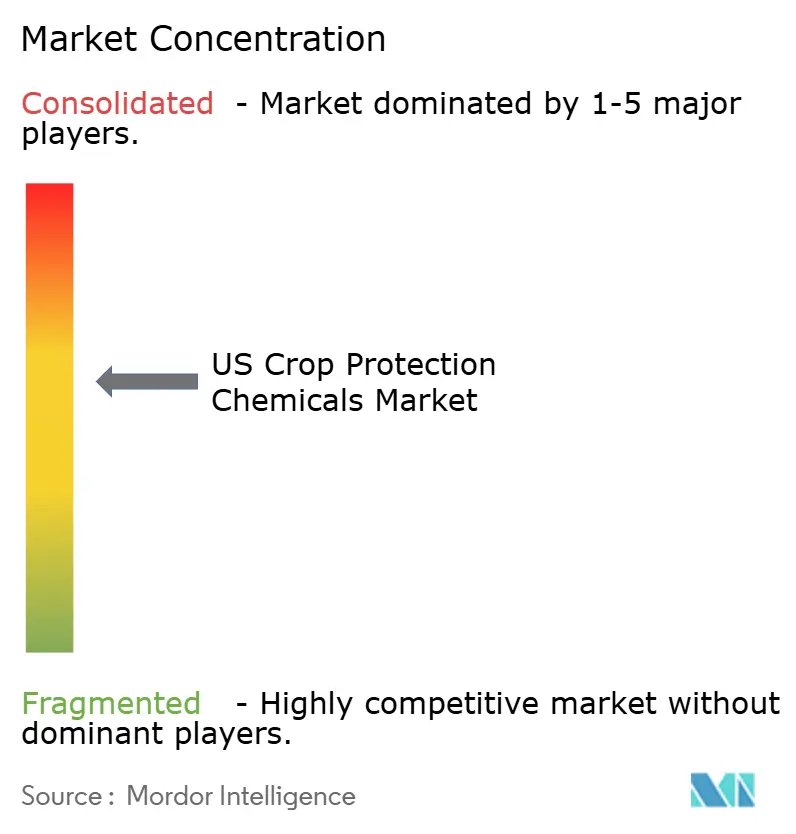
| Market Concentration | Medium |
Major Players *Disclaimer: Major Players sorted in no particular order Image © Mordor Intelligence. Reuse requires attribution under CC BY 4.0. | |
US Crop Protection Chemicals Market Analysis by Mordor Intelligence
The US crop protection chemicals market size was valued at USD 21.34 billion in 2025 and estimated to grow from USD 22.36 billion in 2026 to reach USD 28.21 billion by 2031, at a CAGR of 4.76% during the forecast period (2026-2031). Adoption of precision-agriculture tools that fine-tune dosage, demand from soybean acreage geared to renewable diesel, and an Environmental Protection Agency (EPA) fast-track pathway for low-risk active ingredients are the principal growth catalysts. Momentum is reinforced by the end of a 2024 distributor destocking cycle that had cut inventory below historical norms, while channel partners now rebuild stocks ahead of the 2026 season. Competitive behavior centers on investments in digital application platforms that unlock outcome-based contracting models, even as import-driven price pressure forces producers to improve cost efficiency. Weed resistance, higher interest rates, and tighter application windows framed by endangered-species directives remain the key hurdles that can temper near-term gains.
Key Report Takeaways
- By function, herbicides accounted for 53.02% of the US crop protection chemicals market share in 2025, and the same segment is forecast to expand at a 4.88% CAGR through 2031.
- By application mode, foliar spraying led with 39.95% of the US crop protection chemicals market size in 2025, while soil treatment is set to grow fastest at a 4.97% CAGR to 2031.
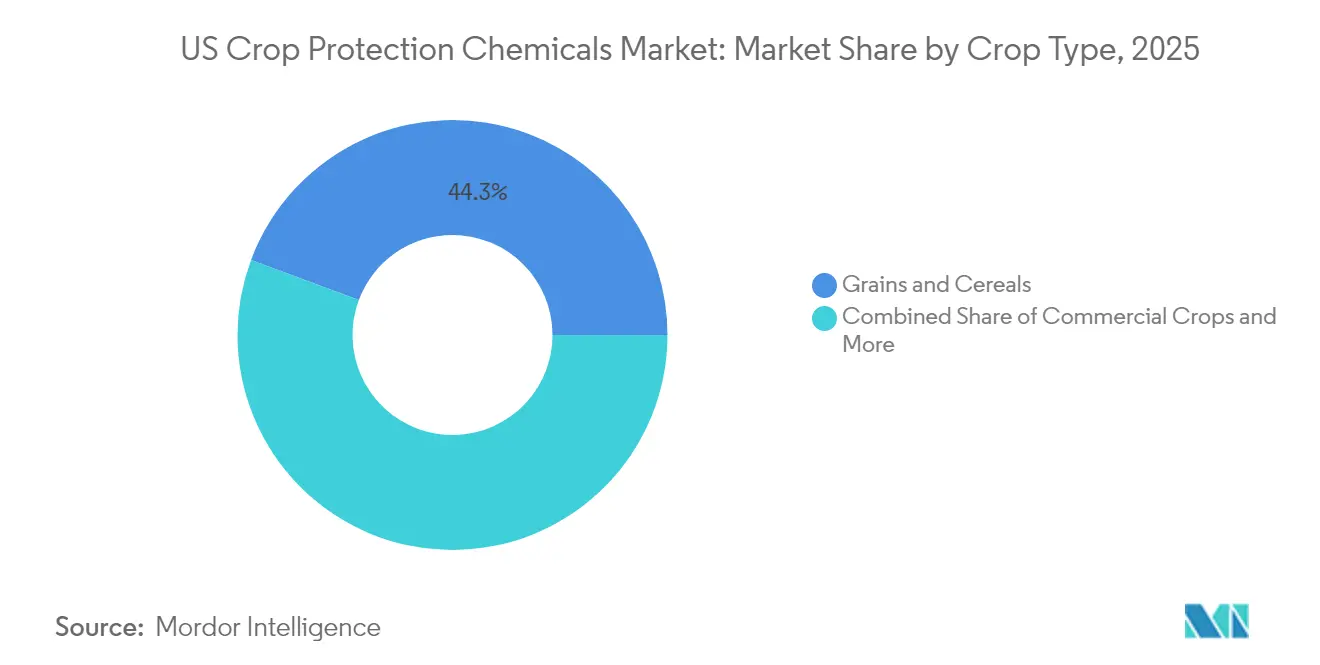
- By crop type, grains and cereals represented 44.32% revenue in 2025 and are poised to register a 4.92% CAGR over the outlook period.
Note: Market size and forecast figures in this report are generated using Mordor Intelligence’s proprietary estimation framework, updated with the latest available data and insights as of 2026.
US Crop Protection Chemicals Market Trends and Insights
Drivers Impact Analysis*
| Driver | (~) % Impact on CAGR Forecast | Geographic Relevance | Impact Timeline |
|---|---|---|---|
| Precision-ag adoption lowers per-acre costs while boosting product sales | +0.8% | Midwest corn belt, California specialty crops | Medium term (2-4 years) |
| Surge in soybean oil renewable diesel demand supports herbicide volumes | +0.7% | Illinois, Iowa, Indiana, and Minnesota soybean regions | Short term (≤ 2 years) |
| IoT-enabled outcome-based contracts tie chemical use to yield bonuses | +0.4% | Technology-forward farms in the Midwest and California | Medium term (2-4 years) |
| Distributor restocking fuels near-term volume lift | +0.6% | National distribution networks | Short term (≤ 2 years) |
| Growth of contract-farming platforms driving input packages | +0.5% | National, with early gains in specialty crop regions | Long term (≥ 4 years) |
| USDA crop-insurance subsidy cuts push growers to protect higher ROI acres | +0.3% | High-value crop regions, specialty agriculture zones | Medium term (2-4 years) |
| Source: Mordor Intelligence | |||
Precision-ag adoption lowers per-acre costs while boosting product sales
Precision agriculture adoption fundamentally alters the crop protection value proposition by reducing per-acre application costs while simultaneously increasing total product sales through enhanced targeting accuracy. Variable-rate application systems enable farmers to apply 15-20% less herbicide per acre while achieving superior weed control, creating a paradox where efficiency gains drive volume growth through expanded treated acreage[1]Source: “Annual Report 2024,” Deere and Company, johndeere.com. The resulting demand elasticity supports volume growth even as unit rates fall. Digital maps also cut drift incidents, helping growers comply with stricter endangered-species rules that limit off-target movement. Service providers bundle equipment, data analytics, and chemicals, turning a product play into an integrated agronomy solution that embeds switching costs.
Surge in soybean oil renewable diesel demand supports herbicide volumes
Renewable diesel capacity reached 2.7 billion gallons in 2024 and could exceed 5 billion gallons by 2027, driving record soybean plantings that intensify weed-control requirements[2]Source: “Renewable Diesel Production Capacity,” U.S. Energy Information Administration, eia.gov. This demand surge coincides with herbicide-resistant weed pressure that necessitates multi-mode-of-action programs, creating volume growth opportunities for companies with diverse herbicide portfolios. The trend particularly benefits pre-emergence herbicide systems that provide season-long residual control, as growers cannot afford yield losses from weed competition in high-value soybean markets.
IoT-enabled outcome-based contracts tie chemical use to yield bonuses
Internet of Things (IoT) sensor networks and field monitoring systems enable crop protection companies to offer outcome-based contracts that tie chemical performance directly to yield results and pest control efficacy. These smart agriculture platforms collect real-time data on pest pressure, weather conditions, and crop stress indicators, allowing for precise application timing and dosage optimization that maximizes chemical effectiveness. IoT-enabled contracts also generate valuable field performance data that informs next-generation product development and application recommendations, creating competitive moats for companies that successfully integrate technology platforms with chemical expertise.
Distributor restocking fuels near-term volume lift
Average channel stocks fell to an 85-day supply in late 2024, below the historic 110-day norm. Rising crop receipts enable retailers to rebuild inventory, pulling forward manufacturer shipments. Early-season discounts and extended payment terms further stimulate preseason buying. The restocking dynamic particularly benefits herbicide and fungicide categories, where seasonal demand concentration requires substantial pre-positioning inventory. Channel financing improvements and supplier credit terms also support inventory rebuilding, as manufacturers offer extended payment terms to encourage early-season purchases and secure market share ahead of competitors.
Restraints Impact Analysis*
| Restraint | (~) % Impact on CAGR Forecast | Geographic Relevance | Impact Timeline |
|---|---|---|---|
| Herbicide-resistant "super-weeds" are driving chemistry obsolescence | -0.9% | Midwest corn-soy rotation areas, cotton regions | Long term (≥ 4 years) |
| Price pressure from Chinese technical-grade imports erodes margins | -0.6% | National, affecting all product categories | Medium term (2-4 years) |
| EPA staffing backlog delays pesticide registrations | -0.4% | National pesticide market development | Medium term (2-4 years) |
| Rising interest rates compress farmer cash flow for input purchases | -0.7% | Leveraged farming operations nationwide | Short term (≤ 2 years) |
| Source: Mordor Intelligence | |||
Herbicide-resistant "super-weeds" are driving chemistry obsolescence
Herbicide-resistant weed populations continue expanding across major crop production regions, rendering established chemistry ineffective and forcing costly transitions to alternative control methods that may offer lower efficacy or higher application costs. Palmer amaranth resistance now affects over 23 states, while glyphosate-resistant kochia and waterhemp populations spread throughout the Midwest corn belt, creating substantial yield risk for growers dependent on single-mode-of-action program. This dynamic creates market share volatility as effective products gain rapid adoption while resistance-prone chemistries face volume declines and margin compression.
Price pressure from Chinese technical-grade imports erodes margins
Technical-grade active ingredient imports from Chinese manufacturers continue to pressurize profit margins across crop protection categories, forcing domestic producers to compete on price while maintaining regulatory compliance and quality standards that increase production costs. Chinese technical-grade imports captured an estimated 35% of the U.S. market for generic active ingredients in 2024, with pricing typically 20-30% below domestic production costs[3]Source: “Trade Data 2024,” U.S. International Trade Commission, usitc.gov. The margin squeeze is most acute in off-patent herbicides and insecticides, compelling local producers to exit commodity segments or pivot to proprietary formulations.
*Our forecasts treat driver/restraint impacts as directional, not additive. The impact forecasts reflect baseline growth, mix effects, and variable interactions.
Segment Analysis
By Function: Herbicides drive volume growth through resistance management
Herbicides captured 53.02% of the US crop protection chemicals market share in 2025 and are forecast to post a 4.88% CAGR as growers escalate multi-mode programs to manage resistant weeds. The US crop protection chemicals market size for herbicides, therefore, rises faster than the overall average, buoyed by soybean acreage growth linked to renewable diesel contracts. Fungicides secure a good value, benefiting from weather-driven disease surges, while insecticides stand with strength in seed-treatment channels.
Novel herbicide modes with differentiated sites of action command premium pricing that offsets generic erosion. Fungicide demand skews toward triazole-strobilurin premixes that hedge weather variability, whereas insecticide innovation centers on systemic seed-applied actives that protect early growth stages without foliar passes. Regulatory scrutiny focuses on legacy organophosphate and carbamate insecticides, accelerating substitution toward reduced-risk alternatives.


By Application Mode: Seed treatment gains as a precision vector
Foliar sprays remained dominant at 39.95% in 2025 thanks to their broad utility across crop and pest spectra. Yet soil treatment is the fastest-expanding format, tracking a 4.97% CAGR. EPA application guidelines increasingly favor methods that minimize drift potential and non-target exposure, creating competitive advantages for seed treatment and soil-applied formulations over traditional foliar spraying systems. The US crop protection chemicals market size for seed treatment thus widens steadily as input suppliers bundle traits, coatings, and starters.
Chemigation represents the smallest but fast-adopting segment, growing as irrigation infrastructure improvements enable precise chemical delivery through existing water systems. The application mode segmentation reflects broader trends in precision agriculture, where timing, placement, and dosage optimization drive improvements in efficacy and regulatory compliance.
By Crop Type: Grains and cereals anchor demand through 2030
Grains and cereals accounted for 44.32% of the 2025 turnover and are anticipated to expand at a 4.92% CAGR, making them both the largest and fastest-growing crop user group. Consequently, this segment accounts for the single largest share of the US crop protection chemicals market size throughout the outlook. Pulses and oilseeds fueled by soybean acreage linked to biofuel and by canola adoption in Northern Plains rotations. Crop type segmentation is increasingly reflecting sustainability pressures from food processors and export markets that demand reduced chemical residue levels and certified production practices.
Commercial crops, including cotton and tobacco, maintain stable demand patterns, while turf and ornamental applications serve specialized markets with distinct regulatory requirements and application timing constraints. Regulatory compliance factors from the EPA and state agencies, particularly in specialty crop segments, influence application windows and chemical selection options, as proximity to sensitive areas limits these options. This drives demand for reduced-risk alternatives and precision application systems.
Geography Analysis
Regional use patterns hinge on crop mix, climate, and state-level regulation. The Midwest Corn Belt, comprising Illinois, Iowa, Indiana, and Minnesota, absorbs the largest volumes of herbicides, reflecting intensive corn-soybean rotations and large field sizes that reward efficiency. Grains and cereals dominate here, and state universities offer extension support that speeds adoption of new chemistries.
California accounts for a significant share of nationwide crop protection expenditures, despite having limited acreage, because high-value fruits, nuts, and vegetables require season-long fungicide, insecticide, and miticide programs. Proposition 65 and county-level buffer rules restrict certain active-ingredient lists, prompting rapid shifts to reduced-risk alternatives.
The Southeast, including Florida and the Carolinas, posts the highest per-acre chemical spend due to year-round pest pressure and the cultivation of specialty crops such as citrus and vegetables. Cotton areas in Texas and Mississippi remain insecticide-intensive, especially against bollworm and plant bug complexes. Pacific Northwest wheat and potato growers time fungicide runs against late-season wet fronts, while Great Plains wheat states rely on pre-emergence herbicides that conserve scarce soil moisture.
Pacific Northwest wheat and potato growers time fungicide runs against late-season wet fronts, while Great Plains wheat states rely on pre-emergence herbicides that conserve scarce soil moisture.
Competitive Landscape
The US crop protection chemicals market exhibits moderate consolidation. Portfolio breadth, regulatory stewardship, and retail-network depth provide durable advantages. Bayer AG, BASF SE, Corteva Agriscience, Syngenta Group, and FMC Corporation deploy joint ventures with equipment makers to link chemistries to precision applicators, converting products into embedded services. Competitive intensity centers on innovation capabilities, regulatory expertise, and distribution network strength rather than pure scale advantages, as patent expirations create opportunities for smaller players to capture market share through competitive pricing and specialized formulations.
Strategic patterns emphasize vertical integration into seeds and traits, precision agriculture partnerships, and acquisitions that expand product portfolios beyond traditional synthetic chemicals. Opportunities emerge in herbicide resistance management, where novel modes of action command premium pricing, and in pesticide integration, where established distribution networks provide competitive advantages over startup companies. Technology adoption accelerates competitive differentiation, as companies invest in IoT platforms, predictive analytics, and outcome-based service models that create switching costs and customer loyalty beyond product performance alone.
Regulation shapes strategy; large players maintain in-house toxicology and environmental teams that navigate EPA reviews, whereas smaller firms outsource dossiers to consultants. Digital contracts that guarantee yield or pest thresholds build farmer loyalty and harvest field data that refine next-generation actives.
US Crop Protection Chemicals Industry Leaders
BASF SE
Bayer AG
Corteva Agriscience
FMC Corporation
Syngenta Group
- *Disclaimer: Major Players sorted in no particular order

Recent Industry Developments
- May 2025: BASF SE obtained EPA approval for isocycloseram, a broad-spectrum contact insecticide. The product targets lepidopteran pests and other insects affecting specialty crops.
- April 2023: Nufarm launched a new liquid formulation fungicide, Tourney EZ, exclusively for turf and ornamental crops based on customer demand, which further strengthens the company's role in turf and ornamental crop protection.
- January 2023: Bayer formed a new partnership with Oerth Bio to enhance crop protection technology and create more eco-friendly crop protection solutions.


US Crop Protection Chemicals Market Report Scope
Fungicide, Herbicide, Insecticide, Molluscicide, Nematicide are covered as segments by Function. Chemigation, Foliar, Fumigation, Seed Treatment, Soil Treatment are covered as segments by Application Mode. Commercial Crops, Fruits & Vegetables, Grains & Cereals, Pulses & Oilseeds, Turf & Ornamental are covered as segments by Crop Type.Function
| Fungicide |
| Herbicide |
| Insecticide |
| Molluscicide |
| Nematicide |
Application Mode
| Chemigation |
| Foliar |
| Fumigation |
| Seed Treatment |
| Soil Treatment |
Crop Type
| Commercial Crops |
| Fruits and Vegetables |
| Grains and Cereals |
| Pulses and Oilseeds |
| Turf and Ornamental |
| Function | Fungicide |
| Herbicide | |
| Insecticide | |
| Molluscicide | |
| Nematicide | |
| Application Mode | Chemigation |
| Foliar | |
| Fumigation | |
| Seed Treatment | |
| Soil Treatment | |
| Crop Type | Commercial Crops |
| Fruits and Vegetables | |
| Grains and Cereals | |
| Pulses and Oilseeds | |
| Turf and Ornamental |


Market Definition
- Function - Crop Protection Chemicals are apllied to control or prevent pests, including insects, fungi, weeds, nematodes, and mollusks, from damaging the crop and to protect the crop yield.
- Application Mode - Foliar, Seed Treatment, Soil Treatment, Chemigation, and Fumigation are the different type of application modes through which crop protection chemicals are applied to the crops.
- Crop Type - This represents the consumption of crop protection chemicals by Cereals, Pulses, Oilseeds, Fruits, Vegetables, Turf, and Ornamental crops.
| Keyword | Definition |
|---|---|
| IWM | Integrated weed management (IWM) is an approach to incorporate multiple weed control techniques throughout the growing season to give producers the best opportunity to control problematic weeds. |
| Host | Hosts are the plants that form relationships with beneficial microorganisms and help them colonize. |
| Pathogen | A disease-causing organism. |
| Herbigation | Herbigation is an effective method of applying herbicides through irrigation systems. |
| Maximum residue levels (MRL) | Maximum Residue Limit (MRL) is the maximum allowed limit of pesticide residue in food or feed obtained from plants and animals. |
| IoT | The Internet of Things (IoT) is a network of interconnected devices that connect and exchange data with other IoT devices and the cloud. |
| Herbicide-tolerant varieties (HTVs) | Herbicide-tolerant varieties are plant species that have been genetically engineered to be resistant to herbicides used on crops. |
| Chemigation | Chemigation is a method of applying pesticides to crops through an irrigation system. |
| Crop Protection | Crop protection is a method of protecting crop yields from different pests, including insects, weeds, plant diseases, and others that cause damage to agricultural crops. |
| Seed Treatment | Seed treatment helps to disinfect seeds or seedlings from seed-borne or soil-borne pests. Crop protection chemicals, such as fungicides, insecticides, or nematicides, are commonly used for seed treatment. |
| Fumigation | Fumigation is the application of crop protection chemicals in gaseous form to control pests. |
| Bait | A bait is a food or other material used to lure a pest and kill it through various methods, including poisoning. |
| Contact Fungicide | Contact pesticides prevent crop contamination and combat fungal pathogens. They act on pests (fungi) only when they come in contact with the pests. |
| Systemic Fungicide | A systemic fungicide is a compound taken up by a plant and then translocated within the plant, thus protecting the plant from attack by pathogens. |
| Mass Drug Administration (MDA) | Mass drug administration is the strategy to control or eliminate many neglected tropical diseases. |
| Mollusks | Mollusks are pests that feed on crops, causing crop damage and yield loss. Mollusks include octopi, squid, snails, and slugs. |
| Pre-emergence Herbicide | Preemergence herbicides are a form of chemical weed control that prevents germinated weed seedlings from becoming established. |
| Post-emergence Herbicide | Postemergence herbicides are applied to the agricultural field to control weeds after emergence (germination) of seeds or seedlings. |
| Active Ingredients | Active ingredients are the chemicals in pesticide products that kill, control, or repel pests. |
| United States Department of Agriculture (USDA) | The Department of Agriculture provides leadership on food, agriculture, natural resources, and related issues. |
| Weed Science Society of America (WSSA) | The WSSA, a non-profit professional society, promotes research, education, and extension outreach activities related to weeds. |
| Suspension concentrate | Suspension concentrate (SC) is one of the formulations of crop protection chemicals with solid active ingredients dispersed in water. |
| Wettable powder | A wettable powder (WP) is a powder formulation that forms a suspension when mixed with water prior to spraying. |
| Emulsifiable concentrate | Emulsifiable concentrate (EC) is a concentrated liquid formulation of pesticide that needs to be diluted with water to create a spray solution. |
| Plant-parasitic nematodes | Parasitic Nematodes feed on the roots of crops, causing damage to the roots. These damages allow for easy plant infestation by soil-borne pathogens, which results in crop or yield loss. |
| Australian Weeds Strategy (AWS) | The Australian Weeds Strategy, owned by the Environment and Invasives Committee, provides national guidance on weed management. |
| Weed Science Society of Japan (WSSJ) | WSSJ aims to contribute to the prevention of weed damage and the utilization of weed value by providing the chance for research presentation and information exchange. |


Research Methodology
Mordor Intelligence follows a four-step methodology in all our reports.
- Step-1: Identify Key Variables: In order to build a robust forecasting methodology, the variables and factors identified in Step-1 are tested against available historical market numbers. Through an iterative process, the variables required for market forecast are set and the model is built on the basis of these variables.
- Step-2: Build a Market Model: Market-size estimations for the forecast years are in nominal terms. Inflation is not a part of the pricing, and the average selling price (ASP) is kept constant throughout the forecast period.
- Step-3: Validate and Finalize: In this important step, all market numbers, variables and analyst calls are validated through an extensive network of primary research experts from the market studied. The respondents are selected across levels and functions to generate a holistic picture of the market studied.
- Step-4: Research Outputs: Syndicated Reports, Custom Consulting Assignments, Databases & Subscription Platforms


