Market Overview
| Study Period | 2021 - 2031 |
|---|---|
| Forecast Data Period | 2026 - 2031 |
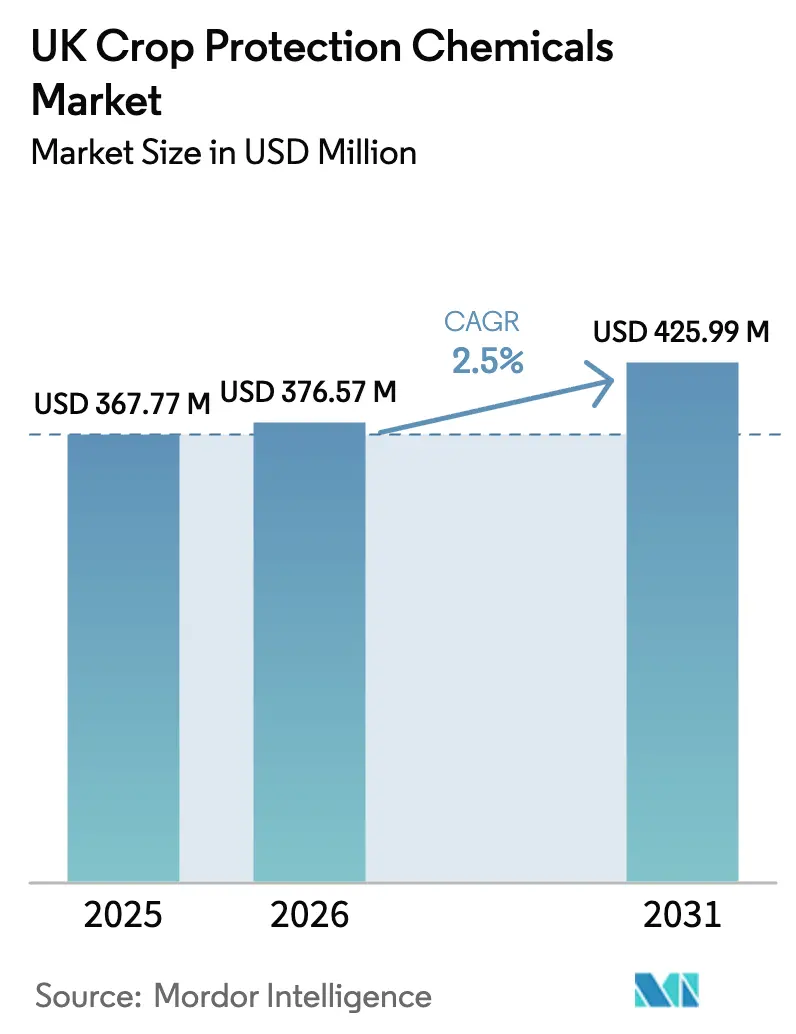
| Base Year Market Size (2025) | USD 367.77 Million |
| Market Size (2026) | USD 376.57 Million |
| Market Size (2031) | USD 425.99 Million |
| Growth Rate (2026 - 2031) | 2.50% CAGR |
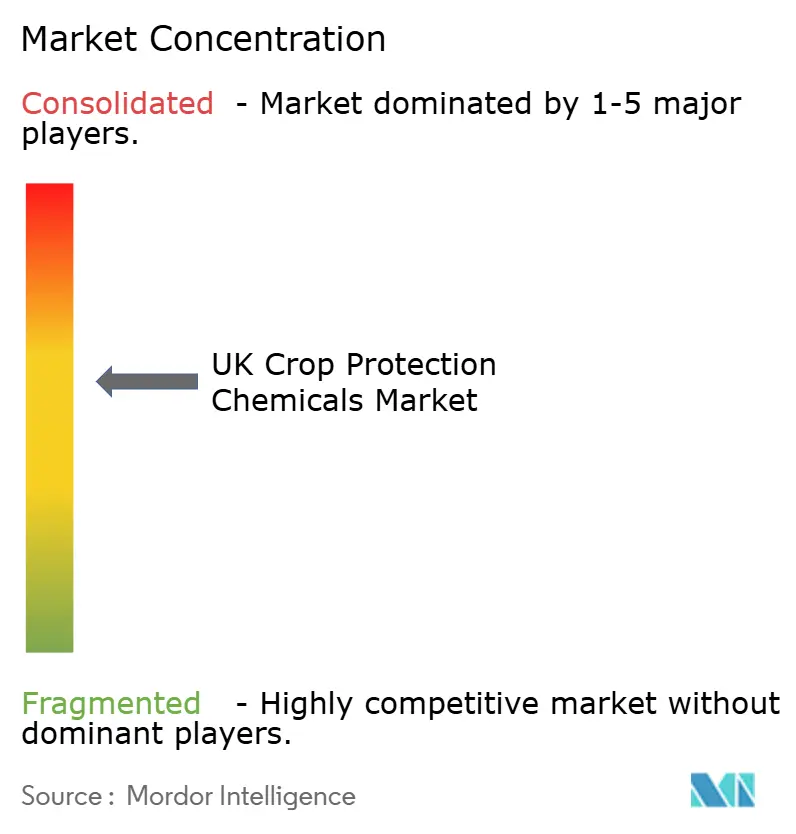
| Market Concentration | Medium |
Major Players
*Disclaimer: Major Players sorted in no particular order Image © Mordor Intelligence. Reuse requires attribution under CC BY 4.0. |
|
UK Crop Protection Chemicals Market Analysis by Mordor Intelligence
The UK crop protection chemicals market size was valued at USD 367.77 million in 2025 and is projected to grow from USD 376.57 million in 2026 to reach USD 425.99 million by 2031, at a CAGR of 2.50% during the forecast period (2026-2031). The measured pace reflects an uneasy balance between tighter national reduction targets and the continued spread of fungal and insect pests spurred by wetter springs. Faster approval of off-patent molecules following Brexit is tempering cost inflation for growers, even as the government’s 2025 National Action Plan pushes every Pesticide Load Indicator metric toward a 10% cut by 2030 [1]Source: UK Government, “UK Pesticides National Action Plan 2025,” gov.uk. Demand is shifting toward premium, resistance-breaking actives and digital field-scouting services that keep application volumes in check while lifting average spending per hectare. Meanwhile, headline regulatory risks tied to the phase-out of glyphosate and the final sunset of neonicotinoid emergency authorizations by late 2027 are compressing the launch window for next-generation alternatives.
Key Report Takeaways
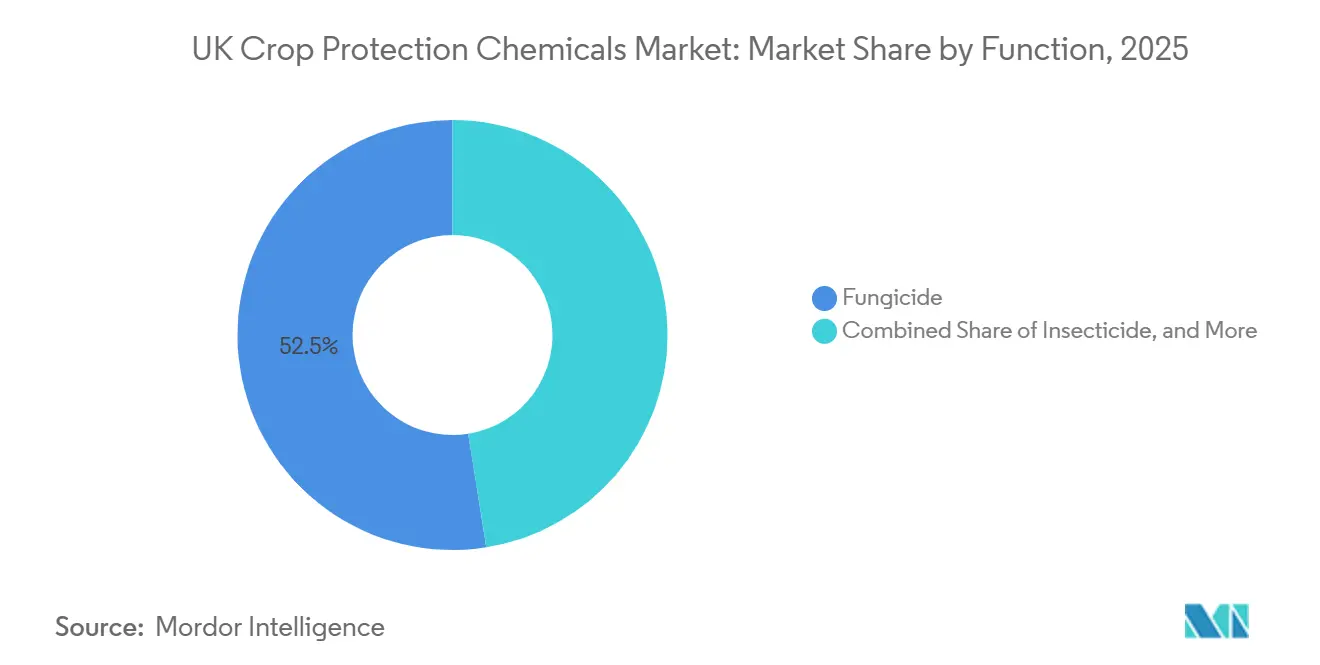
- By function, fungicides led with 52.5% of the UK crop protection chemicals market share in 2025, while molluscicides are projected to advance at a 5.3% CAGR through 2031.
- By application mode, foliar treatments accounted for 48.7% of the UK crop protection chemicals market size in 2025, and soil treatment is the fastest-growing mode with a 2.9% CAGR over 2026-2031.
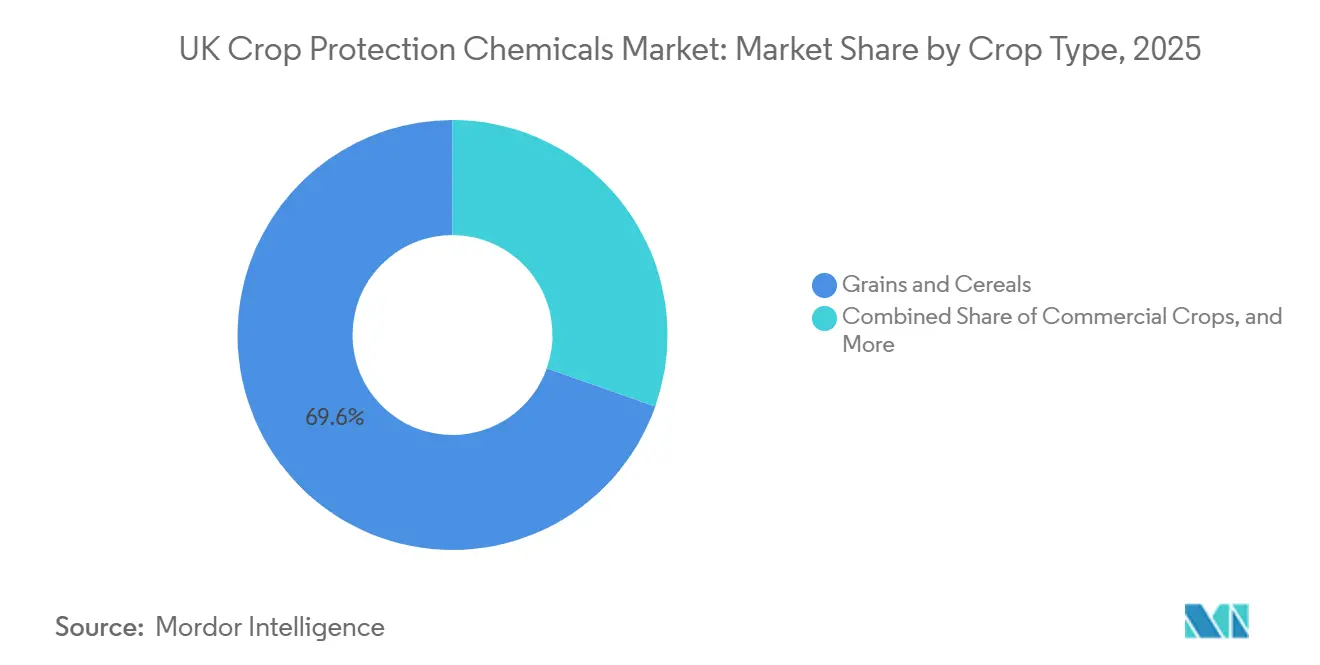
- By crop type, grains and cereals captured 69.6% of spending in 2025, and are forecast to expand at a 2.7% CAGR to 2031.
- The market concentration is moderate, with Bayer AG, Syngenta Group, BASF SE, Corteva Agriscience, and Nufarm Limited collectively holding the majority of the market share in 2025.
Note: Market size and forecast figures in this report are generated using Mordor Intelligence’s proprietary estimation framework, updated with the latest available data and insights as of January 2026.
UK Crop Protection Chemicals Market Trends and Insights
Drivers Impact Analysis*
| Driver | (~) % Impact on CAGR Forecast | Geographic Relevance | Impact Timeline |
|---|---|---|---|
| Rising resistance-management programs | +0.3% | East Anglia and Yorkshire cereal belts | Medium term (2-4 years) |
| Surge in post-Brexit research and development tax credits boosting domestic innovation | +0.2% | South East and East of England | Long term (≥4 years) |
| Growing adoption of digital scouting platforms among large arable farms | +0.3% | East Anglia, Lincolnshire and Yorkshire | Medium term (2-4 years) |
| Increasing prevalence of cereal fungal diseases due to wetter springs | +0.3% | Western and northern wheat zones | Short term (≤2 years) |
| Expanded off-patent molecule registrations | +0.2% | National | Medium term (2-4 years) |
| Emergence of carbon-credit premiums tied to lower fungicide residues | +0.1% | Pilot schemes in East Anglia and Midlands | Long term (≥4 years) |
| Source: Mordor Intelligence | |||
Rising Resistance-Management Programs
Erosion of efficacy in several high-use modes of action has prompted the Agriculture and Horticulture Development Board (AHDB) to fund a USD 136,000 (GBP 107,500) monitoring project that runs through 2028 [2]Source: Agriculture and Horticulture Development Board, “Contract to Monitor Fungicide Resistance,” ahdb.org.uk. Cabbage stem flea beetle now shows widespread pyrethroid resistance, forcing oilseed rape growers to rotate chemistries and purchase higher-priced actives. Corteva Agriscience’s Inatreq and similar multi-site fungicides bundle resistance-management advice into product labels, lifting per-hectare spend even as treated-hectare counts flatten. Because resistance data feed directly into renewal dossiers, formulators gain a commercial incentive to position premium mixtures over single-site generics. This dynamic supports the growth that underpins the UK crop protection chemicals market. Continued funding to 2028 ensures a rolling evidence base that reinforces rotation discipline.
Surge in Post-Brexit Research and Development Tax Credits Boosting Domestic Innovation
The United Kingdom's crop protection chemicals innovation landscape has been notably reshaped by post-Brexit reforms to Research and Development tax credits. The government, in its bid to spotlight "high-value" domestic innovation, has consolidated various schemes. This strategic pivot has coincided with a sharp 26% year-on-year decline in the total number of claims [3]Source: UK Government, “Corporation Tax R&D Relief,” gov.uk. Bayer AG’s CropKey hub now records three times as many early-stage modes of action as a decade ago, while FMC Corporation registered Fundatis herbicide using the streamlined Great Britain pathway in July 2025. Mid-tier firms such as UPL Limited and Nufarm Limited are also exploiting the credit to bring generics and value-added mixtures to market, narrowing the innovation gap with multinationals. In the long run, the Genetic Technology Act's secondary legislation paves the way for complementary gene-edited traits that help reduce chemical usage.
Growing Adoption of Digital Scouting Platforms Among Large Arable Farms
The 2024 introduction of Bayer AG’s MagicTrap, an image-recognition device designed to monitor cabbage stem flea beetle and pollen beetle thresholds, has shifted pest control practices from calendar-based spraying to real-time threshold-based decision-making. Large farms in East Anglia have reported significant reductions in insecticide expenses without compromising yields. Retail chains have responded positively to the reduction in pesticide residues, aligning with Red Tractor audit findings that highlighted instances of samples exceeding Maximum Residue Levels (MRLs) in 2024. In the medium term, this development is projected to stabilize spray volumes while increasing service subscription revenues bundled with premium active ingredients, contributing to the overall growth of the UK crop protection chemicals market.
Expanded Off-Patent Molecule Registrations
The autonomy of Great Britain has accelerated the approval process for generic products, enabling the swift authorization of Nufarm Limited Glyphosate 360 and UPL Limited Zidua herbicide. Although supply disruptions in the recent past led to a significant increase in glyphosate prices, generics have played a crucial role in limiting retail margins and ensuring product availability ahead of the anticipated phase-out. The introduction of more affordable alternatives has facilitated greater adoption among cost-sensitive arable units, contributing to the growth of the UK crop protection chemicals market over the coming years. However, these benefits are projected to decline once glyphosate is completely phased out, emphasizing the temporary nature of this growth factor.
Restraints Impact Analysis*
| Restraint | (~) % Impact on CAGR Forecast | Geographic Relevance | Impact Timeline |
|---|---|---|---|
| Accelerated phase-out of glyphosate and neonicotinoids | -0.6% | National | Short term (≤2 years) |
| Rapid rise of acreage under organic conversion | -0.2% | Scotland and South West England | Medium term (2-4 years) |
| Farmer enrollment in regenerative-agriculture schemes limiting pesticide budgets | -0.3% | East Anglia and Midlands | Medium term (2-4 years) |
| Stringent Red Tractor residue audits at retail chains | -0.2% | National supermarket supply chains | Short term (≤2 years) |
| Source: Mordor Intelligence | |||
Rapid Rise of Acreage Under Organic Conversion
Organic farming in the United Kingdom reached 503 thousand hectares in 2024, reflecting a 1.0% increase from 2023, supported by stable consumer premiums and policy incentives [4]Source: UK Government, "Organic farming statistics 2024: United Kingdom," gov.uk. Scotland and South West England account for the majority of new applicants, largely driven by premium feed and food contracts. However, conversion rules prohibit the use of synthetic chemicals for up to three years, effectively removing these hectares from the addressable crop protection chemicals market and constraining overall market growth.
Stringent Red Tractor Residue Audits at Retail Chains
Residue testing conducted in 2024 identified a small proportion of samples that surpassed the established Maximum Residue Levels. This discovery led supermarkets to enforce more stringent procurement policies and require comprehensive documentation of pre-harvest intervals. Furthermore, data from Co-op showed that a significant share of produce samples in the United Kingdom contained detectable residues, intensifying public concern and scrutiny. In response, growers have been modifying their practices by lowering application rates or opting for active ingredients that result in reduced residue levels. These adjustments have led to a slight decline in growth rates, with the greatest impact observed in fruit and vegetable chemistries. However, grains and cereals are also increasingly coming under similar pressures from retailers.
*Our forecasts treat driver/restraint impacts as directional, not additive. The impact forecasts reflect baseline growth, mix effects, and variable interactions.
Segment Analysis
By Function: Fungicide Anchor Market Amid Disease Pressure
Fungicides are the largest segment and captured 52.5% of the UK crop protection chemicals market share in 2025, reflecting the unrelenting threat of Septoria tritici in wheat and the emergency response to virus yellows in sugar beet. Although the National Action Plan (NAP) tightens active-loading caps, multi-site mixtures such as BASF SE Revystar XE sustain demand by combating resistant strains. Growers also value the extended curative window these combinations provide under wetter spring conditions. Even with volume discipline, higher per-hectare spend keeps fungicide value growth ahead of the broader UK crop protection chemicals market.
Molluscicides are forecast to post the fastest growth at a 5.3% CAGR through 2031 as mild winters and wet autumns boost slug populations. Ferric phosphate and metaldehyde products fill a critical niche in integrated pest management when cultural measures prove insufficient. Formulators are pairing slug pellets with farm-level weather dashboards that flag peak migration periods, an approach that commands a service premium. The differential growth trajectory underscores the opportunity for niche actives that address climate-driven pest surges inside the UK crop protection chemicals market.


By Application Mode: Foliar Dominates Yet Soil Treatment Gains Ground
Foliar is the largest application mode and retained 48.7% of the UK crop protection chemicals market size in 2025 revenue, due to its central role in post-emergence weed and disease control across millions of hectares of cereals. Retail residue audits and variable weather windows, however, are pressuring growers to reduce the total number of passes. As a result, formulators differentiate through systemic products that deliver longer protection at lower dose rates, stabilizing foliar revenues inside the UK crop protection chemicals market.
Soil treatment is projected to expand at a 2.9% CAGR through 2031, the swiftest among modes, as pre-emergence herbicides and seed-applied fungicides move intervention earlier in the season. Growers value the ability to lock in control before rainfall limits field access, and generics in the pre-emergence space lower entry costs. Corteva Agriscience's Ympact and Bayer AG's Broadway Ultra exemplify the shift, demonstrating how soil- and seed-based technologies help absorb some of the volume lost from reduced foliar sprays. Chemigation remains a limited practice, primarily used for high-value horticultural crops, where drip and pivot irrigation systems enable the precise application of fungicides and nematicides. Fumigation represents the smallest segment, restricted by regulatory limitations on methyl bromide and 1,3-dichloropropene. The remaining demand is focused on potato and strawberry cultivation, where the presence of soil-borne pathogens justifies the associated costs and complexity.
By Crop Type: Cereals Anchor Growth While Diversification Emerges
Grains and cereals are the largest crop type, accounting for 69.6% of the UK crop protection chemicals market share in 2025 and driving a 2.7% CAGR through 2031, reflecting a significant area committed to wheat and barley rotations. Septoria tritici outbreaks keep fungicide programs robust, while herbicide rotations pivot from glyphosate to costlier but compliant alternatives, cementing cereals as the revenue backbone of the UK crop protection chemicals market. Barley cultivation continues to benefit from consistent demand for malting and livestock feed, supporting the use of fungicides and herbicides, even with the sustainable farming incentive promoting reduced input intensity.
Pulses and oilseeds constitute the second-largest crop segment. The acreage of oilseed rape has declined from its peak levels due to challenges such as cabbage stem flea beetle infestations and pyrethroid resistance. Bayer AG introduced the MagicTrap automated pest-monitoring system in June 2024, which helps growers optimize the timing of pyrethroid alternatives, minimizing unnecessary applications and reducing residue risks. Fruits and vegetables account for a smaller share of the crop segment but require higher per-hectare spending due to intensive fungicide and insecticide programs needed to meet retail-chain residue standards. Commercial crops, such as sugar beet and potatoes, are under significant pest pressure, with virus yellows incidence increase in 2024. However, regulatory restrictions on neonicotinoids and fumigants limit the available pest control options.
Geography Analysis
Eastern arable heartlands such as East Anglia and Lincolnshire account for the largest share of the UK crop protection chemicals market, owing to dense rotations of wheat, barley, and oilseed rape. Growers here are early adopters of Bayer AG's MagicTrap and similar digital aids that cut insecticide passes, balancing the higher unit cost of premium mixtures against reduced volumes. Generic glyphosate and Zidua registrations have further tempered cost outlays in these cost-sensitive yet high-input counties.
Yorkshire, the North East, and parts of the Midlands witnessed intensified fungicide use after consecutive wet springs fostered Septoria tritici and Ramularia epidemics. The Agriculture and Horticulture Development Board (AHDB) resistance-tracking contract underscores how local pathogen pressure can influence national registration priorities. At the same time, pilot carbon-credit schemes in the Midlands reward growers for lower fungicide loads, creating divergent spend patterns within short driving distances.
Scotland, Northern Ireland, Wales, and South West England collectively exhibit lower pesticide intensity because of higher organic conversion rates and more mixed farming. According to the Scottish government, in 2024, 105,000 hectares were farmed fully organically in Scotland, representing an increase of 1.4% from 2023 and 26% from 2018, effectively limiting chemical demand [5]Source: Scottish Government, "Organic Farming in Scotland: 2024," gov.scot. Coastal and upland microclimates also boost slug activity, explaining the above-average molluscicide uptake forecast in Western counties. As glyphosate withdrawals accelerate nationwide, regions relying on min-till systems face the steepest retooling costs, a factor likely to shift expenditure toward integrated mechanical and chemical packages.
Competitive Landscape
The market shows moderate concentration with the top five participants, Bayer AG, Syngenta Group, BASF SE, Corteva Agriscience, and Nufarm Limited, collectively holding the majority of the market share in 2025. Bayer AG, Syngenta Group, BASF SE, Corteva Agriscience, and FMC Corporation controlled the majority of registrations in 2025 and leveraged their organizations to access economic resources, technology, and operational efficiency licenses to keep pipelines flowing despite tougher data requirements. Bayer AG’s Crop Science division articulated a mid-20 percent EBITDA margin ambition by 2029, banking on new modes of action and sustainability-linked pricing to offset volume headwinds. Syngenta deepened its turf and ornamental footprint through a 2024 launch that eyes higher per-hectare margins outside broad-acre crops.
Post-Brexit generic pathways opened space for UPL Limited and Nufarm Limited, which delivered lower-priced glyphosate and Zidua alternatives that captured share in price-sensitive segments. These challengers combine commodity actives with convenience packaging, such as easy-connect caps, to align with Red Tractor sprayer certification rules. Mid-tier specialists like Certis Belchim B.V. (Mitsui & Co., Ltd.) and Nichino Europe Co., Ltd. lean on co-marketing pacts and niche actives to punch above their weight in horticulture and amenity markets.
A focal point across all tiers is digital integration. Corteva Agriscience’s Inatreq stewardship apps illustrate how bundled services enhance stickiness and defend margin even as regulator-driven load caps limit liters sold. As neonicotinoids and glyphosate exit approaches in 2027, incumbents race to secure alternative herbicide labels, while newcomers hope that speedier generic reviews will close their innovation gap. Failure to adapt carries outsized risk because supermarket residue audits already squeeze underperforming active portfolios.
UK Crop Protection Chemicals Industry Leaders
-
BASF SE
-
Bayer AG
-
Corteva Agriscience
-
Nufarm Limited
-
Syngenta Group
- *Disclaimer: Major Players sorted in no particular order

Recent Industry Developments
- December 2025: BASF SE and ADAMA have formed a strategic partnership to jointly develop and commercialize Gilboa (flumetylsulforim), a broad-spectrum fungicide designed for European cereal growers, including the United Kingdom. This collaboration integrates ADAMA’s FRAC Group 32 active ingredient with BASF SE’s development expertise and market presence.
- July 2025: FMC Corporation has obtained registration in Great Britain for Fundatis herbicide, powered by the Isoflex active ingredient, for application in winter wheat and winter barley. Isoflex Active is a new herbicide for use in cereals and is classified by the Herbicide Resistance Action Committee (HRAC) as a Group 13 herbicide.
- April 2025: Syngenta Group has inaugurated its advanced manufacturing facility in Huddersfield, United Kingdom. Known as the Huddersfield Plant, this facility is dedicated to large-scale production of PLINAZOLIN (an Isoxazoline insecticide), an innovative crop protection product. The initiative seeks to deliver more effective agricultural solutions to address the global challenge of pesticide-resistant pests.
- February 2025: ADAMA has introduced three new fungicide co-formulations in the United Kingdom. Each product contains the active ingredient prothioconazole, with two formulations also utilizing ADAMA’s proprietary AsorbitalTM formulation technology to deliver faster protection against major cereal and oilseed rape diseases.


UK Crop Protection Chemicals Market Report Scope
Crop protection chemicals, also known as pesticides, are substances used in agriculture to protect crops from pests, diseases, and weeds. These chemicals play a crucial role in preserving crop yield and ensuring the quality of agricultural produce by preventing, eliminating, or deterring organisms that compete for nutrients or cause harm.
The UK crop protection chemicals market report is segmented by function including fungicide, herbicide, insecticide, molluscicide, and nematicide, by application mode including chemigation, foliar, fumigation, seed treatment, and soil treatment, and by crop type including commercial crops, fruits and vegetables, grains and cereals, pulses and oilseeds, and turf and ornamental. The market forecasts are provided in terms of value in USD and volume in metric tons.
By Function
| Fungicide |
| Herbicide |
| Insecticide |
| Molluscicide |
| Nematicide |
By Application Mode
| Chemigation |
| Foliar |
| Fumigation |
| Seed Treatment |
| Soil Treatment |
By Crop Type
| Commercial Crops |
| Fruits and Vegetables |
| Grains and Cereals |
| Pulses and Oilseeds |
| Turf and Ornamental |
| By Function | Fungicide |
| Herbicide | |
| Insecticide | |
| Molluscicide | |
| Nematicide | |
| By Application Mode | Chemigation |
| Foliar | |
| Fumigation | |
| Seed Treatment | |
| Soil Treatment | |
| By Crop Type | Commercial Crops |
| Fruits and Vegetables | |
| Grains and Cereals | |
| Pulses and Oilseeds | |
| Turf and Ornamental |


Market Definition
- Function - Crop Protection Chemicals are apllied to control or prevent pests, including insects, fungi, weeds, nematodes, and mollusks, from damaging the crop and to protect the crop yield.
- Application Mode - Foliar, Seed Treatment, Soil Treatment, Chemigation, and Fumigation are the different type of application modes through which crop protection chemicals are applied to the crops.
- Crop Type - This represents the consumption of crop protection chemicals by Cereals, Pulses, Oilseeds, Fruits, Vegetables, Turf, and Ornamental crops.
| Keyword | Definition |
|---|---|
| IWM | Integrated weed management (IWM) is an approach to incorporate multiple weed control techniques throughout the growing season to give producers the best opportunity to control problematic weeds. |
| Host | Hosts are the plants that form relationships with beneficial microorganisms and help them colonize. |
| Pathogen | A disease-causing organism. |
| Herbigation | Herbigation is an effective method of applying herbicides through irrigation systems. |
| Maximum residue levels (MRL) | Maximum Residue Limit (MRL) is the maximum allowed limit of pesticide residue in food or feed obtained from plants and animals. |
| IoT | The Internet of Things (IoT) is a network of interconnected devices that connect and exchange data with other IoT devices and the cloud. |
| Herbicide-tolerant varieties (HTVs) | Herbicide-tolerant varieties are plant species that have been genetically engineered to be resistant to herbicides used on crops. |
| Chemigation | Chemigation is a method of applying pesticides to crops through an irrigation system. |
| Crop Protection | Crop protection is a method of protecting crop yields from different pests, including insects, weeds, plant diseases, and others that cause damage to agricultural crops. |
| Seed Treatment | Seed treatment helps to disinfect seeds or seedlings from seed-borne or soil-borne pests. Crop protection chemicals, such as fungicides, insecticides, or nematicides, are commonly used for seed treatment. |
| Fumigation | Fumigation is the application of crop protection chemicals in gaseous form to control pests. |
| Bait | A bait is a food or other material used to lure a pest and kill it through various methods, including poisoning. |
| Contact Fungicide | Contact pesticides prevent crop contamination and combat fungal pathogens. They act on pests (fungi) only when they come in contact with the pests. |
| Systemic Fungicide | A systemic fungicide is a compound taken up by a plant and then translocated within the plant, thus protecting the plant from attack by pathogens. |
| Mass Drug Administration (MDA) | Mass drug administration is the strategy to control or eliminate many neglected tropical diseases. |
| Mollusks | Mollusks are pests that feed on crops, causing crop damage and yield loss. Mollusks include octopi, squid, snails, and slugs. |
| Pre-emergence Herbicide | Preemergence herbicides are a form of chemical weed control that prevents germinated weed seedlings from becoming established. |
| Post-emergence Herbicide | Postemergence herbicides are applied to the agricultural field to control weeds after emergence (germination) of seeds or seedlings. |
| Active Ingredients | Active ingredients are the chemicals in pesticide products that kill, control, or repel pests. |
| United States Department of Agriculture (USDA) | The Department of Agriculture provides leadership on food, agriculture, natural resources, and related issues. |
| Weed Science Society of America (WSSA) | The WSSA, a non-profit professional society, promotes research, education, and extension outreach activities related to weeds. |
| Suspension concentrate | Suspension concentrate (SC) is one of the formulations of crop protection chemicals with solid active ingredients dispersed in water. |
| Wettable powder | A wettable powder (WP) is a powder formulation that forms a suspension when mixed with water prior to spraying. |
| Emulsifiable concentrate | Emulsifiable concentrate (EC) is a concentrated liquid formulation of pesticide that needs to be diluted with water to create a spray solution. |
| Plant-parasitic nematodes | Parasitic Nematodes feed on the roots of crops, causing damage to the roots. These damages allow for easy plant infestation by soil-borne pathogens, which results in crop or yield loss. |
| Australian Weeds Strategy (AWS) | The Australian Weeds Strategy, owned by the Environment and Invasives Committee, provides national guidance on weed management. |
| Weed Science Society of Japan (WSSJ) | WSSJ aims to contribute to the prevention of weed damage and the utilization of weed value by providing the chance for research presentation and information exchange. |


Research Methodology
Mordor Intelligence follows a four-step methodology in all our reports.
- Step-1: Identify Key Variables: In order to build a robust forecasting methodology, the variables and factors identified in Step-1 are tested against available historical market numbers. Through an iterative process, the variables required for market forecast are set and the model is built on the basis of these variables.
- Step-2: Build a Market Model: Market-size estimations for the forecast years are in nominal terms. Inflation is not a part of the pricing, and the average selling price (ASP) is kept constant throughout the forecast period.
- Step-3: Validate and Finalize: In this important step, all market numbers, variables and analyst calls are validated through an extensive network of primary research experts from the market studied. The respondents are selected across levels and functions to generate a holistic picture of the market studied.
- Step-4: Research Outputs: Syndicated Reports, Custom Consulting Assignments, Databases & Subscription Platforms


