
Market Overview
| Study Period | 2020 - 2031 |
|---|---|
| Forecast Data Period | 2026 - 2031 |
| Base Year Market Size (2025) | USD 238.77 Million |
| Market Size (2026) | USD 262.24 Million |
| Market Size (2031) | USD 419.18 Million |
| Growth Rate (2026 - 2031) | 9.83 % |
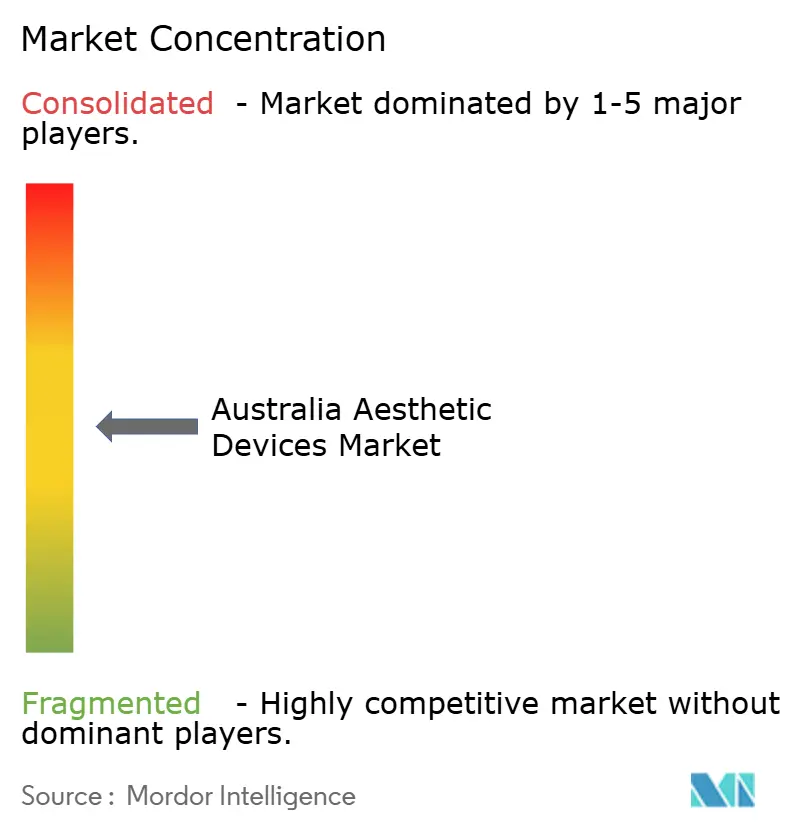
| Market Concentration | Medium |
Major Players *Disclaimer: Major Players sorted in no particular order Image © Mordor Intelligence. Reuse requires attribution under CC BY 4.0. | |
Australia Aesthetic Devices Market Analysis by Mordor Intelligence
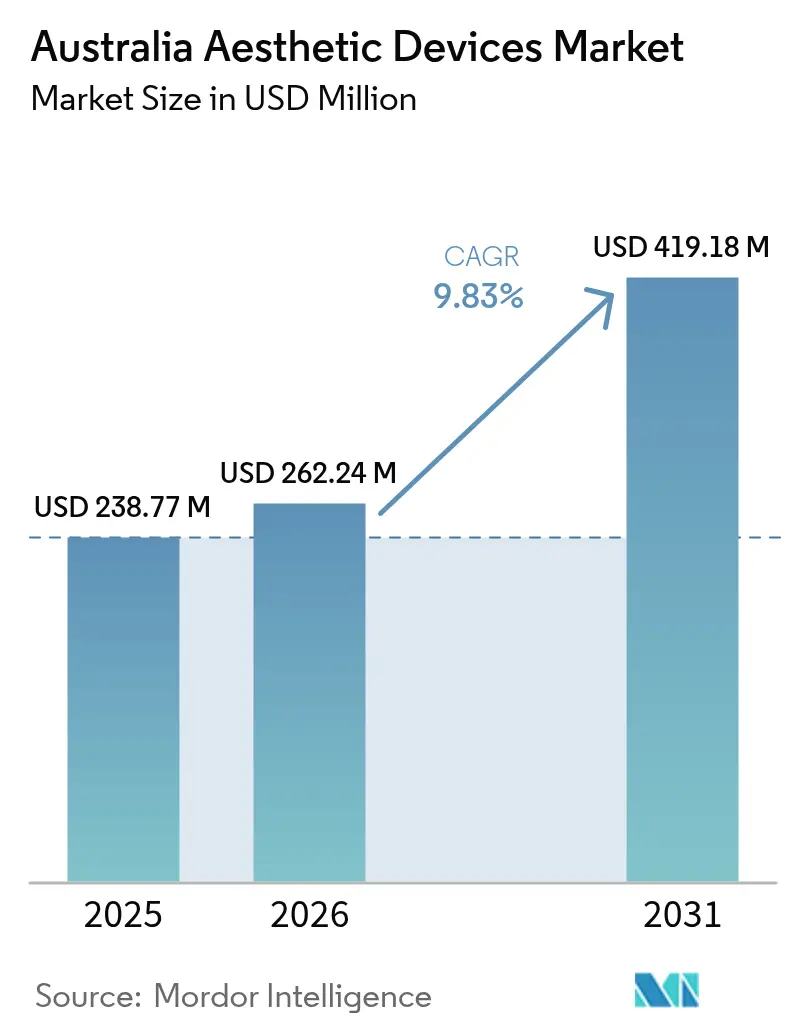
Australia Aesthetic Devices Market size in 2026 is estimated at USD 262.24 million, growing from 2025 value of USD 238.77 million with 2031 projections showing USD 419.18 million, growing at 9.83% CAGR over 2026-2031.
Demand is accelerating as affluent millennials normalize cosmetic enhancements, lifting procedure volumes well beyond the growth seen in most traditional medical specialties. Energy-based platforms, led by lasers and radiofrequency systems, capture spend because they address multiple indications while offering rapid payback for clinics that face rising labor and rent costs. At the same time, regulatory tailwinds such as streamlined collaborative-practice rules for nurse practitioners expand treatment capacity and reduce wait times for both local and inbound medical-tourism patients. Currency swings create a mixed picture: a softer Australian dollar boosts the country’s pricing appeal for overseas patients, yet it inflates acquisition costs for the 85% of aesthetic devices that clinics import.
Key Report Takeaways
- By device type, energy-based systems led with 57.12% revenue share in 2025; ultrasound-based technologies are forecast to expand at a 12.12% CAGR through 2031.
- By application, skin resurfacing and tightening captured 26.84% of the Australia aesthetic devices market size in 2025, while body contouring and cellulite reduction is advancing at an 11.08% CAGR through 2031.
- By end user, hospitals held 41.55% of the Australia aesthetic devices market share in 2025, whereas aesthetic clinics are projected to grow at a 13.02% CAGR to 2031.
Note: Market size and forecast figures in this report are generated using Mordor Intelligence’s proprietary estimation framework, updated with the latest available data and insights as of 2026.
Australia Aesthetic Devices Market Trends and Insights
Drivers Impact Analysis*
| Driver | (~) % Impact on CAGR Forecast | Geographic Relevance | Impact Timeline |
|---|---|---|---|
| Rising Demand for Minimally Invasive Cosmetic Procedures Among Affluent Millennials | +2.1% | National, concentrated in Sydney, Melbourne, Brisbane | Medium term (2-4 years) |
| Increasing Medical Tourism from New Zealand and Southeast Asia | +1.3% | National, with early gains in Sydney, Gold Coast, Melbourne | Long term (≥ 4 years) |
| Frequent Upgrades in Energy-Based Device Technologies | +1.8% | Global | Short term (≤ 2 years) |
| Expansion of Aesthetic Clinic Franchises in Tier-2 Cities | +1.4% | National, focusing on regional centers | Medium term (2-4 years) |
| Regulatory Support for Nurse-Led Cosmetic Injectables | +0.9% | National, varying by state regulations | Medium term (2-4 years) |
| Social Media Influence and Beauty Culture Trends | +1.7% | Global, amplified in urban Australia | Short term (≤ 2 years) |
| Source: Mordor Intelligence | |||
Rising Demand for Minimally Invasive Cosmetic Procedures Among Affluent Millennials
Millennials drive more than half of all cosmetic consultations in Australia, and survey data indicate that 59% of this cohort is considering a procedure within the next decade.[1]Australasian College of Cosmetic Surgery and Medicine, “More Than a Third of Australians Considering Cosmetic Surgery,” accsm.org.au High disposable incomes and a focus on preventative care translate into early adoption of neuromodulators, fractional lasers, and radiofrequency microneedling. Patient journeys increasingly resemble wellness subscriptions, with clinics packaging quarterly maintenance sessions to sustain subtle results. This steady cadence boosts consumables turnover and device utilization, strengthening supplier–clinic partnerships. Clinics also leverage membership programs that spread treatment costs over 12-month plans, improving cash-flow predictability while building patient loyalty. As millennials progress into peak earnings years, lifetime treatment spending is expected to keep the Australia aesthetic devices market on a double-digit expansion path.
Increasing Medical Tourism from New Zealand and Southeast Asia
Australia’s stringent safety regulations and English-language care make it a trusted destination for regional patients seeking advanced aesthetic solutions. The November 2024 abolition of mandatory collaborative agreements for nurse practitioners frees skilled providers to operate more autonomously, trimming staffing overhead and shortening scheduling backlogs.[2]Australian Government Department of Health, “Collaborative Arrangements,” health.gov.au A weaker Australian dollar further widens the price gap versus Singapore and South Korea, especially for full-face laser resurfacing and multi-area body-contouring packages that exceed USD 5,000 per visit. Hospitals in Sydney and the Gold Coast now advertise bundled hotel-and-procedure packages that mirror dental-tourism models, signaling growing professionalism in cross-border marketing. Device manufacturers benefit as clinics upgrade to flagship workstations to remain competitive with Asian peers, accelerating capital-equipment turnover every three to four years.
Frequent Upgrades in Energy-Based Device Technologies
The past 24 months have delivered step-change improvements in pulse-duration control, epidermal cooling, and AI-assisted endpoint detection. High-intensity focused ultrasound handpieces now achieve therapeutic temperatures within 60 seconds while maintaining epidermal temperatures below discomfort thresholds, according to peer-reviewed trials.[3]Frontiers in Bioengineering and Biotechnology, “Radio Frequency Hyperthermia System for Skin Tightening Effect,” frontiersin.org Early adopters tout 25% higher patient-satisfaction scores and a one-session reduction versus previous-generation devices, directly improving clinic profitability. Real-time tracking of impedance and skin-temperature gradients enhances safety, satisfying regulators who increasingly scrutinize adverse-event data. Vendors market subscription-based software updates that unlock new protocols without hardware swaps, creating a recurring-revenue layer that lifts lifetime value per installed system. These upgrades reinforce the dominance of energy platforms in the Australia aesthetic devices market and prompt practitioners to retire depreciated units earlier than planned.
Social Media Influence and Beauty Culture Trends
TikTok filters and influencer testimonials continue to re-define aesthetic ideals triggering spikes in demand for treatments that correct so-called “Ozempic face” or deliver “glass skin.” Academic work links heavy social-media usage to a more favorable view of cosmetic surgery among Australian women aged 18-29. Clinics funnel paid content to these cohorts, pushing appointment links directly into Instagram Stories while staying within TGA advertising rules that prohibit before-and-after photos for injectables. Hashtag-driven trends accelerate product diffusion: ultrathin cannulas for filler placement sold out nationally within three weeks of a viral post on buccal-fat reduction. Yet regulators are quick to intervene, as seen in the 2024 ban on colloquial filler terms, forcing marketers to adopt clinically precise language. The balancing act between viral reach and compliance is reshaping in-house marketing functions and catalyzing demand for digital-savvy clinic staff.
Restraints Impact Analysis*
| Restraint | (~) % Impact on CAGR Forecast | Geographic Relevance | Impact Timeline |
|---|---|---|---|
| Legal Exposure from Inadequate Post-Treatment Follow-Up | -1.2% | National, varying by state liability frameworks | Medium term (2-4 years) |
| Foreign Exchange Volatility Impacting Device Costs | -1.1% | National, with higher impact on import-dependent clinics | Short term (≤ 2 years) |
| Shortage of Skilled Aesthetic Practitioners in Regional Areas | -0.8% | Regional Australia, particularly remote areas | Long term (≥ 4 years) |
| Regulatory Complexity Around Device Classification and Use | -0.9% | National, with state-specific variations | Medium term (2-4 years) |
| Source: Mordor Intelligence | |||
Legal Exposure from Inadequate Post-Treatment Follow-Up
Queensland tightened Schedule 4 injectable rules in 2025, barring nurses from independently purchasing or storing prescription-only toxins and fillers. Providers must now document physician oversight at every stage, adding administrative time and raising malpractice-insurance premiums. Legal advisors report a 19% uptick in aesthetic litigation filings since mid-2024, largely tied to inadequate post-procedure monitoring. Clinics respond by hiring dedicated care-coordinators who conduct 48-hour digital check-ins, but the added payroll erodes margins. Device selection is also shifting toward platforms with built-in safety analytics that auto-populate medical records, creating new differentiation for premium systems.
Foreign Exchange Volatility Impacting Device Costs
Australia’s 85% import reliance exposes providers to currency risk, and a 7% slide in the AUD-USD rate during 2024 raised landed prices for flagship laser platforms by almost AUD 15,000 (USD 9,600). Smaller clinics defer upgrades when exchange-rate spikes push lease payments above cash-flow thresholds. Vendors have begun offering hedged pricing and multi-year service bundles to soften volatility, but such structures lock clinics into longer commitments, limiting operational agility. Consumable costs follow a similar pattern: radiofrequency tips and laser fibers are invoiced in USD, prompting clinics to hold larger inventories when the dollar weakens, tying up working capital. This cost pressure squeezes margins for price-sensitive procedures like hair removal, forcing some operators to pivot toward higher-ticket combination therapies that justify premium pricing.
*Our forecasts treat driver/restraint impacts as directional, not additive. The impact forecasts reflect baseline growth, mix effects, and variable interactions.
Segment Analysis
By Device Type: Energy Platforms Drive Innovation
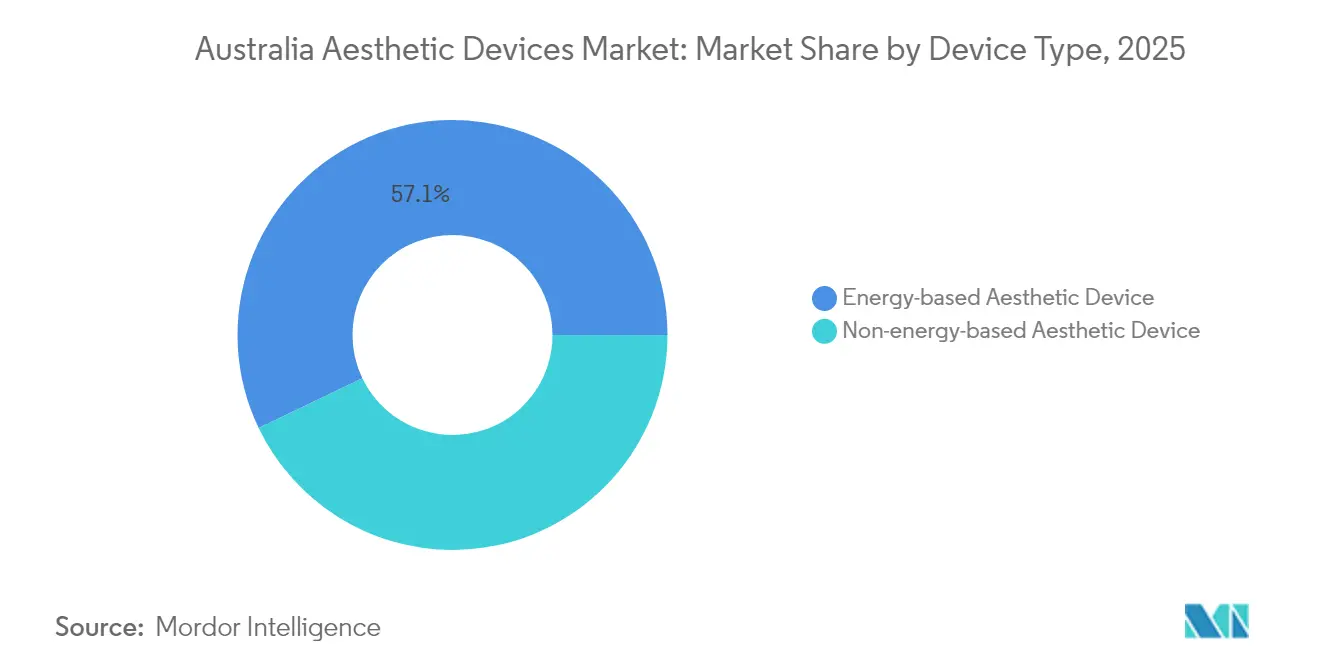
Energy-based systems commanded 57.12% revenue in 2025, and their versatility keeps clinics dependent on continuous upgrades that sustain a sizeable slice of the Australia aesthetic devices market. Lasers dominate legacy indications such as hair removal and photorejuvenation, yet radiofrequency devices are capturing share in skin-tightening because bipolar configurations deliver controlled dermal heating with minimal downtime. Competition increasingly revolves around software; top vendors push AI-guided fluence presets that shorten clinician learning curves and reduce adverse events. Consumables economics add further stickiness: single-use RF tips and laser fibers create recurring income streams that anchor vendor–provider relationships across multi-year equipment leases. Ultrasound devices remain the fastest-growing subcategory at a 12.12% CAGR through 2031, helped by clinical studies showing two-millimeter focal precision and collagen-remodeling depths unattainable with other modalities.
Non-energy products hold 42.88% share, led by botulinum toxin and hyaluronic-acid fillers that together surpass 4 million units annually. Tightened advertising rules around injectables spur demand for coursework on compliant marketing and cross-selling, positioning pharmaceuticals and capital equipment as mutually reinforcing revenue pillars. Dermal-thread lifting is also trending, with new polydioxanone designs delivering 18-month longevity, doubling the retention window versus older barbed threads. Clinics in coastal Queensland and regional New South Wales now bundle threads with fractional RF microneedling to capture combined procedure fees exceeding AUD 4,500 (USD 2,900). Regulatory scrutiny favors established filler brands with extensive safety dossiers, indirectly supporting global majors that can fund the post-market surveillance studies demanded under evolving TGA guidelines.



By Application: Body Contouring Gains Momentum
Skin resurfacing and tightening retained a 26.84% slice of the 2025 Australia aesthetic devices market share, fueled by an aging yet still professionally active population seeking subtle rejuvenation. Fractional laser platforms capable of 120-micron ablation depths reduce recovery times to under five days, a threshold many professionals cite as acceptable time off work. New hydrogel-assisted RF microneedling further minimizes epidermal trauma and boosts post-inflammatory hyperpigmentation safety in Fitzpatrick IV–VI patients, broadening addressable demographics. Combination treatment plans that sequence fractional lasers, neuromodulators, and collagen stimulators dominate clinic marketing, reflecting patient appetite for comprehensive “yearly refresh” packages.
Body contouring and cellulite reduction represent the fastest-growing application, projected at an 11.08% CAGR to 2031. Australians emerged from pandemic lockdowns with renewed fitness goals, and social-media influencers promote non-surgical sculpting as the finishing step in diet and exercise regimens. Cryolipolysis and RF-based lipolysis now account for nearly one-quarter of device-financed revenue at major franchise chains, eclipsing hair-removal income for the first time in 2025. Vendors differentiate through treatment-cycle times: next-generation cryo-applicators achieve a 25-minute fat-freezing cycle versus the legacy 45-minute standard, allowing clinics to serve more patients in a single shift. Software-enabled applicator tracking logs cycle histories directly into electronic health records, reducing manual data entry and aiding compliance audits.
By End User: Aesthetic Clinics Accelerate Growth
Hospitals captured 41.55% of procedures in 2025, leveraging surgical theaters and anesthesia support for complex cases like autologous fat transfer that require sterile fields. Yet budget pressures keep capital-equipment acquisition slow; public institutions often operate five-year-old lasers well into extended warranty periods. To bridge technology gaps, private hospital groups sign joint-venture agreements with device makers that supply newer platforms in exchange for revenue-share arrangements, effectively transferring cap-ex risk while securing predictable utilization.
Dedicated aesthetic clinics are expanding at a 13.02% CAGR through 2031, moving the revenue center of gravity away from hospitals. These clinics invest heavily in patient-experience design; concierge apps, short-stay recovery pods, and biometric check-in kiosks differentiate them from hospital outpatient wings. Franchising accelerates regional penetration, yet recent franchisee-operator disputes underscore the need for stronger training and centralized compliance support. Equipment lenders, aware of franchise volatility, now require parent-company performance guarantees before approving multi-unit leases, slightly raising borrowing costs. Home-based devices form an emerging micro-segment: consumer-grade LED masks and RF wands sell briskly during e-commerce flash sales, though TGA-mandated safety labeling curbs over-promising of clinical outcomes.

Geography Analysis
Metropolitan hubs Sydney, Melbourne, and Brisbane account for a significant share of national procedure volumes, benefiting from dense populations of millennials and well-established private-hospital networks. Clinics in Sydney’s Double Bay and Melbourne’s Toorak suburbs routinely charge 20% price premiums yet maintain four-week waiting lists, indicating that demand still outruns supply in top-tier zip codes. International patients primarily enter through Sydney and the Gold Coast, drawn by direct flights from Auckland and Singapore that support weekend-length treatment itineraries. These inbound volumes boost the Australia aesthetic devices market by adding high-margin package sales that combine energy-based facials with premium injectables.
Regional expansion remains the next frontier. Tier-2 cities such as Newcastle, Geelong, and Townsville offer commercial rents up to 45% lower than central business districts, enabling franchise clinics to break even at lower daily volumes. However, a shortage of certified cosmetic nurses limits how quickly chains can scale; the Medical Technology Association of Australia notes that 64% of companies struggle to recruit qualified staff outside capitals. Tele-mentoring programs, where metropolitan dermatologists supervise rural treatments via secure video links, partially mitigate talent shortfalls while satisfying mandatory oversight requirements. State governments also offer relocation grants to healthcare professionals willing to practice in designated regional growth corridors, indirectly supporting device sales in these markets.
Within the broader Asia-Pacific context, Australia positions itself as a safety-first premium destination rather than competing on price with Thailand or Malaysia. TGA recognition of FDA and EU approvals ensures rapid import of next-generation systems, but the same regulatory rigor imposes higher post-market surveillance costs on manufacturers, leading some mid-tier Korean vendors to delay entry. Currency fluctuations add another layer: a sustained 5% depreciation in the Australian dollar makes elective procedures effectively cheaper for foreign patients paying in Singapore dollars, while simultaneously inflating device-purchase costs for domestic clinics. Supply-chain resilience remains strong; most distributors hold at least six months of critical spare parts in country, a lesson learned from pandemic-era freight disruptions that briefly grounded laser service operations.
Regulatory Landscape
Aesthetic devices supplied in Australia fall under the Therapeutic Goods Administration (TGA) framework, administered through the Therapeutic Goods Act 1989 and the Therapeutic Goods (Medical Devices) Regulations 2002. In practice, most clinic-deployed aesthetic platforms (including lasers, RF, and ultrasound systems) need to be included in the Australian Register of Therapeutic Goods (ARTG) before supply unless an exemption applies. Classification is determined on a risk basis tied to intended purpose, supported by conformity assessment and the Essential Principles that set safety and performance expectations.
Recent regulatory updates also affect sponsor and distributor obligations. The TGA introduced pathways that draw on overseas evidence in specific cases, including changes effective 19 October 2024 that use Medical Device Single Audit Program (MDSAP) certification for certain devices. Audit targeting was narrowed from 15 June 2024, with mandatory application audits focused on higher-risk devices and IVDs. Traceability requirements are expanding as well, with the Australian UDI Database regulations commencing in March 2025 and mandatory Unique Device Identification (UDI) requirements applying to specified medical devices from 24 June 2026, which adds new data, labeling, and record-keeping steps that suppliers must implement alongside post-market surveillance and adverse event reporting.
Competitive Landscape
The 2024 merger of Cynosure and Lutronic created a multi-modality powerhouse spanning laser, RF, and ultrasound portfolios, unlocking cross-selling opportunities through an expanded combined salesforce. Scale advantages show up in R&D intensity: the merged entity allocates close to 14% of revenue to product development, double the industry average. Competitors respond by targeting niche indications acne scar revision, vascular malformations, and post-parturition striae to avoid head-to-head battles on flagship platforms.
Local distributors add competitive complexity. Many smaller European and Korean brands rely on exclusive agencies that provide technician training and rapid-response field service, helping them win share in price-sensitive segments of the Australia aesthetic devices market. Yet the rising cost of compliance including mandatory adverse-event reporting in under 48 hours strained resources for micro-scale importers. Some have exited the market, creating acquisition targets for larger players that want immediate TGA-listed product lines without lengthy approval cycles.
Strategic alliances with clinic chains are another battleground. Device makers now embed revenue-share clauses in lease contracts, aligning vendor earnings with clinic throughput and lowering upfront costs for operators. Venus Concept used this model when introducing its Bliss MAX system and secured TGA clearance in November 2024, underscoring the importance of local regulatory acumen. Meanwhile, pharmaceutical heavyweights such as AbbVie leverage their injectable franchises to negotiate bundled supply deals that include capital equipment, exploiting synergies between consumables and devices to lock in multi-year purchasing commitments.
Australia Aesthetic Devices Industry Leaders
Bausch Health Companies Inc. (Solta Medical, Inc.)
Lumenis Ltd.
Cutera Inc.
Candela Medical
Alma Lasers (Sisram Medical Ltd.)
- *Disclaimer: Major Players sorted in no particular order

Market Opportunities and Future Outlook
Australian clinic operators are expanding their treatment menus, creating headroom for multi-application energy platforms and service models that lower the cost and operational friction of adding new indications. Energy-based systems maintain a strong position, supported by their installed base and ongoing protocol development that enables combination pathways across resurfacing, tightening, and vascular indications.
Compliance is also becoming a more concrete commercial lever. The TGA designated aesthetic and cosmetic medicine goods as a priority focus area in its Compliance Principles for 2026-27, and the UDI rollout becomes mandatory for specified devices from 24 June 2026. This improves the value of suppliers that can support sponsors and clinics on labeling, traceability, and software update governance. AI-enabled software continues to sit within the same risk-based framework as other medical devices, supporting demand for integrated hardware and software solutions aligned to Essential Principles. With vendors holding 57.12% of market revenue in 2025, supplier-led platform expansion remains a visible feature of the market.
Recent Industry Developments
- March 2026: Lumenis Aesthetics Australia & New Zealand launched the StellarM22 platform with XPL technology in Australia. The rollout expands the available energy-based platform options for aesthetic clinics and is supported by new protocols and training resources for adoption.
- January 2026: Lumenis BE ANZ Pty Ltd launched the FoLix system in Australia, positioned as an FDA-cleared fractional non-ablative laser for hair loss. The addition of a dedicated hair-loss laser expands the addressable treatment mix for aesthetic clinics and supports an adjacent device-driven pathway to capture recurring patient visits beyond core skin and body indications.
- November 2024: Venus Concept received TGA clearance to market the Venus Bliss MAX system in Australia. The clearance broadened the company's addressable footprint in non-surgical body contouring and tightening, and it increased competitive pressure on incumbent energy-based vendors.


Research Methodology Framework and Report Scope
Market Definition and Coverage
For this report, the Australia aesthetic devices market covers medical devices used to perform cosmetic and appearance-focused procedures in Australia across clinical and at-home care settings, measured as revenue generated from device sales in the country.
Scope exclusions: We exclude pharmaceuticals and injectable drugs, pure skincare topical products, and procedure service fees charged by clinics unless they are bundled into device revenue.
Segmentation Overview
- By Type of Device
- Energy-based Aesthetic Device
- Laser-based Aesthetic Device
- Radiofrequency-based Aesthetic Device
- Light-based Aesthetic Device
- Ultrasound Aesthetic Device
- Other Energy-based Aesthetic Devices
- Non-energy-based Aesthetic Device
- Botulinum Toxin
- Dermal Fillers & Threads
- Microdermabrasion
- Implants
- Other Non-energy-based Aesthetic Devices
- Energy-based Aesthetic Device
- By Application
- Skin Resurfacing & Tightening
- Body Contouring & Cellulite Reduction
- Facial Aesthetic Procedures
- Hair Removal
- Breast Augmentation
- Other Applications
- By End User
- Hospitals
- Aesthetic Clinics
- Home Care Settings
Data Sources, Market Sizing, and Validation
Desk Research
Desk research is used to build the starting market structure and to anchor hard-to-move inputs that affect demand and pricing. We mainly rely on public healthcare statistics and procedure trend indicators, then use trade and regulatory signals to understand what device types are entering and being adopted in Australia.
Common sources include Australian Government health publications, the Therapeutic Goods Administration (TGA) device listings and safety notices, the Australian Bureau of Statistics (ABS) for population and income indicators, and OECD health data for comparable context. We also review peer-reviewed dermatology and plastic surgery journals for procedure mix and adoption patterns, along with association websites and reputable press that show clinic expansion and technology shifts. For company-level context, we use annual reports, investor presentations, and a paid subscription focused on company financials and news to cross-check revenue direction and ASP narratives. These examples are not exhaustive, and other public sources were reviewed to collect, validate, and clarify inputs.
Primary Interviews and Surveys
Primary interviews and surveys are used to pressure-test desk assumptions with people who make real purchasing and utilization decisions, including distributors, importers, clinic owners, hospital procurement teams, and service partners supporting installation and maintenance. Since this is a single-country market, we intentionally cover major metro demand pockets and secondary cities so the model is not driven only by premium clinic networks.
In interviews, we focus on the device replacement cycle, utilization rates by procedure type, typical discounting, and how bundled consumables or service contracts affect realized pricing. This input helps us tighten the final market value by device class.
Distribution of primary research fieldwork respondents
| Company type | Respondent position |
|---|---|
| Top tier: 31% | CXOs: 13% |
| Mid tier: 52% | Functional/Unit leaders: 30% |
| Smaller Players: 17% | Managers: 57% |
Market-Sizing & Forecasting
Sizing starts with a top-down build that reconstructs the addressable demand pool from procedure-linked adoption and installed base signals (for example, how many sites offer hair removal or skin tightening, and what throughput levels look normal). These demand-side totals are then converted into value using price bands by device class, with ASPs adjusted for common discounting and mix shifts observed in the Australia market.
To keep totals realistic, we corroborate outputs with selective bottom-up approximations, such as sampling supplier and distributor revenue ranges, checking channel markups, and using unit shipments times observed ASP for a few high-volume categories. When visibility is limited for smaller clinic purchases, we apply conservative penetration ranges that were validated in calls, then stress-test the impact against known import intensity and service activity.
For forecasting, we use scenario analysis supported by short ARIMA checks on the core input series, and we guide the final path using expert consensus on variables such as procedure volume growth, clinic opening rates, replacement cycles, technology refresh pace in energy-based platforms, and expected ASP movement by category as competition and financing offers evolve.
Data Validation & Update Cycle
Outputs are validated through triangulation across independent signals, and the first pass is followed by variance checks at the category level so a single assumption cannot silently move the total. If a value looks off, we re-check inputs such as ASP bands, discount rates, and installed base turnover, and then re-contact selected respondents when the mismatch remains material.
Before sign-off, the model is reviewed in multiple analyst steps, where logic, units, and year alignment are checked again. The report is refreshed annually, and interim updates are made when major events shift pricing, regulations, or procedure demand. Right before delivery, we run a final refresh pass so the numbers reflect the latest available data and interview feedback.
Mordor Intelligence's Australia Aesthetic Devices Market Size Measured Against Other Published Estimates
Published market values for Australia aesthetic devices can look far apart because the boundary of what counts as device sale revenue is not always aligned, and currency conversion timing plus price updates can change the final USD total. Differences can also come from whether a source anchors the market to device revenue tied to procedures, or instead starts from broad healthcare spend and applies a share assumption.
In our work, the market is kept tied to device revenue with ASP logic refreshed when discounting and product mix move. Currency timing is aligned to the base year used for the model before the figure is finalized, which is one reason the number can differ versus other pages, including Mordor Intelligence.
Benchmark comparison
| Source | Market Size | Gaps in Research Methodology |
|---|---|---|
| Mordor Intelligence | USD 262.24 M (2026) | |
| Industry Publisher A | USD 770.00 M (2024) | Uses an earlier base year and appears to apply broader category coverage or higher ASP assumptions, which can inflate value when device types and related aesthetics spending are blended. |
| Insights Portal B | USD 704.38 M (2024) | Tracks the wider medical aesthetics space and is not limited to device revenue, so procedure and treatment value can be captured alongside device sales, pushing the total higher. |
The spread in the table mainly comes from scope and year alignment, where device-only revenue in Australia produces a smaller total than estimates that bundle procedures or adjacent aesthetics categories. By keeping the calculation traceable to procedure-linked demand signals, realistic ASP bands, and clear currency timing, the resulting market size stays easier to reconcile and repeat when assumptions are updated.


Key Questions Answered in the Report
How large is the Australia aesthetic devices market in 2026?
It is valued at USD 262.24 million, with a projected rise to USD 419.18 million by 2031 at a 9.83% CAGR.
Which device category leads sales?
Energy-based platforms hold 57.12% of 2025 revenue, supported by their versatility across multiple indications.
What application segment is expanding the fastest?
Body contouring and cellulite reduction are growing at an 11.08% CAGR through 2031.
How are regulations affecting clinics?
Stricter oversight of injectables and mandatory physician supervision are raising compliance costs yet favor well-resourced providers.
What is driving medical tourism to Australia?
A combination of rigorous safety standards, English-language care, and competitive pricing when the Australian dollar is weak.
Page last updated on:





