Augmented Shopping Market Size and Share
Market Overview
| Study Period | 2020 - 2031 |
|---|---|
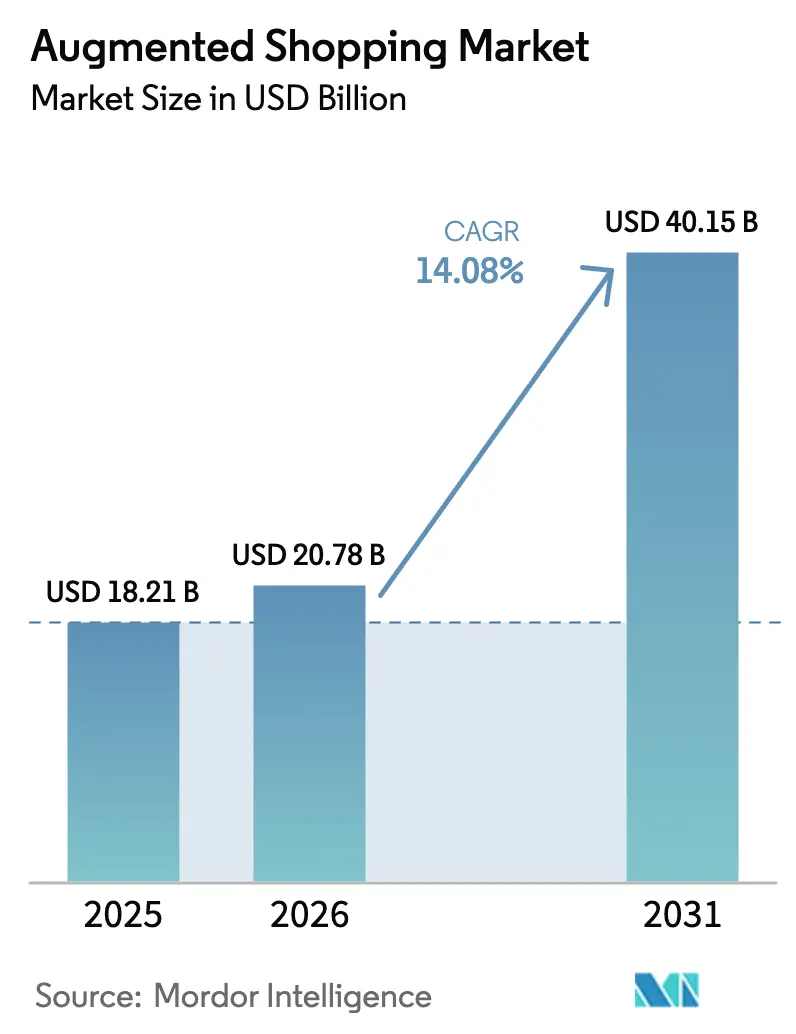
| Market Size (2026) | USD 20.78 Billion |
| Market Size (2031) | USD 40.15 Billion |
| Growth Rate (2026 - 2031) | 14.08% CAGR |
| Fastest Growing Market | Asia Pacific |
| Largest Market | North America |
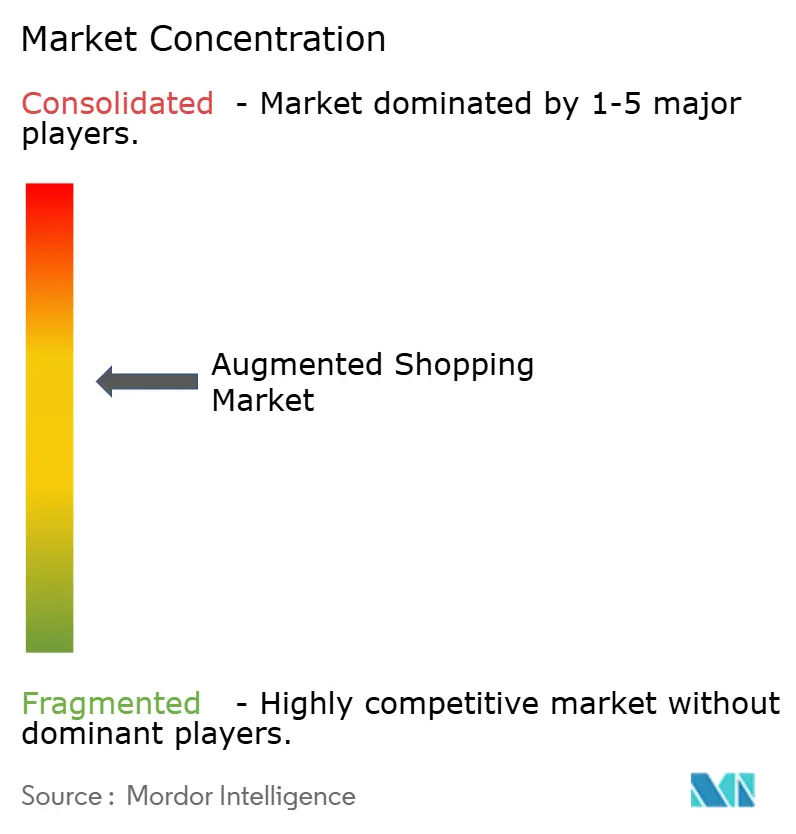
| Market Concentration | Medium |
Major Players *Disclaimer: Major Players sorted in no particular order Image © Mordor Intelligence. Reuse requires attribution under CC BY 4.0. | |
Augmented Shopping Market Analysis by Mordor Intelligence
The augmented shopping market size was valued at USD 18.21 billion in 2025 and estimated to grow from USD 20.78 billion in 2026 to reach USD 40.15 billion by 2031, at a CAGR of 14.08% during the forecast period (2026-2031). Growth is propelled by rapid smartphone AR-kit adoption, falling 3-D content-creation costs, and maturing computer-vision engines that narrow the sensory gap between online browsing and in-store trial. Retailers increasingly treat immersive commerce as core infrastructure rather than experimental add-ons, a shift reinforced by Generation Z’s preference for product exploration that blends physical context with digital personalization. Hardware investments in smart mirrors, depth sensors, and edge servers continue, yet service-led spending accelerates as brands look outward for 3-D modeling, integration, and analytics expertise. North America benefits from widespread 5 G coverage and early enterprise pilots, while Asia-Pacific delivers the steepest trajectory on the back of mobile-first social-commerce ecosystems and state support for XR research. Competitive intensity rises as Amazon, Walmart, IKEA, Shopify, and Sephora scale proprietary platforms, creating network-effect advantages that enlarge the augmented shopping market while raising entry barriers for smaller peers.
Key Report Takeaways
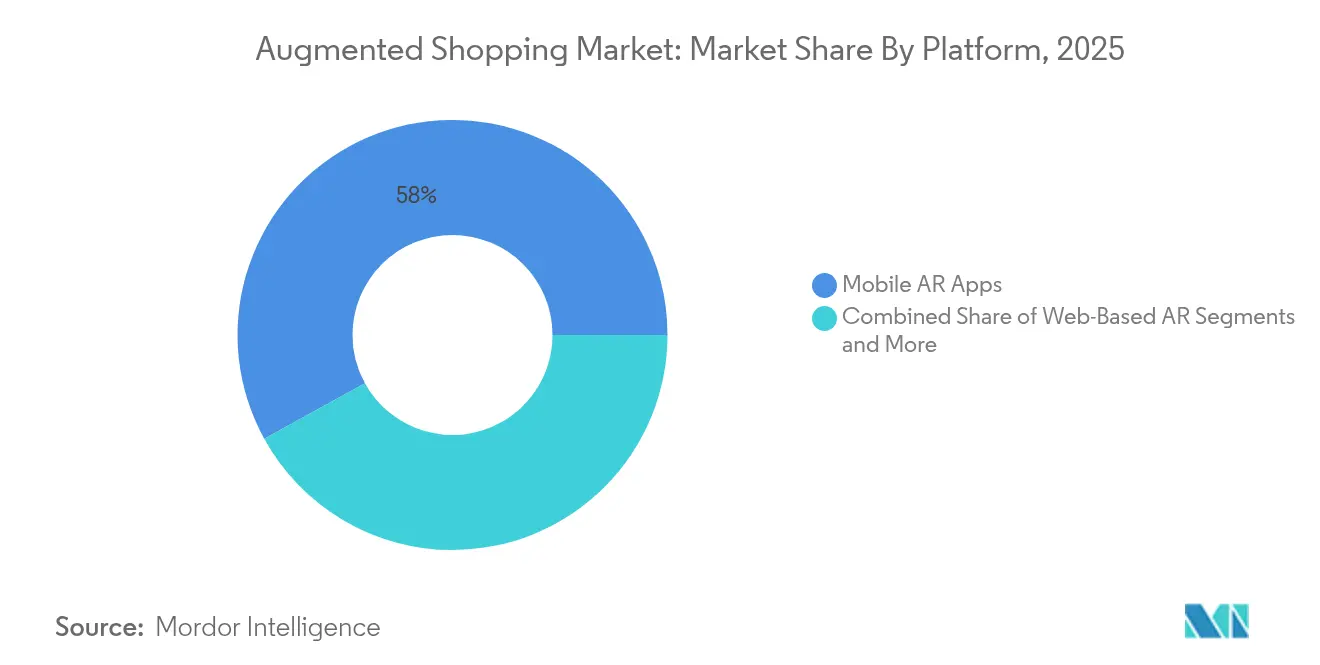
- By platform, mobile AR apps held 58.02% revenue share in 2025; AR glasses and headsets are projected to expand at a 21.35% CAGR through 2031 in the augmented shopping market.
- By offering, hardware accounted for 45.12% of the augmented shopping market share in 2025, while services are forecast to grow at 17.55% CAGR to 2031.
- By end-user industry, fashion and apparel dominated with 36.12% revenue in 2025; furniture and home décor are expected to post a 22.75% CAGR between 2026-2031 in the augmented shopping market.
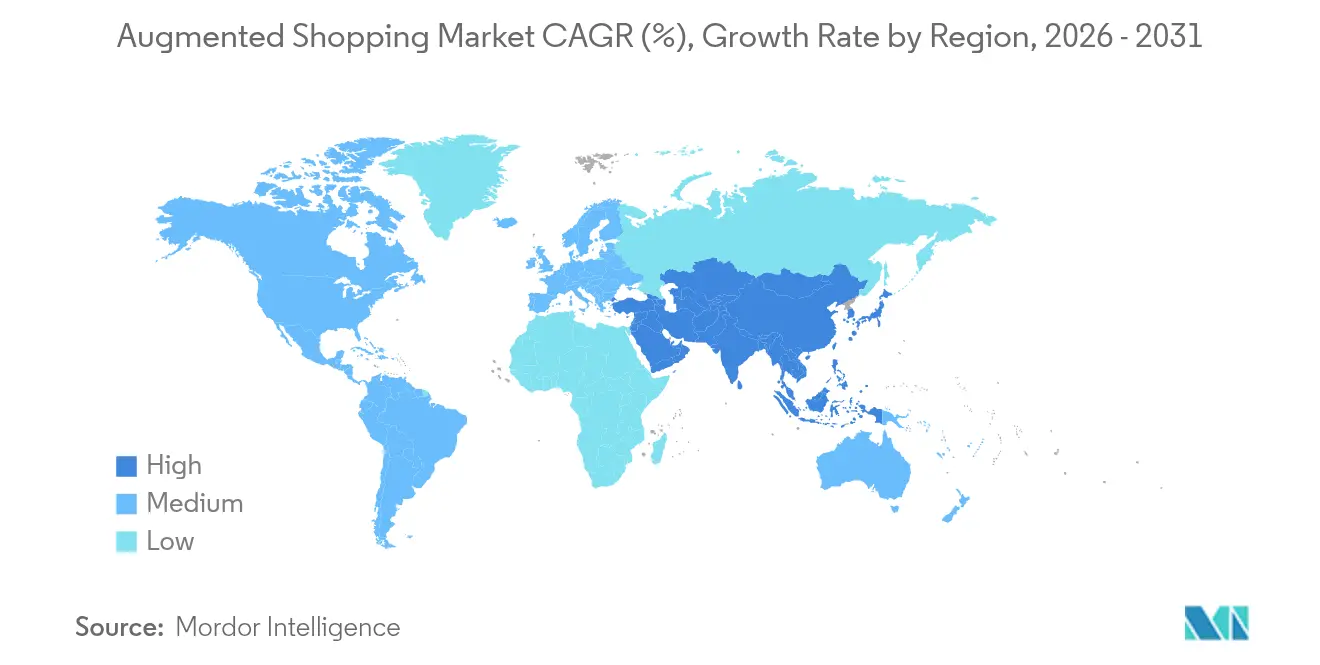
- By geography, North America led with 30.35% revenue in 2025, whereas Asia-Pacific is set to rise at a 21.4% CAGR during the forecast window in the augmented shopping market.
- Amazon, Walmart, IKEA, Shopify, and Sephora scale proprietary platforms, creating network-effect advantages that enlarge the augmented shopping market.
Note: Market size and forecast figures in this report are generated using Mordor Intelligence’s proprietary estimation framework, updated with the latest available data and insights as of 2026.
Global Augmented Shopping Market Trends and Insights
Drivers Impact Analysis*
| Driver | (~) % Impact on CAGR Forecast | Geographic Relevance | Impact Timeline |
|---|---|---|---|
| Smartphone AR-Kit and AR-Core Penetration | +3.2% | Global, with stronger impact in APAC and North America | Medium term (2-4 years) |
| Gen-Z Demand for Immersive Retail | +2.8% | Global, concentrated in urban markets | Short term (≤ 2 years) |
| Declining 3-D Content-Creation Costs | +2.1% | North America and EU, expanding to APAC | Medium term (2-4 years) |
| Social-Commerce Platform Integration | +1.9% | Global, led by APAC social media adoption | Short term (≤ 2 years) |
| Size-and-Fit Computer-Vision Engines | +1.7% | North America and EU, with APAC adoption | Medium term (2-4 years) |
| 5G and Edge Rendering Performance | +1.5% | North America, EU, select APAC markets | Long term (≥ 4 years) |
| Source: Mordor Intelligence | |||
Smartphone AR-kit and AR-core Penetration
Native AR frameworks embedded in iOS and Android have lowered technical hurdles for retailers, allowing a single mobile app build to reach millions of ready-enabled devices [1]Source: Apple Inc., “Augmented Reality,” apple.com. Real-time occlusion handling, depth estimation, and physics-based lighting raise rendering fidelity, helping merchants lift online conversion rates. Retailers report sharply reduced onboarding friction because users need no extra hardware. Edge-rendering support delivered over expanding 5 G networks further trims latency, reinforcing in-store and at-home product visualization use cases.
Gen-Z Demand for Immersive Retail
Consumers aged 11-26 display limited tolerance for static catalog images and rely heavily on social validation before purchase. Usage data from merchant analytics indicates that Gen Z interacts with AR try-ons at double the frequency of older cohorts, and conversion probability rises when virtual items can be shared to social feeds. Brand experiments with avatar-based outfit builders show basket-size uplift when personalization aligns with peer feedback loops. Retailers translate these insights into quick-deploy content packs featuring seasonal drops, keeping engagement high and stock-turn responsive.
Declining 3-D Content-Creation Costs
Automated scanning rigs, photogrammetry software, and glTF compression standards have cut model-production times by more than half. Mid-market brands once constrained by six-figure CGI budgets now outsource end-to-end pipelines on monthly retainers. Cloud-based render farms eliminate the need for local GPUs, letting smaller teams push high-fidelity assets directly to app catalogs. Lower unit costs encourage full-assortment coverage rather than flagship-only roll-outs, broadening consumer exposure to AR-enabled SKUs.
Social-Commerce Platform Integration
Instagram, TikTok, and Snapchat embed product trial directly into shoppable posts, collapsing discovery, trial, and checkout into a single flow. Retailers benefit from user-generated videos that implicitly endorse fit and style, amplifying reach at marginal media spend. API hooks feed SKU metadata into filter libraries, ensuring pricing and inventory stay synchronized. Cross-border merchants leverage these same flows to unlock market entry without building standalone sites, accelerating the augmented shopping market across emerging economies.
Restraints Impact Analysis*
| Restraint | (~) % Impact on CAGR Forecast | Geographic Relevance | Impact Timeline |
|---|---|---|---|
| Limited FoV and Ergonomics of AR Glasses | -1.8% | Global, more pronounced in enterprise segments | Long term (≥ 4 years) |
| Brand-Side Content-Scale Challenges | -1.5% | North America and EU, expanding globally | Medium term (2-4 years) |
| Data-Privacy Concerns in AR Analytics | -1.2% | EU (GDPR), expanding to global markets | Short term (≤ 2 years) |
| Fragmented AR Standards and Integration | -0.9% | Global, with regional variation in adoption | Medium term (2-4 years) |
| Source: Mordor Intelligence | |||
Limited FoV and Ergonomics of AR Glasses
Most consumer headsets still restrict field-of-view to sub-50-degree angles, creating letter-box visuals that break immersion during long shopping sessions. Battery modules add front-loaded weight, and recharge cycles disrupt continuous in-store use. Retail chains piloting shared devices must also address post-pandemic sanitization protocols, which add time and staff cost. Component miniaturization R&D continues, yet mass-market price points remain several product generations away.
Data-Privacy Concerns in AR Analytics
Immersive apps gather spatial meshes, biometric cues, and gaze data, all of which fall under sensitive-data clauses in GDPR [2]Source: Deloitte, “Extended Reality and GDPR,” deloitte.com. Retailers face tougher consent requirements because users seldom grasp how depth maps reveal room layouts or body dimensions. Regional watchdogs demand clear opt-in prompts and data-minimization measures, adding compliance overhead that delays launch. Brands counter by processing on-device where feasible and by offering transparent deletion controls to reassure shoppers.
*Our forecasts treat driver/restraint impacts as directional, not additive. The impact forecasts reflect baseline growth, mix effects, and variable interactions.
Segment Analysis
By Platform: Mobile Apps Remain Core While Glasses Accelerate
Mobile AR apps represented 58.02% of 2025 revenue, cementing their role as the default entry point for the augmented shopping market. Retailers embed 3-D visualization, size-and-fit guides, and spatial placement tools directly inside existing iOS and Android storefronts, sparing customers from learning new interfaces. Application performance draws strength from metal-level APIs and neural processors now standard in flagship phones, making frame drops rare even during network fluctuations. Web-based AR widens reach because a tap-to-view link in a product listing can launch camera-based previews inside the browser, bypassing downloads that historically suppressed engagement. In-store smart mirrors add dynamic call-to-action overlays, and chain operators report dwell-time gains once shoppers see garments on personalized avatars.
AR glasses and headsets, though only a modest slice of 2025 sales, compound at 21.35% CAGR to 2031 as visual-engine improvements and supply-chain scaling cut retail price points. Next-generation waveguides promise lighter casings and less eye strain, enabling hands-free comparison between physical rack items and color variants available online. Enterprise use cases—staff stock-picking, guided assembly, and concierge styling—drive early orders, underpinning volume ramp ahead of mainstream adoption. Integration APIs now translate session telemetry into inventory management dashboards, aligning the augmented shopping market with broader omnichannel metrics. Content publishers respond by optimizing poly counts and shader libraries to suit optic pipelines, ensuring that product finishes such as fabric sheen or metallic sparkle display accurately across both handheld and head-worn devices.


By Offering: Hardware Dominates but Services Scale Rapidly
Hardware claimed 45.12% revenue in 2025, anchored by display panels, depth cameras, sensor hubs, and edge-compute gateways that power tactile retail activations. Retailers with large store networks allocate capex to digital fitting rooms, interactive walls, and kiosk stations that converge product discovery and checkout. Processor vendors release system-on-chip designs that offload neural processing, enabling smooth occlusion handling without dedicated GPUs. Retailers measure ROI not only in traffic lift but also in reduced return rates because shoppers preview fit and shade before purchase, improving profitability across high-return categories such as apparel and cosmetics.
Services expand at a 17.55% CAGR, helped by the realization that immersive commerce is a continuous content lifecycle, not a one-time installation. Agencies offer subscription bundles combining point-cloud scanning, photorealistic PBR material capture, CMS hosting, and behavioral analytics tied into CRM. Small and mid-sized chains—traditionally locked out by six-digit capex—now outsource entire pipelines, paying on a per-SKU basis. Software platforms complement the stack with drag-and-drop editors, SDKs, and A/B testing tools, but service partners remain pivotal because brand teams often lack internal CGI or spatial UX talent. The augmented shopping market thus balances tangible hardware assets with knowledge-driven service revenues, a duality projected to persist across the forecast horizon.

By End-User Industry: Fashion Leads; Furniture Outpaces
Fashion and apparel controlled 36.12% of 2025 turnover, relying on AR to close the tactile gap that long hampered e-commerce adoption. Virtual try-on mirrors let shoppers evaluate drape, color, and styling combinations, while computer-vision fit engines adjust garment rendering to an individual’s body measurements. Beauty sub-segments deploy AR lenses that map lipstick shades or eyebrow contours with pixel-level accuracy, driving conversion lifts and cross-selling of complementary items. Return rates on apparel orders drop when customers preview fit, improving margins at scale and reinforcing leadership within the augmented shopping market. Brand collaborations with entertainment franchises convert limited-edition drops into immersive lookbooks, increasing share-of-voice among Gen Z cohorts that reward novelty and authenticity.
Furniture and home décor posts a 22.75% CAGR to 2031 as spatial visualization solves a critical purchase barrier: uncertainty about size and style in existing rooms. IKEA Place popularized “true-scale” placement, and subsequent iterations now anchor virtual pieces with millimeter-grade dimensional accuracy . Home-improvement retailers integrate lighting estimation so materials appear consistent with actual room conditions, and multi-item scenes allow whole-room redesigns rather than single-item previews. Ticket sizes in furniture exceed mass-fashion baskets, so incremental conversion uplifts translate into significant absolute revenue. The augmented shopping market size for this segment grows further as manufacturers preload configurable options—fabric swatches, leg styles, modular add-ons—into in-app editors, shortening lead times on custom orders.
Geography Analysis
North America held 30.35% of 2025 revenue, reflecting early enterprise pilots, dense 5 G roll-outs, and an innovation ecosystem anchored by platform providers such as Apple, Google, and Microsoft. Retailers exploit suburban and urban store footprints as live testbeds, measuring uplift across click-and-collect, returns counters, and mobile re-engagement channels. Cloud region expansion across the United States and Canada ensures low-latency streaming for AR assets, mitigating the “loading lag” that previously undercut customer patience. Data-privacy frameworks remain relatively business-friendly compared with the EU, letting brands experiment with gaze-tracking analytics so long as disclosures remain transparent.
Asia-Pacific records the fastest 21.4% CAGR through 2031, buoyed by mobile-first commerce norms and an embedded social-commerce culture that makes AR filters part of daily messaging. Chinese tech majors fold try-on features into super-apps, turning routine social engagement into real-time conversion funnels. Governments in Japan, South Korea, and Singapore allocate R&D grants and tax incentives to XR startups, accelerating optical component manufacturing scales that ripple through regional supply chains. Cross-border e-commerce corridors connect Southeast Asian shoppers to Chinese merchants, and integrated logistics hubs shorten delivery windows so virtual promise meets physical fulfillment.
Europe demonstrates steady uptake, aided by high broadband penetration and a consumer mindset attuned to sustainability. AR helps reduce carbon footprints by lowering return frequencies, a narrative that resonates with EU shoppers. GDPR compliance imposes additional engineering around data minimization, yet adherence builds trust, evidenced by higher opt-in rates once consent dialogs detail benefits. Pan-continental fashion houses adopt virtual showrooms that sync with live-stream catwalks, letting remote audiences purchase looks in situ. Emerging Middle East and Africa markets leverage mixed-use malls as experiential anchors, with tourism-driven foot traffic sampling AR gamefied treasure hunts that convert to merchandise purchases.

Competitive Landscape
The augmented shopping market shows moderate fragmentation, with the top five retailers and platform providers capturing a sizeable yet non-dominant share. Amazon’s USD 10 billion investment in new data-center clusters strengthens its AWS backbone for real-time rendering workloads, letting marketplace sellers embed 3-D assets without latency penalties. Walmart deploys adaptive retail pipelines that fuse AR and generative AI styling suggestions, working toward hyper-personalized aisles that update digitally as inventory rotates. IKEA integrates room-design algorithms into its flagship app, positioning mobile at the center of its omnichannel renewal and tightening feedback loops between digital inspiration and flat-pack pickup.
Shopify arms independent merchants with turnkey AR product-page widgets and automated USDZ/glTF converters, democratizing immersive commerce for brands with limited technical bandwidth. Sephora pushes innovation inside stores through smart mirrors that recommend color combinations based on complexion mapping, helping the chain sustain premium margins in a crowded cosmetics arena. Meanwhile, Apple, Google, and Meta court retailers via SDK extensions that plug into their spatial-computing roadmaps, effectively turning platform upgrades into retail capability launches.
Start-ups serving niche verticals—such as footwear sizing or luxury watch customization—seek differentiation through specialized computer-vision IP. However, scale requires data volume and retail relationships that incumbents often control. As a result, many newcomers pivot toward B2B service layers or accept acquisition offers that fold their features into platform provider roadmaps. The competitive narrative thus tilts toward vertical integration and ecosystem lock-in, with open standards bodies racing to keep interoperability alive inside an augmented shopping market moving quickly toward maturity.
Augmented Shopping Industry Leaders
Amazon
Walmart
IKEA
Shopify
Sephora
- *Disclaimer: Major Players sorted in no particular order

Recent Industry Developments
- June 2025: Amazon announced a USD 10 billion investment in North Carolina data centers to expand AI infrastructure and support large-scale AR rendering for retail customers.
- May 2025: IKEA opened a flagship Oxford Street store featuring omnichannel fulfillment and in-app AR visualization zones that merge physical display with digital customization.
- February 2025: IKEA updated its mobile app with AI-powered room-design tools, letting users create lifelike layouts before purchase.
- June 2024: Walmart launched AR optical try-on features for eyewear and accessories, extending its immersive toolkit across product categories.
- January 2024: Walmart introduced the Walmart Discovered AR experience on Roblox, enabling in-game product discovery that links to real-world inventory.


Research Methodology Framework and Report Scope
Market Definitions and Key Coverage
Our study defines the augmented shopping market as all revenue generated when retailers or e-commerce platforms deploy augmented-reality software, middleware, and purpose-built hardware that lets shoppers visualize, fit, or configure products in real time before purchase. The valuation captures first-sale licenses, subscriptions, integration projects, smart mirrors, depth cameras, AR glasses, and related sensors.
We exclude pure virtual-reality storefronts, industrial maintenance AR, and developer-only SDK revenue.
Segmentation Overview
- By Platform
- Mobile AR Apps
- Web-Based AR
- Smart Mirrors and Kiosks
- AR Glasses and Headsets
- By Offering
- Hardware
- Software
- Services
- By End-User Industry
- Fashion and Apparel
- Beauty and Cosmetics
- Furniture and Home Decor
- Grocery and Convenience
- Automotive and Accessories
- Others
- By Region
- North America
- Canada
- United States
- Mexico
- South America
- Brazil
- Peru
- Chile
- Argentina
- Rest of South America
- Asia-Pacific
- India
- China
- Japan
- Australia
- South Korea
- South East Asia (Singapore, Malaysia, Thailand, Indonesia, Vietnam, and Philippines)
- Rest of Asia-Pacific
- Europe
- United Kingdom
- Germany
- France
- Spain
- Italy
- BENELUX (Belgium, Netherlands, Luxembourg)
- NORDICS (Denmark, Finland, Iceland, Norway, Sweden)
- Rest of Europe
- Middle East and Africa
- United Arab Emirates
- Saudi Arabia
- South Africa
- Nigeria
- Rest of Middle East and Africa
- North America
Detailed Research Methodology and Data Validation
Primary Research
We conducted structured interviews and short surveys with AR product managers, interactive-agency leads, and merchandising heads across North America, Europe, and key Asia-Pacific markets. Their insight on adoption rates, average project costs, and payback periods filled secondary gaps and guided assumption checks.
Desk Research
We extracted baseline inputs from open datasets such as US Census Monthly Retail Trade, Eurostat Retail Turnover, GSMA smartphone penetration reports, and patent families tagged "AR visual commerce" on Questel. Trade association bulletins from the National Retail Federation and Consumer Technology Association helped map installation counts of smart mirrors and web-based try-on modules, while company filings, 10-Ks, and investor decks revealed unit economics for leading AR platform providers.
Further, our analysts tapped D&B Hoovers for retailer revenue splits and Dow Jones Factiva for recent deployments, then cross-checked customs data from Volza to estimate hardware flows. The sources listed are illustrative; many additional public records supported data collection, validation, and clarification.
Market-Sizing & Forecasting
A top-down model starts with total retail and e-commerce sales pools, then applies AR penetration rates and average spend per deployment. Selective bottom-up roll-ups of smart-mirror shipments, web-AR subscription counts, and sampled ASP × volume pairs validate and adjust totals. Key variables include smartphone LiDAR share, browser-level WebAR adoption, apparel return rates, smart-mirror component prices, and average project budgets. Multivariate regression extends these drivers to 2030, with scenario analysis testing upside and downside demand.
Data Validation & Update Cycle
Outputs pass anomaly checks against independent indices before senior review. We refresh the model annually and issue interim updates when material events, such as major platform launches, shift core inputs.
Why Our Augmented Shopping Market Baseline Commands Reliability
Published estimates differ because studies adopt varied scopes, currencies, and refresh cadences. External reports may track software fees alone or apply static average prices that ignore rapid cost deflation. Others extrapolate unit counts from app downloads without verifying active usage, and some update only every second year.
Benchmark comparison
| Market Size | Anonymized source | Primary gap driver |
|---|---|---|
| USD 18.21 B (2025) | Mordor Intelligence | |
| USD 4.82 B (2024) | Global Consultancy A | Excludes hardware and in-store deployments |
| USD 8.03 B (2025) | Trade Journal B | Uses fixed ASPs and limited regional coverage |
| USD 3.40 B (2023) | Industry Association C | Outdated base year and no annual refresh |
The comparison shows that our broader yet clearly defined scope, timely refresh cycle, and dual-stage validation give decision-makers a balanced, transparent baseline they can trace back to concrete variables.


Key Questions Answered in the Report
What is the current value of the augmented shopping market?
The market stands at USD 20.78 billion in 2026 and is forecast to grow to USD 40.15 billion by 2031.
How fast is the augmented shopping market expected to grow?
It is projected to expand at a 14.08% CAGR over 2026-2031, driven by mobile AR adoption, falling 3-D content costs, and Gen Z engagement.
Which platform leads the augmented shopping market today?
Mobile AR apps lead, capturing 58.02% of 2025 revenue, thanks to the ubiquity of smartphone hardware and embedded AR frameworks.
Which region shows the highest growth potential?
Asia-Pacific is the fastest-growing region with a 21.4% CAGR, propelled by mobile-first consumer behavior and integrated social-commerce ecosystems.
Which end-user industry benefits most from augmented shopping?
Fashion and apparel hold the largest share at 36.12%, using virtual try-ons to solve fit and style visualization challenges, though furniture shows the fastest growth.
Page last updated on:


