United States Live Music Market Size and Share
Market Overview
| Study Period | 2020 - 2031 |
|---|---|
| Forecast Data Period | 2026 - 2031 |
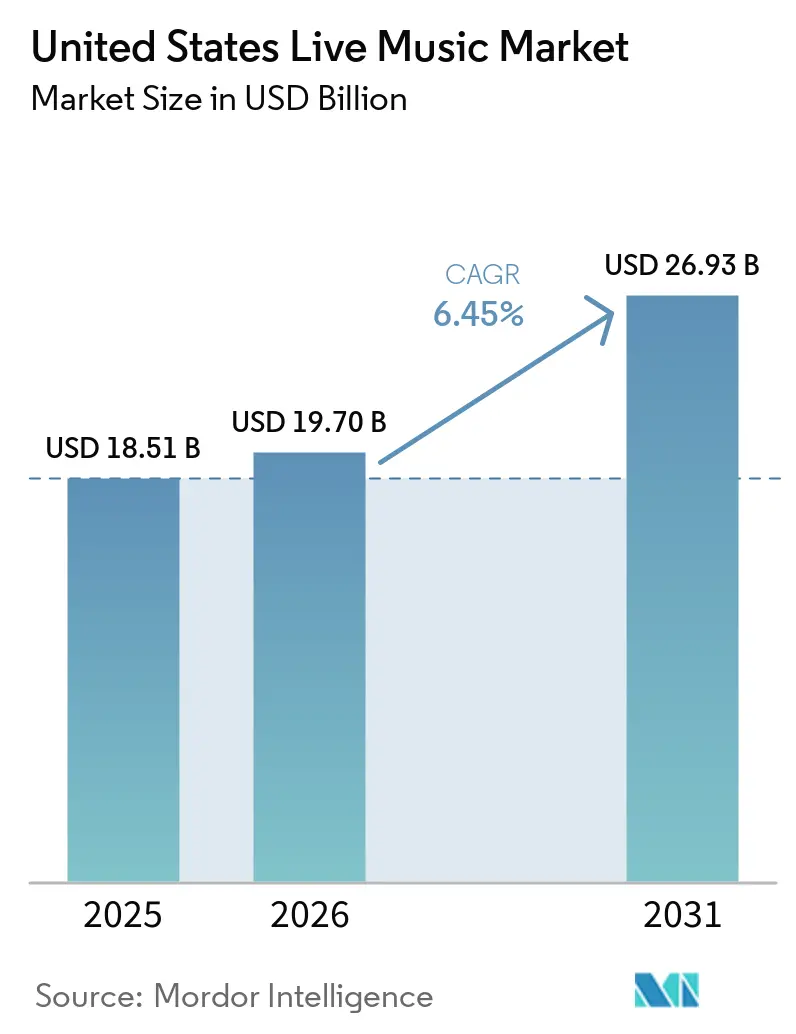
| Base Year Market Size (2025) | USD 18.51 Billion |
| Market Size (2026) | USD 19.70 Billion |
| Market Size (2031) | USD 26.93 Billion |
| Growth Rate (2026 - 2031) | 6.45% CAGR |
| Market Concentration | High |
Major Players *Disclaimer: Major Players sorted in no particular order Image © Mordor Intelligence. Reuse requires attribution under CC BY 4.0. | |
United States Live Music Market Analysis by Mordor Intelligence
The United States live music market size was valued at USD 18.51 billion in 2025 and estimated to grow from USD 19.7 billion in 2026 to reach USD 26.93 billion by 2031, at a CAGR of 6.45% during the forecast period (2026-2031). Solid pent-up demand from consumers who reprioritize shared experiences, combined with strategic venue investments and technology adoption by leading promoters, sustains this expansion path. Ticket revenues continue to anchor promoter economics even as sponsorship, merchandising and hybrid streaming channels diversify income streams and reduce exposure to pricing fatigue. Consolidation accelerates as Legends’ acquisition of ASM Global and Live Nation Entertainment’s USD 1 billion program for 18 new venues reshape facility control and enable superior negotiating leverage with artists. Regional momentum is strongest in the South, which benefits from migration trends and supportive local regulation, while the West records the fastest gains on the back of technology-sector affluence and aggressive green-field venue development. Across the forecast horizon, successful operators will balance dynamic pricing against regulatory pressure, manage climate-driven insurance costs, and embed ESG retrofits to secure new city permits all while maintaining fan trust.
Key Report Takeaways
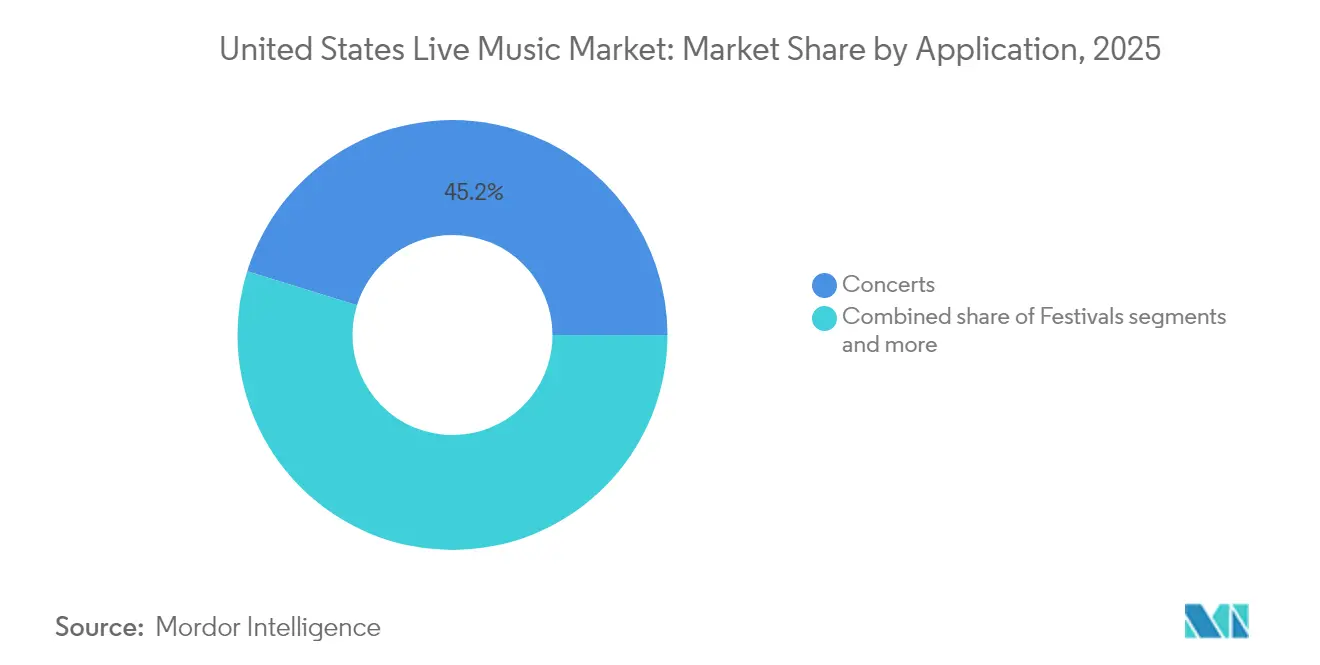
- By application, concerts led with 45.21% of the United States live music market share in 2025; festivals are projected to expand at a 9.08% CAGR through 2031.
- By revenue stream, tickets held a 71.62% share of the United States live music market size in 2025, and sponsorship is forecast to grow at a 9.95% CAGR to 2031.
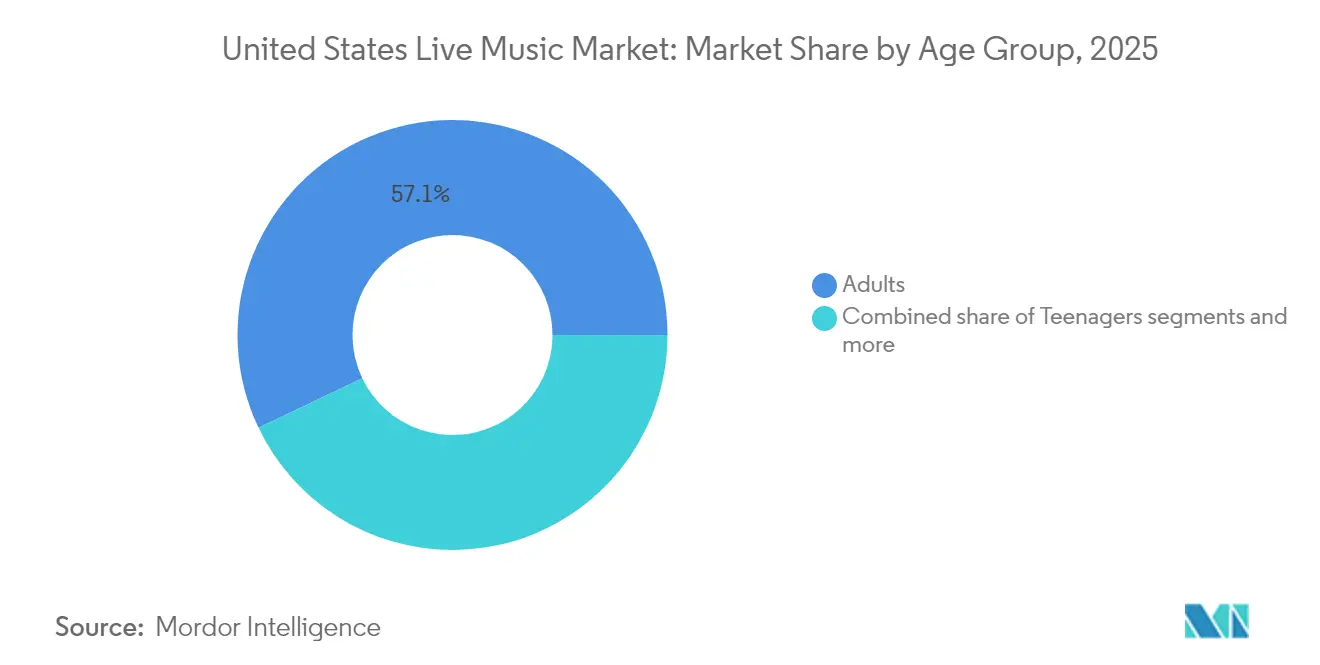
- By age group, Adults command 57.10% share of the United States live music market size in 2025, while teenagers represent the fastest-growing segment at 7.62% CAGR through 2031.
- By venue size, Medium-sized venues dominate with 48.15 of % United States live music market size in 2025, while large venues represent the fastest-growing segment at 8.55% CAGR through 2031.
- By geography, the South region commanded a 33.05% share of the United States live music market in 2025, while the West advances at a 7.22% CAGR through 2031.
Note: Market size and forecast figures in this report are generated using Mordor Intelligence’s proprietary estimation framework, updated with the latest available data and insights as of 2026.
United States Live Music Market Trends and Insights
Drivers Impact Analysis*
| Driver | (~) % Impact on CAGR Forecast | Geographic Relevance | Impact Timeline |
|---|---|---|---|
| Pent-up post-pandemic demand surge | +1.8% | National, strongest in South and West regions | Short term (≤ 2 years) |
| Rise of dynamic ticket-pricing algorithms | +1.2% | National, led by major metropolitan areas | Medium term (2-4 years) |
| Corporate sponsorship appetite for experiential marketing | +1.0% | National, concentrated in major markets | Long term (≥ 4 years) |
| Growth in hybrid/streamed add-on revenue | +0.8% | National, early adoption in West and Northeast | Medium term (2-4 years) |
| Emergence of NFT-based fan engagement models | +0.4% | National, tech-forward markets leading | Long term (≥ 4 years) |
| Venue ESG retrofits unlocking new city permits | +0.5% | West and Northeast, expanding to secondary markets | Long term (≥ 4 years) |
| Source: Mordor Intelligence | |||
Pent-Up Post-Pandemic Demand Surge
Consumer budgets keep shifting from on-demand audio streaming to in-person performances, reinforcing the United States live music market trajectory. Live Nation Entertainment served 145 million attendees in 2023 and produced USD 22.7 billion in revenue, signaling restored confidence among fans and artists alike[1]Live Nation Entertainment, “Investor Day 2025 Presentation,” investors.livenationentertainment.com. . Gen Z concertgoers alone spent over USD 2,100 during the past two years, proving a willingness to pay premium prices when experiences feel unique. Average ticket prices reached USD 144 in 2025, 45% higher than 2019 levels, giving promoters short-run pricing power even while triggering affordability debates. Demand clusters in the South and West, where new residents and expanded capacities amplify volume, creating secondary-market resale premiums that 75% of Gen Z fans accept to secure attendance. Sustaining this momentum depends on macroeconomic stability, yet the driver remains potent through at least 2026 as consumers continue to prioritize shared cultural moments.
Rise of Dynamic Ticket-Pricing Algorithms
Artificial-intelligence engines now ingest real-time variables ranging from social chatter to weather forecasts, allowing venues to adjust listed prices minute by minute[2]Ticketmaster, “Dynamic Pricing Technology,” ticketmaster.com. . Yield improvements lift average revenue per seat; however, the Oasis reunion tour controversy illustrates heightened scrutiny when perceived fairness erodes, prompting multiple states to consider transparency mandates. Major metropolitan areas adopt the model fastest due to rich data pools and consumer familiarity with variable pricing in other sectors, such as ridesharing and lodging. Secondary cities reveal slower uptake, with fans and local officials wary of volatility that undermines budgeting for leisure activities. Promoters must therefore calibrate algorithms to avoid reputational costs that may outweigh incremental margin. A balanced rollout that pairs transparent fee structures with loyalty rewards can preserve goodwill while still unlocking upside.
Corporate Sponsorship Appetite for Experiential Marketing
Coca-Cola’s multi-decade ESSENCE Festival partnership delivered USD 346.3 million in 2024 economic impact, underscoring the brand’s confidence in live music as a storytelling conduit [3]ESSENCE Festival, “2024 Economic Impact,” essence.com. . Consumer product and financial-services firms escalate spending because on-site activations generate deeper engagement than banner ads or pre-roll video, especially among younger demographics that value authenticity. Live Nation’s 100-plus-venue pact with Athletic Brewing illustrates how emerging labels secure rapid trial when embedded in the United States live music market ecosystem. Data-sharing clauses now accompany most agreements, granting sponsors insight into attendee demographics, dwell time and purchase behavior, thereby elevating return-on-investment analytics. At marquee festivals such as Lollapalooza, Dunkin’ and T-Mobile deployed immersive lounges and cashless payment incentives that pushed measurable conversions during 2024. Over the long term, experiential alignment remains a durable revenue pillar as brands seek memorable moments that translate into social amplification.
Growth in Hybrid/Streamed Add-On Revenue
Necessity forged during lockdowns has matured into a viable extension strategy for the United States live music market. Venues now broadcast concerts via high-definition streams that are sold as standalone digital passes, adding incremental reach without cannibalizing in-person attendance[4]Music Business Worldwide, “Technology Funding Round-up,” musicbusinessworldwide.com. . Platforms such as Setmixer allow turnkey capture, mixing, and post-event sales of performance footage, opening long-tail revenue for both promoters and artists. Tiered offerings, VIP chat rooms, behind-the-scenes feeds, and limited-edition digital merchandise drive average digital spend per remote viewer above USD 30 for top acts. Adoption skews toward the West Coast and Northeast, where broadband penetration and early-adopter mind-sets boost willingness to pay. Crucially, hybrid models also furnish accessibility options for fans unable to travel or secure on-sale tickets, thereby softening equity critiques levied at premium in-venue pricing. As 5G coverage expands nationally, streamed companions will shift from experiment to standard fixture.
Restraints Impact Analysis*
| Restraint | (~) % Impact on CAGR Forecast | Geographic Relevance | Impact Timeline |
|---|---|---|---|
| Ticket-price inflation backlash & regulatory scrutiny | -1.4% | National, strongest in major metropolitan areas | Short term (≤ 2 years) |
| Talent-booking cost escalation | -1.1% | National, most severe in competitive markets | Medium term (2-4 years) |
| Insurance premiums tied to climate-related event risks | -0.7% | National, highest impact in outdoor venues | Long term (≥ 4 years) |
| Local noise-ordinance tightening in secondary markets | -0.5% | Regional, concentrated in secondary markets | Medium term (2-4 years) |
| Source: Mordor Intelligence | |||
Ticket-Price Inflation Backlash & Regulatory Scrutiny
Escalating list prices combined with service fees spark consumer anger and legislative hearings, bringing new compliance costs to the United States live music market. Average face value hitting USD 144 in 2025 stretched household budgets, especially for fans under 30 despite their high willingness to attend live events. Some states now draft bills that insist promoters reveal maximum price ceilings at the start of any onsale, while others contemplate capping surge increments on dynamic platforms. Fee transparency rules could reduce ancillary revenue slices that promoters rely on, potentially shifting emphasis toward sponsorship and merchandise to protect margins. Public perception challenges mount on social platforms where screenshots of pricing spikes trend rapidly, forcing companies to invest in proactive communication. Balancing revenue optimization with equitable access becomes a critical reputational imperative over the next two years.
Talent-Booking Cost Escalation
Guarantee fees for fairground headliners doubled from USD 150,000 in 2023 to USD 300,000 in 2025, squeezing mid-tier promoter budgets. Artists leverage a consolidated buyer landscape to demand higher upfront payments plus enhanced production requirements, driving total show costs beyond ticket-driven breakeven points in smaller venues. The inflation spills into staffing, freight and insurance line items as suppliers follow artists in repricing. Metropolitan areas feel the sting first because competitive bidding intensifies for marquee weekends, yet ripple effects soon reach secondary markets, rendering some traditional tour stops economically unviable. Independent operators without cross-promotional scale risk exit or acquisition, further reinforcing concentration inside the United States live music market. Long-run solutions rest on diversified revenue sources and dynamic routing that pairs high-capacity facilities with lower-cost dates to average down expenses.
*Our forecasts treat driver/restraint impacts as directional, not additive. The impact forecasts reflect baseline growth, mix effects, and variable interactions.
Segment Analysis
By Application: Concerts Drive Market Foundation
Concerts accounted for 45.21% of the United States live music market in 2025, providing the bedrock of annual tour cycles and representing the segment most familiar to mainstream audiences. The United States live music market size for concerts gains from predictable scheduling and scalable production templates that help promoters allocate capital efficiently. Artist-to-fan intimacy occurring in theater tours coexists with stadium spectacles that sell more than 60,000 tickets per date, offering a revenue ladder across career stages. Festivals, while only 12.50 % behind concerts in 2025 share terms, post a 9.08% CAGR and thus reshape how younger patrons engage through multi-day immersions that bundle food, camping and merchandising. Corporate events and weddings, each below 10% share, nonetheless add stability by filling venue calendars during weekdays and off-peak seasons. The evolving mix obliges venue operators to invest in modular staging solutions so spaces can morph quickly between applications and maximize occupancy.
Demand heterogeneity across applications underscores the need for differentiated marketing strategies within the United States live music market. Festivals leverage social-media virality and influencer partnerships to accelerate sell-through despite price increases. Concerts tap presale partnerships with credit-card brands that guarantee partial sold inventories before public onsales, thereby improving cash-flow visibility. The theater subcategory benefits from Broadway touring companies extending runs in regional cities, lifting local attendance and spending. Corporate gathering demand climbs as hybrid work elevates the value of in-person retreats, making premium hospitality upsells viable. Weddings integrate live bands alongside DJs, supporting niche agencies specializing in bespoke entertainment curation. Collectively, cross-pollination among applications further solidifies occupancy rates and ticket yield potential.


By Revenue Stream: Sponsorship Accelerates Growth
Ticket sales supplied 71.62% of the United States live music market size in 2025, serving as the primary generator of box-office receipts. While this share underscores core dependence, the ceiling on price elasticity invites promoters to cultivate high-growth alternatives. Sponsorship revenues are expected to grow 9.95% CAGR, reflecting the C-suite's realization that experiential placements outshine banner ads in brand recall. The United States live music market share held by merchandising hovers near 7%, with average per-head spend up 14% year over year as digital point-of-sale technology speeds transaction time. VIP experiences, although blended across ticket and hospitality accounting lines, deliver outsized profitability due to minimal incremental cost once base production is set. Hybrid streaming unlocks fresh pay-per-view and on-demand libraries, with some artists pre-selling digital collectibles that gate bonus content.
Diversification trends mitigate reliance on volatile ticket yields and help counterbalance insurance inflation. Corporate sponsors, armed with first-party data access, pay premiums for segments offering opt-in consumer intel beyond basic demographics. Merchandise design now involves capsule drops exclusive to venue kiosks, creating scarcity that prompts immediate purchase rather than post-event browsing. Dynamic bundles that pair physical tickets with NFTs or limited apparel heighten average order value without visible seat-price hikes, easing consumer sticker shock. Across clubs and arenas alike, the revenue algorithm continues to evolve toward a multilayered stack that spreads risk and capitalizes on multiple fan touchpoints.
By Age Group: Teenagers Drive Future Growth
Adults retained 57.10% influence on spend in 2025 due to higher discretionary income, but teenagers represent the fastest rising cohort at 7.62% CAGR and thus sit at the center of future strategic planning. The United States live music market thrives when young fans convert streaming fandom into in-person attendance, a behavior magnified through social virality once events are documented on platforms like TikTok. Willingness among 75% of Gen Z listeners to pay resale premiums reveals price insensitivity when the perceived cultural relevance of attendance is high. Children hold an 11% share supported by family-oriented matinee programming, and seniors sit at 6% as nostalgia tours cater to high-income retirees fond of legacy acts. The main challenge remains affordability because soaring list prices may discourage repeat visits by younger patrons with limited income. Promoters respond with installment-plan ticketing, sponsored seat banks, and loyalty credits that make entry accessible while preserving headline averages.
Modifying show formats also fuels youth engagement. Festivals now include dedicated teen zones with curated activations and social-media content bays, encouraging parental purchase of multi-day passes. Brands bridge generational gaps through sponsored family pricing bundles that encourage children’s early exposure to live performance. VIP upgrades increasingly feature interactive elements such as backstage TikTok sets or micro-meet-and-greets that resonate with digital-native expectations. For seniors, improved seat ergonomics and enhanced parking access raise satisfaction and convert occasional attendance into habitual participation. By mirroring demographic preferences at every lifecycle stage, the United States live music market reinforces a pipeline that moves fans from discovery to lifetime patronage.
By Venue Size: Large Venues Capture Growth
Medium venues between 1,001 and 10,000 seats owned 48.15 of % United States live music market share in 2025, balancing intimacy and profitability. Large venues above 10,000 seats, though smaller in number, post an 8.55% CAGR as promoters pursue economies of scale and upgrade fan amenities to justify premium ticket tiers. Small venues under 1,000 seats remain crucial incubators for emerging talent, yet confront margin pressures from rising fixed costs. The venue-size continuum offers artists a stepwise growth path, permitting demand-aligned capacity without sacrificing atmosphere. Live Nation’s USD 1 billion capital plan spans arena renovations as well as ground-up amphitheaters, showing confidence in high-capacity formats that generate elevated food-and-beverage take per head. Public-private finance frameworks led by Oak View Group further accelerate large-venue stock while obliging operators to meet community ESG targets.
Shifts in production technology enable flexibility that helps medium-sized sites stay competitive. Modular stage trusses and LED backdrops accommodate arena-class visuals within mid-range footprints, boosting sell-through for acts ascending from clubs. Large venues deploy frictionless access control, mobile concessions ordering, and cashless settlement to reduce congestion and increase dwell time. Small clubs counter by emphasizing storytelling intimacy, limited-edition merchandise, and souvenir photography packages to upsell. Insurance cost differentials also factor; enclosed arenas hedge against weather risk that plagues outdoor amphitheaters, influencing routing decisions for high-stakes tours. Each tier aligns with unique economics, but shared adoption of data-driven operational systems lifts overall asset productivity.
Geography Analysis
The United States live music market activity concentrates first in the South, where a 33.05% share reflects favorable migration trends, lower costs, and receptive municipal authorities. Robust population inflows fuel ticket demand and justify Live Nation and others pouring capital into new amphitheaters, while lenient zoning expedites construction timelines. South-based events also benefit from temperate weather that extends outdoor season length; however, insurers hike premiums after hurricanes disrupted multiple 2024 shows, forcing contingency budgeting that may nudge some festivals indoors. The region’s cultural heritage across the country, hip-hop, and Latin genres nurtures diverse calendars that broaden sponsorship appeal. Rising noise-control ordinances in secondary Southern cities introduce scheduling constraints, yet promoters often negotiate offset agreements such as earlier curfews paired with heightened sound insulation. Overall, the South positions itself as a volume leader, though operators must navigate climate resilience measures to protect profitability.
The West leads expansion with a 7.22% CAGR through 2031, propelled by concentrated wealth in technology hubs and a consumer ethos that prizes experiential purchase behavior. AEG Presents commits resources to Austin and Nashville Yards projects that harness demographic growth and strong tourism pull, demonstrating a bet on large-format, ESG-compliant infrastructure. California’s strict environmental codes encourage venues to install solar arrays and water recycling, qualifying them for fast-track approvals and some green-bond financing. High labor and real-estate costs push ticket prices upward, yet fan willingness to absorb premiums remains evident, helped by higher regional median income. Wildfire season poses operational risk, prompting contingency routing to inland markets or deployment of advanced air-filtration systems when hosting indoor shows. Despite challenges, the West sets the pace for hybrid streaming integrations as local audiences skew toward early tech adoption.
The Northeast and Midwest collectively cover 30% of the United States live music market, yet face divergent paths. The Northeast retains cultural prestige and proximity to dense population centers, but real-estate scarcity inflates overhead, and aging arenas require costly retrofits. Municipal grants occasionally offset modernization bills when venues can demonstrate tourism spillover, though permitting can stretch timelines. Midwest metros enjoy lower costs and loyal fan bases, making them attractive for soft-ticket dates, but demographic stagnation restrains growth velocity. Cities such as Chicago and Minneapolis invest in festival brands that draw national crowds, partially compensating for fewer large-scale arena projects. Both regions tighten noise rules, referencing public-health studies on sound exposure, compelling operators to invest in directional speaker arrays that limit off-site spill. Each geographic bloc, therefore, charts a nuanced trajectory, balancing opportunity and constraint in line with local economics.
Competitive Landscape
The United States live music market is highly concentrated, with the top five companies controlling the vast majority of annual gross revenue, resulting in a market concentration score of 8. Live Nation leads the industry by integrating promotion, ticketing, and venue ownership into a unified platform. AEG Presents follows, focusing on premium assets and global festival franchises that enhance its leverage with artist managers. Legends’ 2024 takeover of ASM Global injects a new heavyweight that manages 350 facilities and services 164 million guests, reshaping contractual dynamics for food, merchandise, and security. Oak View Group grows via public-private alliances that shift financial burden toward municipalities in return for year-round economic stimulus, evidenced by Climate Pledge Arena and UBS Arena. Regional independents such as Another Planet Entertainment defend niches in the Bay Area and Pacific Northwest by curating local lineups and fostering community ties that major players sometimes overlook.
Technology spend becomes the chief competitive battleground after 2024 investment in operational platforms hit USD 194 million, dwarfing speculative blockchain experiments. Live Nation’s in-house suite integrates cashless point-of-sale, dynamic pricing, and crowd-flow analytics to optimize per-capita revenue. AEG Presents leverages its own data warehouse to offer artists granular insights on regional consumer preferences, sweetening exclusive routing deals. Legends seizes advantage by bundling venue management with hospitality packages, giving it levers to control the end-to-end guest journey. Independents counterweight scale disadvantages by deploying lean SaaS solutions that reduce overhead and enable agile ticket promotions. Regulatory pressure on pricing transparency could narrow the technology gap if new rules diminish returns from proprietary algorithmic edge.
Strategic diversification underpins long-run viability. Live Nation partners with Athletic Brewing to tap the non-alcohol segment, aligning with shifting consumer health priorities. Oak View Group’s layout of renewable-energy microgrids inside arenas buffers against rising utility tariffs and appeals to ESG-mandated sponsors. Ticketmaster’s NFT-gated presales trial unlocks collector value while alleviating bot activity, though viability hinges on gas-fee volatility and mainstream wallet adoption. Companies unable to meet evolving sponsor expectations for sustainability metrics risk contract erosion. Against that backdrop, secondary-market venue clusters offer newcomers like Red Mountain Entertainment entry points if they adopt fan-centric pricing, discount mid-week programming and partner with local tourism bureaus for shared marketing spend.
United States Live Music Industry Leaders
Live Nation Entertainment
AEG Presents
ASM Global
Oak View Group
Another Planet Entertainment
- *Disclaimer: Major Players sorted in no particular order

Recent Industry Developments
- August 2024: Legends completed the acquisition of ASM Global, creating a venue management entity operating 350+ facilities globally and serving 164 million guests annually, fundamentally reshaping competitive dynamics in venue operations and challenging traditional promoter-venue ownership models.
- July 2024: Live Nation Entertainment announced a USD 1 billion investment across 18 new venues, with Brooklyn Paramount opening as the flagship facility, demonstrating the company's strategic focus on large-format venues that maximize revenue per event while achieving operational economies of scale.
- June 2024: AEG Presents expanded into the Austin market with new venue development and announced the Nashville Yards venue "The Pinnacle," targeting high-growth markets with favorable demographics and supportive local policies for venue development initiatives.
- May 2024: atVenu raised USD 130 million in Series B funding to expand venue merchandise and food & beverage commerce technology, reflecting investor confidence in operational infrastructure solutions that optimize ancillary revenue streams for venue operators.


United States Live Music Market Report Scope
The live music industry in the United States refers to the entertainment and music business industry dedicated to organizing, promoting, and staging live musical performances for audiences.
The US live music market is segmented by application, revenue, age group, and venue size. By application, the market is segmented into concerts, festivals, theaters, parties, corporate events, and weddings. By revenue, the market is segmented into tickets, sponsorship, and merchandising. By age group, the market is segmented into children, teenagers, adults, and seniors. By venue size, the market is segmented into small, medium, and large. The report offers market sizes and forecasts in terms of value (USD) for all the above segments.
| Concerts |
| Festivals |
| Theater |
| Corporate Events |
| Weddings |
| Tickets |
| Sponsorship |
| Merchandising |
| Children |
| Teenagers |
| Adults |
| Seniors |
| Small (less than 1,000 seats) |
| Medium (1,001- 10,000 seats) |
| Large (greater than 10,000 seats) |
| Northeast |
| Midwest |
| South |
| West |
| By Application | Concerts |
| Festivals | |
| Theater | |
| Corporate Events | |
| Weddings | |
| By Revenue Stream | Tickets |
| Sponsorship | |
| Merchandising | |
| By Age Group | Children |
| Teenagers | |
| Adults | |
| Seniors | |
| By Venue Size | Small (less than 1,000 seats) |
| Medium (1,001- 10,000 seats) | |
| Large (greater than 10,000 seats) | |
| By Geography | Northeast |
| Midwest | |
| South | |
| West |


Key Questions Answered in the Report
How large is the United States live music market in 2026?
It stands at USD 19.7 billion and is projected to reach USD 26.93 billion by 2031, reflecting a 6.45% CAGR.
Which application segment currently generates the most revenue?
Concerts remain the cornerstone, accounting for 45.21% of 2025 revenue.
What growth prospects exist for sponsorship revenue?
Sponsorship is poised for a 9.95% CAGR as brands pivot toward experiential engagement at venues.
Which region is expanding fastest?
The West records the top regional CAGR of 7.22% through 2031, fueled by technology-sector affluence and new venue builds.
How are ticket-price regulations evolving?
Multiple states consider rules requiring upfront price ceilings and limiting dynamic surges, directly affecting pricing strategies.
What role do hybrid concerts play post-pandemic?
Hybrid streams now complement in-person shows, adding incremental revenue and broadening access without cannibalizing attendance.
Page last updated on:


