Subscription E-commerce Market Size and Share
Market Overview
| Study Period | 2020 - 2031 |
|---|---|
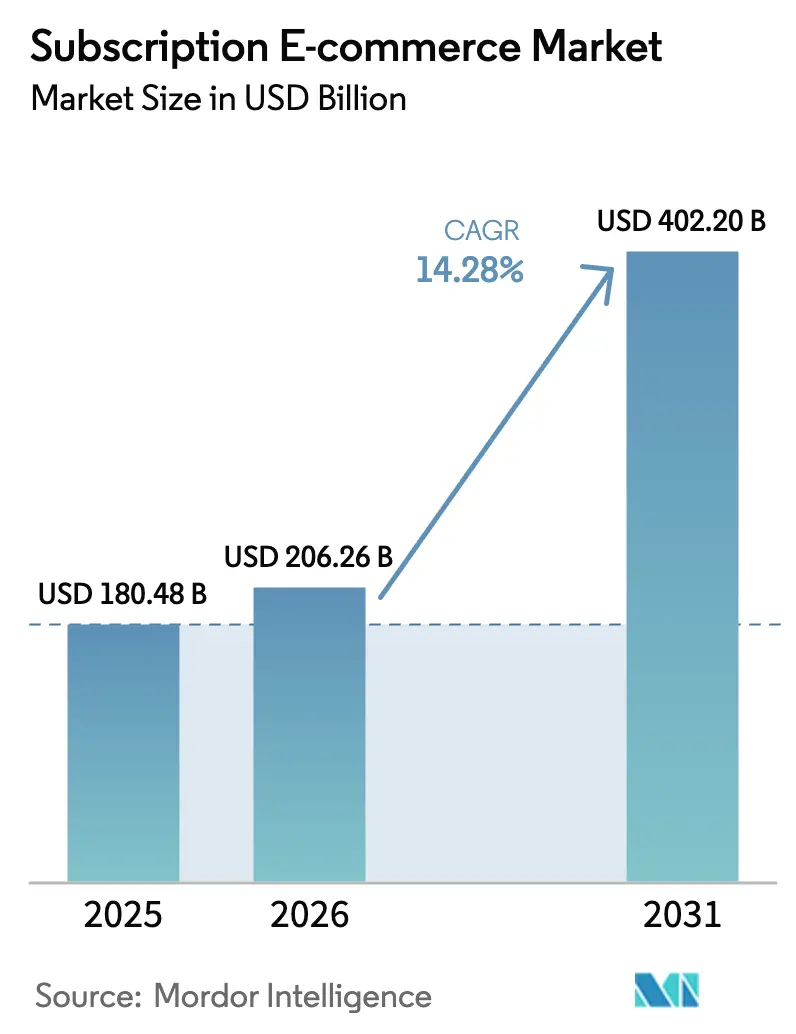
| Market Size (2026) | USD 206.26 Billion |
| Market Size (2031) | USD 402.2 Billion |
| Growth Rate (2026 - 2031) | 14.28% CAGR |
| Fastest Growing Market | Asia Pacific |
| Largest Market | North America |
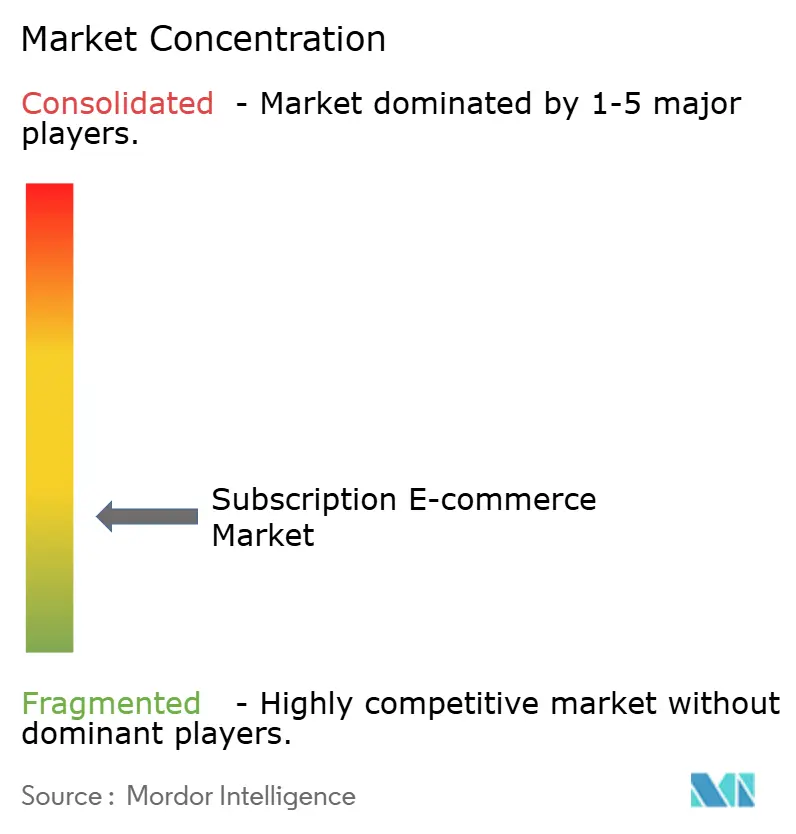
| Market Concentration | Low |
Major Players *Disclaimer: Major Players sorted in no particular order Image © Mordor Intelligence. Reuse requires attribution under CC BY 4.0. | |
Subscription E-commerce Market Analysis by Mordor Intelligence
The Subscription E-commerce market size is expected to grow from USD 180.48 billion in 2025 to USD 206.26 billion in 2026 and is forecast to reach USD 402.2 billion by 2031 at 14.28% CAGR over 2026-2031.
Rising consumer comfort with auto-renewals, an enterprise shift toward predictable recurring revenue, and rapid application of artificial-intelligence personalisation engines all reinforce momentum in the subscription e-commerce market. Digital wallets and buy-now-pay-later (BNPL) rails now handle a growing share of transactions, removing checkout friction and broadening premium-tier acceptance in the subscription e-commerce market. Improved last-mile logistics raise confidence in physical-goods plans, while refill-oriented circular models dovetail with corporate sustainability targets, further energising the subscription e-commerce market. Competitive intensity remains high because category specialists coexist with platform conglomerates, each defending share through proprietary data and bundled perks, making strategic diversification essential for all players in the subscription e-commerce market.
Key Report Takeaways
- By subscription model, replenishment captured 35.75% of subscription e-commerce market share in 2025, while hybrid formats are forecast to grow at 19.85% CAGR through 2031.
- By product category, food & beverages led with 22.45% of the subscription e-commerce market share in 2025; health & wellness is set to expand at a 21.15% CAGR to 2031.
- By payment mode, credit & debit cards held 61.65% of the subscription e-commerce market size in 2025; BNPL is the fastest-growing option at a 22.75% CAGR to 2031.
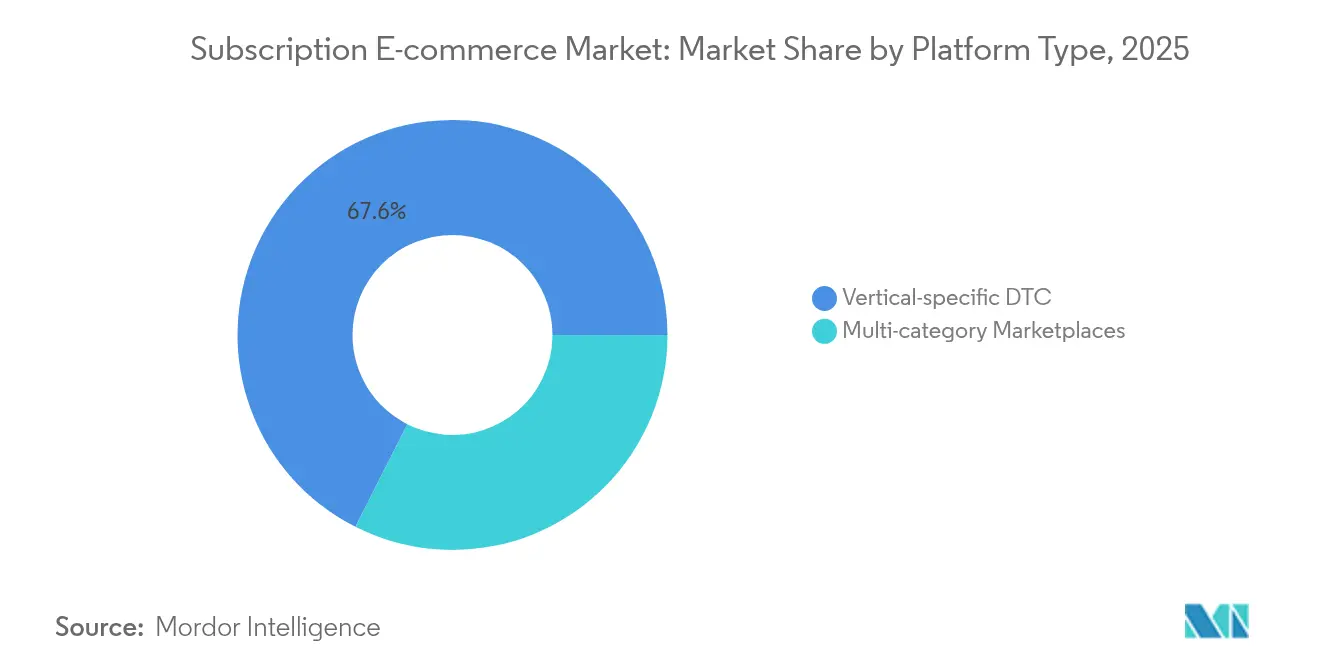
- By platform type, vertical direct-to-consumer operators controlled 67.55% of the subscription e-commerce market share in 2025, while multi-category marketplaces are advancing at a 17.05% CAGR.
- By geography, North America accounted for 38.10% of the subscription e-commerce market share in 2025, whereas Asia-Pacific is projected to expand at a 20.45% CAGR to 2031.
Note: Market size and forecast figures in this report are generated using Mordor Intelligence’s proprietary estimation framework, updated with the latest available data and insights as of 2026.
Global Subscription E-commerce Market Trends and Insights
Drivers Impact Analysis*
| Driver | % Impact on CAGR Forecast | Geographic Relevance | Impact Timeline |
|---|---|---|---|
| AI-powered hyper-personalisation | +2.1% | Global, with APAC and North America leading adoption | Medium term (2-4 years) |
| Shift from ownership to "access" economy | +2.8% | Global, strongest in urban centers and developed markets | Long term (≥ 4 years) |
| Subscription-friendly fintech rails (pay-by-bank, BNPL) | +1.9% | Global, with higher impact in emerging markets | Short term (≤ 2 years) |
| Post-purchase analytics to slash churn | +1.4% | North America & EU primarily, expanding to APAC | Medium term (2-4 years) |
| Corporate sustainability targets boosting refill models | +1.6% | EU and North America core, expanding globally | Long term (≥ 4 years) |
| Digital VAT reforms that harmonize cross-border billing | +0.7% | EU primary impact, spillover to other regions | Medium term (2-4 years) |
| Source: Mordor Intelligence | |||
AI-powered hyper-personalization
Machine-learning engines now parse real-time usage patterns, historical orders, and external triggers to suggest replenishments or upgrades with better than 85% precision. Platforms that rolled out deep-learning models report significant gains in average revenue per user, confirming the revenue-uplift potential for the subscription e-commerce market. Generative AI automates customised content at scale, driving engagement email open rates by 37.37% across the subscription e-commerce market. Dynamic pricing modules use behavioural signals to optimise margins without eroding perceived value, strengthening lifetime profitability. Providers that fuse demographic, behavioural, and psychographic signals achieve up to one-third reduction in voluntary churn, demonstrating that data synthesis is central to resilience in the subscription e-commerce market. As AI tooling becomes more accessible, cost barriers drop, levelling the playing field for mid-sized operators.
Shift from ownership to “access” economy
Millennial and Gen Z cohorts prefer flexible usage over outright ownership, bolstering demand for vehicle, apparel, and electronics subscriptions. Low upfront cost, bundled maintenance, and rapid upgrade cycles heighten appeal, driving steady inflows into the subscription e-commerce market. Urbanisation compresses living space, making temporary access more practical than permanent possession, particularly for furniture or power tools. Automotive OEMs now couple insurance and over-the-air software updates into monthly packages, smoothing electric-vehicle adoption. Experience-oriented consumption is expected to remain a long-run catalyst in dense cities, sustaining structural tailwinds for the subscription e-commerce market.
Subscription-friendly fintech rails
BNPL solutions let consumers split annual commitments into smaller instalments, boosting premium-tier conversions significantly and accelerating revenue realisation in the subscription e-commerce market [1]Mastercard, “Smart Subscriptions Pilot Press Release,” mastercard.com . Digital wallets account for two-thirds of global online payment transactions, effectively reducing checkout abandonment rates and enabling seamless subscription renewals. Concurrently, pay-by-bank solutions utilizing open-banking APIs have significantly lowered merchant transaction costs compared to card payments. This cost efficiency enables businesses to reinvest in loyalty programs within the subscription e-commerce market. Embedded dashboards that summarise live subscriptions inside mobile-banking apps enhance transparency, limiting involuntary churn caused by expired credentials. Financial institutions enjoy recurring interchange income plus data-driven cross-sell opportunities, aligning bank incentives with subscription growth.
Post-purchase analytics to cut churn
Predictive models flag users whose engagement scores dip, enabling targeted rescue campaigns up to 60 days before expected cancellation. Merchants that integrate support transcripts and transaction records design win-back offers that restore 25% of at-risk accounts, materially protecting cash flow in the subscription e-commerce market. Granular insights identify high-stickiness SKUs, guiding inventory moves toward items with superior retention. Continuous A/B testing of retention incentives ensures only the top-performing creatives survive, preserving margin integrity as scale grows. As cloud analytics prices fall, even emerging brands can afford sophisticated churn management, narrowing the capability gap that once favoured incumbents.
Restraints Impact Analysis*
| Restraint | % Impact on CAGR Forecast | Geographic Relevance | Impact Timeline |
|---|---|---|---|
| Subscription fatigue & wallet-share limits | -2.3% | Global, particularly acute in developed markets | Short term (≤ 2 years) |
| Rising customer-acquisition costs on social platforms | -1.8% | Global, with highest impact in North America and EU | Medium term (2-4 years) |
| Fragmented global tax compliance for recurring billing | -1.2% | Global, most severe in cross-border operations | Medium term (2-4 years) |
| High last-mile logistics costs in emerging markets | -1.5% | Emerging markets primarily, APAC and Latin America focus | Long term (≥ 4 years) |
| Source: Mordor Intelligence | |||
Subscription fatigue & wallet-share limits
Visa's Subscription Manager streamlines subscription management by enabling cardholders to pause or cancel services with a single tap, reducing barriers to exit. The ongoing economic challenges have heightened consumer scrutiny over discretionary spending, prompting brands to enhance their offerings with value-added services such as expedited shipping, exclusive content, and VIP customer support. Regulatory requirements for transparent and straightforward cancellation processes are further intensifying the competitive landscape, compelling businesses to differentiate themselves effectively. These dynamics are driving merchants to prioritize utility by integrating complementary services that align with customer needs and justify continued spending. As a result, companies are increasingly focusing on delivering tangible value to retain wallet share amidst evolving consumer expectations and regulatory pressures.
Rising customer-acquisition costs on social platforms
Cost-per-click rates rose significantly after the 2024 algorithm shifts, eroding marketing efficiency for the subscription e-commerce market. Privacy restrictions reduce targeting precision, so conversion rates decline even as budgets climb. To diversify lead sources, merchants lean on influencer affiliates, referral programmes, and owned-media newsletters, though these channels lengthen payback periods. Attribution complexity rises when purchase journeys span video, podcasts, and livestreams, making ROI assessment tougher. Social-commerce features inside short-form video apps open alternative funnels, but they demand constantly refreshed creative assets and disciplined experimentation.
*Our forecasts treat driver/restraint impacts as directional, not additive. The impact forecasts reflect baseline growth, mix effects, and variable interactions.
Segment Analysis
By Subscription Model: Hybrid Designs Command Momentum
Hybrid models combine replenishment, access, and curation, enabling subscribers to toggle elements as needs evolve. The segment is expanding at 19.85% CAGR, the quickest rate within the subscription e-commerce market, reflecting its ability to blend inventory predictability with experiential variety. Replenishment still holds 35.75% of 2025 revenue, confirming durable demand for automatic delivery of consumables where usage patterns remain stable. Access memberships contribute about 25% of revenue, flourishing in digital media and automotive software, where early use unlocks premium value for the subscription e-commerce market. Curated boxes hover near a 15% share, drawing on surprise and personal discovery to sustain emotional bonds. Providers now deploy AI to automate shipment cadence, dissolving boundaries between models and reinforcing a single-customer view across the subscription e-commerce market.
Hybrid flexibility tempers subscription fatigue because users can pause or swap SKUs rather than cancel outright. Merchants gain diversified revenue streams that offset cyclical swings in single-model categories, raising lifetime value for the subscription e-commerce market. Fulfillment centres pool combined orders into a single parcel, lowering per-order logistics costs. Marketing teams insert replenishment staples into curated boxes, nudging customers toward broader baskets. Given these levers, hybrid formats are expected to keep outpacing other models in the subscription e-commerce market through 2031.


By Product Category: Health & Wellness Sets the Pace
Health & wellness subscriptions are projected to grow at 21.15% CAGR, reflecting consumer focus on preventive care, personalised nutrition, and mental-health support . The category spans vitamin refills, tele-consultations, and DNA-guided diet plans synced with wearables, positioning it as a data-rich pillar within the subscription e-commerce market. Food & beverages retained the largest 2025 slice at 22.45% of revenue, with meal-kit operators exploiting supply-chain mastery to cut prep time below 30 minutes while sustaining freshness. Entertainment & digital media rolls out ad-supported tiers to balance price sensitivity with growth, maintaining a steady share of the subscription e-commerce market. Beauty lines integrate augmented-reality skin analysis that lifts recommendation accuracy, while pet-care boxes enjoy superior loyalty because owners prioritise animal well-being even during downturns.
Category diversification cushions the subscription e-commerce market against macro swings because different verticals peak at different seasons. Wellness plans spike during New Year fitness resolutions, whereas food kits rise during school terms. Operators cross-reference data to bundle complementary items, such as protein shakes with fitness apparel, driving multi-category revenue per household. Suppliers gain steadier demand forecasts, smoothing factory utilisation and lowering unit costs within the subscription e-commerce market. Regulators track health claims closely, pushing brands toward transparent labelling backed by scientific evidence to retain trust.
By Payment Mode: BNPL Drives Conversions
Credit and debit cards still represent 61.65% of transaction value, forming the backbone of the subscription e-commerce market payments stack. Yet BNPL is accelerating at 22.75% CAGR, offering zero-interest instalments that resonate with younger customers sceptical of revolving debt. Digital wallets reduce form-fill friction and add biometric checks that lift approval rates, cushioning churn risk for the subscription e-commerce market. Open-banking pay-by-bank rails shave merchant fees and reallocate savings to loyalty incentives. Banks embed subscription dashboards for real-time oversight, mitigating involuntary churn from expired cards.
BNPL suppliers align repayment schedules with billing cycles, creating a coherent renewal experience inside the subscription e-commerce market. Average order values rise 30% when BNPL sits alongside cards, shortening customer-acquisition payback. Regulators scrutinise consumer protection, so providers emphasise credit-worthiness checks and clear disclosures. Merchants monitor default metrics but report manageable risk when partnering with established BNPL firms that shoulder liability. As flexible-payment culture globalises, BNPL is poised to influence premium-tier adoption across the subscription e-commerce market disproportionately.
By Platform Type: Depth Versus Breadth
Vertical direct-to-consumer (DTC) sites commanded 67.55% of 2025 revenue by designing assortments, content, and community features around specific lifestyles. Meal-kit leader HelloFresh alone captured more than half of the share of its niche through recipe innovation and integrated supply chains . In contrast, multi-category marketplaces are expanding at 17.05% CAGR by aggregating diverse subscriptions into a single dashboard, simplifying management for busy consumers. Scale grants marketplaces bargaining power with carriers, enabling rate concessions partly passed to subscribers. Vertical players counter with loyalty ecosystems built on exclusive events, premium add-ons, and proprietary content, enhancing stickiness in the subscription e-commerce market.
Competition between models is not zero-sum; many brands list on marketplaces for reach while nurturing their own vertical sites for community engagement. Marketplaces build sub-brands to emulate vertical authenticity, whereas niche players outsource last-mile logistics to improve coverage. Data-sharing partnerships let marketplaces purchase history inform vertical product development, forming virtuous feedback loops. As the sector matures, hybrid strategies—vertical expertise housed within marketplace rails—are likely to dominate the subscription e-commerce market. Investors reward operators that articulate a clear omnichannel thesis paired with disciplined unit economics, viewing balanced channel strategy as risk mitigation.
Geography Analysis
North America held a 38.10% share in 2025, supported by high disposable income, advanced fulfilment networks, and consumer familiarity with recurring billing. Retailers deepened replenishment programs, and streaming platforms bundled mobile data to elevate perceived value. Regulatory insistence on one-click cancellations pressures brands to differentiate via experience rather than lock-in. Generative-AI chat agents now resolve 70% of support tickets without human escalation, preserving margins while sustaining satisfaction in the subscription e-commerce market.
Asia-Pacific is projected to contribute a 20.45% CAGR through 2031, reflecting smartphone ubiquity, rising middle-class spending, and e-commerce ecosystems that leapfrog brick-and-mortar retail. Digital wallets already outpace cards in transaction volume, fitting seamlessly into mobile-first subscription sign-ups in the subscription e-commerce market. Super-apps combine ride-hailing, meal delivery, and micro-insurance into multi-service bundles, raising average revenue per user at acquisition costs 45% below Western benchmarks. Domestic brands exploit influencer livestream commerce to scale rapidly, while logistics providers invest in cross-border express routes to sustain physical-goods subscriptions. Local regulators emphasise consumer protection and data localisation, shaping compliance frameworks for foreign entrants.
Europe’s prospects brighten after the EU VAT in the Digital Age directive, adopted in February 2025, mandates real-time invoicing by July 2030, slashing compliance burden for cross-border subscription invoices. Nordic markets pioneer sustainable refill models, whereas Southern Europe sees rising appetite for lifestyle boxes. SEPA instant transfers settle payments within seconds, reinforcing consumer trust in recurring direct debits. Diversified cultural preferences keep category mixes varied across Europe, compelling merchants to localise assortments for optimal traction in the subscription e-commerce market.


Competitive Landscape
The top five firms account for only a small share of the revenue, highlighting the fragmented nature of the industry. Leading content providers like Netflix and Spotify leverage proprietary libraries, while companies such as HelloFresh and BARK capitalize on supply-chain efficiencies and experiential differentiation to drive monetization. Platform giants like Amazon bundle video, grocery replenishment, and cloud storage under Prime, raising switching costs. Technology vendors attract strategic investment: Silver Lake’s USD 1.7 billion bid for Zuora underscores the importance of billing infrastructure as the backbone of the subscription e-commerce market. Competitive playbooks converge around vertical integration, data ownership, and AI-driven personalisation.
Mergers and partnerships accelerate capability acquisition. Mastercard bought Minna Technologies in 2024, embedding subscription-management tools into issuer apps to defend against fintech wallets. Streaming giants are exploring joint advertising exchanges to monetise lower-priced ad tiers without cannibalising premium ad-free offerings. Meal-kit firms test dark-kitchen alliances with grocers to widen menu variety and shrink delivery windows, illustrating convergence between e-commerce and food service. Blockchain pilots track provenance for ethically-focused subscribers, adding transparent supply-chain data into the subscription e-commerce market.
Sustainable unit economics decide long-term winners. Firms achieving gross margins above 35% plough surplus into product innovation and AI-guided targeting, yielding positive feedback loops that reinforce leadership. Ventures reliant on aggressive discounts risk margin compression, especially as investors focus on contribution profit and lifetime-value-to-CAC ratios. Community engagement, from branded social forums to experiential pop-ups, acts as an intangible moat in the subscription e-commerce market. Players that articulate a clear road to profitability while nurturing customer loyalty attract capital even in tighter funding cycles.
Subscription E-commerce Industry Leaders
Amazon
Netflix
HelloFresh
Dollar Shave Club
Birchbox
- *Disclaimer: Major Players sorted in no particular order

Recent Industry Developments
- October 2024: Zuora agreed to be acquired by Silver Lake and GIC for USD 1.7 billion, reinforcing investor appetite for billing infrastructure.
- October 2024: Mastercard acquired Minna Technologies to embed subscription control tools inside issuer banking apps.
- June 2024: Amazon expanded its pharmacy subscription to Medicare recipients at USD 5 per month.
- March 2024: Mastercard started Smart Subscriptions pilots that leverage open-banking rails.


Global Subscription E-commerce Market Report Scope
Subscription e-commerce, alternatively labeled as subscription-based or subscription box services, describes a business framework wherein consumers enroll for scheduled deliveries of goods or services at regular intervals, often monthly. This approach has garnered traction across diverse sectors such as cosmetics, food, apparel, and entertainment. The Subscription E-commerce market forecast is segmented by application, end user, and geography. The market is segmented by application into beauty and personal care, food and beverages, entertainment, and other Services. The market is segmented by end users: women, men, and kids. And by geography, the market is segmented into Asia-Pacific, North America, Europe, South America, Middle East & Africa, and the Rest of the World. The reports offer the market sizing and forecasts for the subscription e-commerce market in value (USD) for all the above segments.
| Access (membership) |
| Replenishment |
| Curation / Discovery Boxes |
| Hybrid / Mixed |
| Beauty & Personal Care |
| Food & Beverages |
| Entertainment & Digital Media |
| Fashion & Apparel |
| Health & Wellness |
| Pet Care |
| Kids & Baby |
| Home & Lifestyle |
| Sports & Hobby Kits |
| Other Niches |
| Credit / Debit Card |
| Digital Wallets |
| Buy-Now-Pay-Later (BNPL) |
| Others (Direct Debit, Pay-by-Bank) |
| Vertical-specific DTC |
| Multi-category Marketplaces |
| North America | United States |
| Canada | |
| Mexico | |
| South America | Brazil |
| Argentina | |
| Chile | |
| Peru | |
| Rest of South America | |
| Europe | United Kingdom |
| Germany | |
| France | |
| Italy | |
| Spain | |
| BENELUX (Belgium, Netherlands, Luxembourg) | |
| NORDICS (Denmark, Finland, Iceland, Norway, Sweden) | |
| Rest of Europe | |
| Asia-Pacific | China |
| Japan | |
| India | |
| South Korea | |
| Australia | |
| South-East Asia | |
| Rest of Asia-Pacific | |
| Middle East and Africa | Saudi Arabia |
| United Arab Emirates | |
| South Africa | |
| Nigeria | |
| Rest of Middle East and Africa |
| By Subscription Model Type | Access (membership) | |
| Replenishment | ||
| Curation / Discovery Boxes | ||
| Hybrid / Mixed | ||
| By Product Category | Beauty & Personal Care | |
| Food & Beverages | ||
| Entertainment & Digital Media | ||
| Fashion & Apparel | ||
| Health & Wellness | ||
| Pet Care | ||
| Kids & Baby | ||
| Home & Lifestyle | ||
| Sports & Hobby Kits | ||
| Other Niches | ||
| By Payment Mode | Credit / Debit Card | |
| Digital Wallets | ||
| Buy-Now-Pay-Later (BNPL) | ||
| Others (Direct Debit, Pay-by-Bank) | ||
| By Platform Type | Vertical-specific DTC | |
| Multi-category Marketplaces | ||
| By Geography (Value, US$ Bn) | North America | United States |
| Canada | ||
| Mexico | ||
| South America | Brazil | |
| Argentina | ||
| Chile | ||
| Peru | ||
| Rest of South America | ||
| Europe | United Kingdom | |
| Germany | ||
| France | ||
| Italy | ||
| Spain | ||
| BENELUX (Belgium, Netherlands, Luxembourg) | ||
| NORDICS (Denmark, Finland, Iceland, Norway, Sweden) | ||
| Rest of Europe | ||
| Asia-Pacific | China | |
| Japan | ||
| India | ||
| South Korea | ||
| Australia | ||
| South-East Asia | ||
| Rest of Asia-Pacific | ||
| Middle East and Africa | Saudi Arabia | |
| United Arab Emirates | ||
| South Africa | ||
| Nigeria | ||
| Rest of Middle East and Africa | ||


Key Questions Answered in the Report
What is the current size of the subscription commerce market in 2026?
The subscription commerce market stands at USD 206.26 billion in 2026.
Which subscription model is growing the fastest?
Hybrid plans that merge replenishment, access, and curation are expanding at a 19.85% CAGR through 2031.
Which product category leads the market share today?
Unilever PLC (Dollar Shave Club), Beauty For All Industries (IPSY), HelloFresh SE, Amazon.com Inc. and Blue Apron Holdings Inc. are the major companies operating in the Subscription E-commerce Market.
Which is the fastest growing region in Subscription E-commerce Market?
Food & beverages account for 22.45% of 2025 revenue, driven by meal-kit and specialty-coffee services.
Why is Asia-Pacific the fastest-growing region?
Mobile-first behaviour, high digital-wallet use, and rising middle-class incomes propel Asia-Pacific to a projected 20.45% CAGR through 2031.
How is BNPL influencing subscription uptake?
BNPL spreads annual fees into instalments, lifting premium-tier conversions by up to 60% and driving 22.75% CAGR for BNPL-enabled transactions.
What factors contribute to high subscription churn?
Wallet-share limits, rising acquisition costs, and mandated easy-cancel paths drive churn toward 40% in mature markets.
Page last updated on:


